

Abstract
Over the last decade 13C magnetic resonance spectroscopy (13C MRS) combined with the infusion of [1-13C]glucose has been used to measure the cerebral rate of the glutamate–glutamine cycle (Vcyc). However, the effect of the astroglial label dilution pathways on the accuracy and precision of the 13C MRS measurement of Vcyc has not been evaluated or realized. In this report, we use the numerical Monte Carlo method to study the effect of astroglial dilution on the reliability of extracting Vcyc using the neuronal–astroglial two-compartment metabolic model and [1-13C]glucose infusion. The results show that omission of the astroglial dilution flux leads to a large loss in the sensitivity of the glutamine turnover curve to Vcyc. When the measured isotopic dilution of cerebral glutamine is accounted for in the analysis, the value of Vcyc can be precisely and accurately determined.
Keywords: brain glucose metabolism, glutamate–glutamine neurotransmitter cycling, magnetic resonance spectroscopy, 13C isotopes
Introduction
Cerebral glutamate and glutamine are predominantly localized in glutamatergic neurons and astroglia, respectively. The measurement of glutamate and glutamine turnover in vivo from 13C-labeled glucose and acetate in the brain has been used to extract the glutamate–glutamine cycling flux between neurons and astroglia using two-compartment metabolic models in several studies over the past decade (e.g., Chhina et al, 2001; de Graaf et al, 2004; Garcia-Espinosa et al, 2004; Gruetter et al, 1998, 2001; Lebon et al, 2002; Oz et al, 2004; Patel et al, 2004, 2005; Shen et al, 1999; Shen and Rothman, 2002; Shen, 2006; Sibson et al, 1997, 1998, 2001; Yang and Shen, 2005). Since the initial reports of measuring the glutamate–glutamine cycling in hyperammonemic rats (Sibson et al, 1997), substantial improvement in both in vivo magnetic resonance spectroscopy (MRS) technology as well as labeling strategies have led to better determination of the glutamate–glutamine neurotransmitter cycle flux (Vcyc), providing a novel metabolic parameter accessible to noninvasive MRS techniques (e.g., de Graaf et al, 2004; Gruetter et al, 1998, 2001; Lebon et al, 2002; Li et al, 2007; Shen et al, 1999; Xu and Shen, 2006). Independent studies using in vivo microdialysis and mass spectrometry to determine the labeling of extracellular glutamate and glutamine have shown that neuronal glutamate (through glutamate–glutamine cycling) is the precursor for 80% to 90% of glial glutamine synthesis, supporting the in vivo 13C MRS findings (Kanamori et al, 2003). Although significant controversies exist in the field (e.g., the rate of label exchange between mitochondrial and cytosolic α-ketoglutarate (Gruetter et al, 2001, Patel et al, 2004; Shen, 2006) and the rate of anaplerosis in brain activation (Oz et al, 2004; Patel et al, 2005)), the reported values of Vcyc in humans (Gruetter et al, 1998, 2001; Shen et al, 1999; Shen and Rothman, 2002) and the relationship between Vcyc and neuronal tricarboxylic acid (TCA) cycle flux (nVTCA) in rodent brain (Shen and Rothman, 2002) are in relatively good agreement. Previous studies have shown that the glutamate–glutamine cycling flux, as measured using 13C-labeled glucose, is significantly altered in human epilepsy (Petroff et al, 2002), in rats in response to anesthesia (Choi et al, 2002; Sibson et al, 1998), administered drugs known to alter glutamate efflux (Patel et al, 2004), and GABA (γ-aminobutyric acid) concentration (Yang and Shen, 2005), as well as in mice deficient in an enzyme of GABA catabolism (Chowdhury et al, 2007). The glutamate–glutamine cycle flux is also sensitive to tissue type (e.g., Vcyc in white matter ≪Vcyc in gray matter) and brain region (de Graaf et al, 2004).
In addition to its interaction with the predominantly neuronal glutamate, the astroglial glutamine is also in exchange with blood, allowing for unlabeled glutamine from blood to be transported into brain (and the glial compartment) (Bröer and Brookes, 2001), effectively diluting the astroglial 13C-labeled glutamine pool. Other astroglial dilution pathways are also likely. For example, fatty acids are oxidized mainly in the astroglia (Auestad et al, 1991), generating unlabeled acetyl-coenzyme A (CoA), producing the same label dilution effect in glutamine. 13C MRS studies of astroglial oxidation of acetate (Badar-Goffer et al, 1990; Blüml et al, 2002; Cerdán et al, 1990; Chapa et al, 1995; Lebon et al, 2002) and octanoate (Ebert et al, 2003)—short- and medium-chain free fatty acids—indicate that these substrates may account for a substantial fraction of glial oxidative metabolism. Acetyl-CoA produced from pyruvate generated through malic enzyme and pyruvate recycling (Cerdán et al, 1990; Kunnecke et al, 1993) in astroglia would also give rise to a dilution of glial glutamate (and glutamine), albeit time dependent, diminishing with the approach to isotopic steady state. Thus, astroglial dilution at both levels (glutamine and acetyl-CoA) affects the isotopic labeling of glutamine during infusion of [1-13C]glucose. Because Vcyc is extracted based on modeling of the labeling of glutamine, astroglial dilution pathways are expected to affect the determination of Vcyc.
The fact that Vcyc is extracted from a nonlinear model merits mathematical investigation of the reliability of its determination using numerical Monte Carlo analysis of the models in use. Recently, effort has been made to perform Monte Carlo analysis of a two-compartment model of the glutamate–glutamine cycle without astroglial dilution (Shestov et al, 2007). In this paper we examine the statistical reliability of determining the value of Vcyc from [1-13C] or [1,6-13C2]glucose infusions using 13C MRS with a two-compartment (neuronal–glial) model (Figure 1A; Shen et al, 1999), which takes into account the dilution of astroglial glutamine 13C labeling. It was found that the reliability of the determination of the glutamate–glutamine cycling flux using two-compartment modeling critically depends on inclusion of the astroglial dilution flux into glutamine.
Figure 1.

(A) The two-compartment model of the glutamate–glutamine cycle between neurons and astrocytes. The main routes of 13C labels are shown: from glucose to pyruvate/lactate through glycolysis, the anaplerotic pathway at astrocytic oxaloacetate, astrocytic and neuronal tricarboxylic acid cycles and the glutamate–glutamine cycle. Released neurotransmitter glutamate is transported from the synaptic cleft to surrounding glial end processes. Once in the astrocytes glutamate is converted to glutamine by glutamine synthetase. Glutamine is released by the astrocytes, transported into the neurons, and converted to glutamate by phosphate-activated glutaminase which completes the cycle. Asp, aspartate; Glc, glucose; Gln, glutamine; Glu, glutamate; α-KG, α-ketoglutarate; Lac, lactate; OAA, oxaloacetate; Pyr, pyruvate; TCA, tricarboxylic acid cycle; Vcyc, glutamate–glutamine cycling rate; Vdil(Gln), astroglial dilution flux rate. See Shen et al (1999) for more details on this two-compartment metabolic model. (B) The simplified two-compartment model in which all 13C labels flow from pyruvate/lactate to neuronal glutamate, which is in exchange with astrocytic glutamine. This simplified model represents the dominant metabolic pathways for the trafficking of 13C labels when [1-13C] or [1,6-13C2]glucose infusion is used to introduce exogenous 13C labels into the brain. That is, most labels flow from pyruvate C3 to neuronal glutamate C4 and then to astrocytic glutamine C4. In both (A, B), the astrocytic dilution flux was explicitly added at the level of glutamine.
Materials and methods
The two-compartment model of the glutamate–glutamine cycle between neurons and astroglia is shown in Figure 1A, as previously described in Shen et al (1999). The main routes of 13C labels are from glucose to pyruvate/lactate through glycolysis, the anaplerotic pathway at astroglial oxaloacetate, astrocytic, and neuronal tricarboxylic acid cycles and the glutamate–glutamine cycle. Released neurotransmitter glutamate is transported from the synaptic cleft to surrounding glial end processes. Once in the astrocytes glutamate is converted to glutamine by glutamine synthetase. Glutamine is released by the astrocytes, transported into the neurons, and converted to glutamate by phosphate-activated glutaminase which completes the cycle. There exist a vast amount of neurochemical evidence supporting the existence of the glutamate–glutamine cycle as well as the assignment of the main 13C label routes depicted in Figure 1A. For example, very recent evidence shows that acutely dissociated astrocytes oxidize glucose and therefore can provide the necessary redox shuttle to support astrocytic anaplerosis (Lovatt et al, 2007; Cerdán et al, 2006). The model given in Figure 1A comprises six free parameters: neuronal TCA cycle rate (nVTCA), astroglial TCA cycle rate (aVTCA), glutamate–glutamine cycling rate (Vcyc), rate of anaplerosis (Vana), lactate dilution flux rate (Vdil(Lac)), and astroglial dilution flux rate (Vdil(Gln)). It uses two coupled differential equations to fit the experimentally determined glutamate C4 and glutamine C4 turnover time courses.
Monte Carlo Simulation
All Monte Carlo simulations were performed using C programming routines written in-house for the two-compartment model shown in Figure 1A, which is identical to that published previously (Shen et al, 1999). Metabolic fluxes were assumed as follows (in μmol/g/min): nVTCA = 0.71, aVTCA = 0.06, Vcyc = 0.32, Vana = 0.04, Vdil(Lac) = 0.05, Vdil(Gln) = 0.14 (see Figure 1A for their definitions), which are the mean metabolic fluxes of resting human brain (Shen et al, 1999). Metabolic concentrations were assumed as follows (in mmol/L): [glutamate] ([Glu]) = 9.1, [glutamine] ([Gln]) = 4.3, based on previous 13C MRS measurements of human brain (Gruetter et al, 1994; Mason et al, 2003, 2007; Shen et al, 1999). The metabolic model consisted of two coupled differential equations which were solved numerically as described previously (Shen et al, 1999), yielding turnover curves of glutamate C4 and glutamine C4 as labeled from [1-13C]glucose.
The Monte Carlo simulation procedure was performed as follows: synthetic curves for glutamate C4 and glutamine C4 were first generated by solving the two coupled differential equations. Then, noise of normal distribution with a predefined standard deviation (σ) was added to the synthetic curves. At the early portion of the curves, if a resultant turnover data point was less than the natural abundance concentration because of addition of random noise, it was forced to take the corresponding natural abundance value. A total of 160 mins of infusion time was simulated with 32 data points per curve (equivalent to a temporal resolution of 5 mins in MRS data acquisition). Two noise levels were investigated, σ = 0.1 and 0.2 μmol/g, which spanned the range of noise levels observed within the experimental data sets. A total of 100 synthetic data sets for each simulation (i.e., different noise realization but with the same σ and other conditions) were generated using the Monte Carlo method. Each data set was then fitted using the metabolic model shown in Figure 1A to obtain the best fit values for each of the free metabolic fluxes. All metabolic fluxes were constrained between 0 and 10 μmol/g/min unless specified otherwise based on previous experiments and constraints. Minimization was performed using the simulated annealing algorithm (Shen et al, 1999) which is well-suited to finding the global minimum in a multidimensional error space (Kirkpatrick et al, 1983). The best fit was defined to be the combination of the free metabolic fluxes which minimizes the sum of squares of the difference between the Monte Carlo data point and the corresponding value calculated using the two-compartment model.
Goodness-of-Fit
In least square minimization, the cost function is proportional to χ2 assuming that the measurement or simulated error per data point has the same noise level (von Mises, 1964). In metabolic modeling fluxes are adjusted to minimize χ2 to find the best fit. The terms in χ2 are not all statistically independent. For nonlinear systems, such as the two-compartment model of the glutamate–glutamine cycle, unfortunately, the analytical derivation of the probability density function for different χ2 at its minimum is not straightforward, if even possible. Instead, Monte Carlo simulation can be used to numerically synthesize turnover data sets drawn from the predefined metabolic model. The synthesized data sets can then be used to determine both the probability density function of the χ2-statistic, and also the accuracy with which metabolic fluxes are reproduced by the fit. The way to ensure that the optimization method of choice works properly for metabolic modeling is to compute χ2 for each fit. Asymptotically for a small set of metabolic fluxes, the χ2-statistic should be normally distributed with a mean value of ∼N−n and a standard deviation of , where N is the total number of data points in the turnover curves and n the number of free metabolic fluxes to be derived from the fit (von Mises, 1964). That is, the mean and standard deviation of χ2 measure the goodness-of-fit in Monte Carlo analysis. If the best fits are derived based on false minima, significant deviation from the above χ2-statistic is expected.
Results
Monte Carlo Simulations
Figure 2A shows the synthetic glutamate C4 and glutamine C4 turnover curves generated by solving the two coupled differential equations describing the model in Figure 1A with the mean metabolic fluxes, and adding normally distributed (Gaussian) noise. The total infusion time is 160 mins with 32 data points per curve and a noise level of σ = 0.1 μmol/g. [1-13C]glucose infusion was assumed. Note that the end point fractional enrichment of glutamine C4 is 26% lower than that of glutamate C4 as observed experimentally (Shen et al, 1999). This data set was subsequently fitted with the two-compartment model using simulated annealing to extract metabolic fluxes by minimizing the summed square cost function which is proportional to χ2. This procedure was then repeated 100 times with the same noise level but different noise realization. A probability density function was obtained for each free flux in the metabolic model as well as for χ2.An example of the probability density function for Vcyc with constraints of aVTCA≤0.1, Vdil(Lac) = 0.05, and Vdil(Gln) = 0.14 μmol/g/min is shown in Figure 2B. In this case, the target mean χ2 is ∼N−n=32×2−4 = 60 with a standard deviation of . The actual mean χ2 obtained is 60.8 with a standard deviation of 11.2, indicating that global minima were found using simulated annealing. Note that the χ2 data can also be used to calculate the ‘noise level’ after minimization by simulated annealing (σmin), i.e., the standard deviation for the difference between synthetic data points and the fitted curves. In the above case, σmin averaged across the 100 simulations is 0.098 μmol/g with a standard deviation of 0.009 μmol/g. The corresponding probability density function of σmin is shown in Figure 2C. In all Monte Carlo simulations performed in this study, the average σmin was always slightly less than the added noise level (σ) with a relative standard deviation of slightly less than 10%. This was expected because poor data fitting caused by false minima was avoided by the use of simulated annealing. This result also indicates that the constraints imposed on the metabolic fluxes, although reducing the relative standard deviation of Vcyc, did not alter the quality of the fit.
Figure 2.
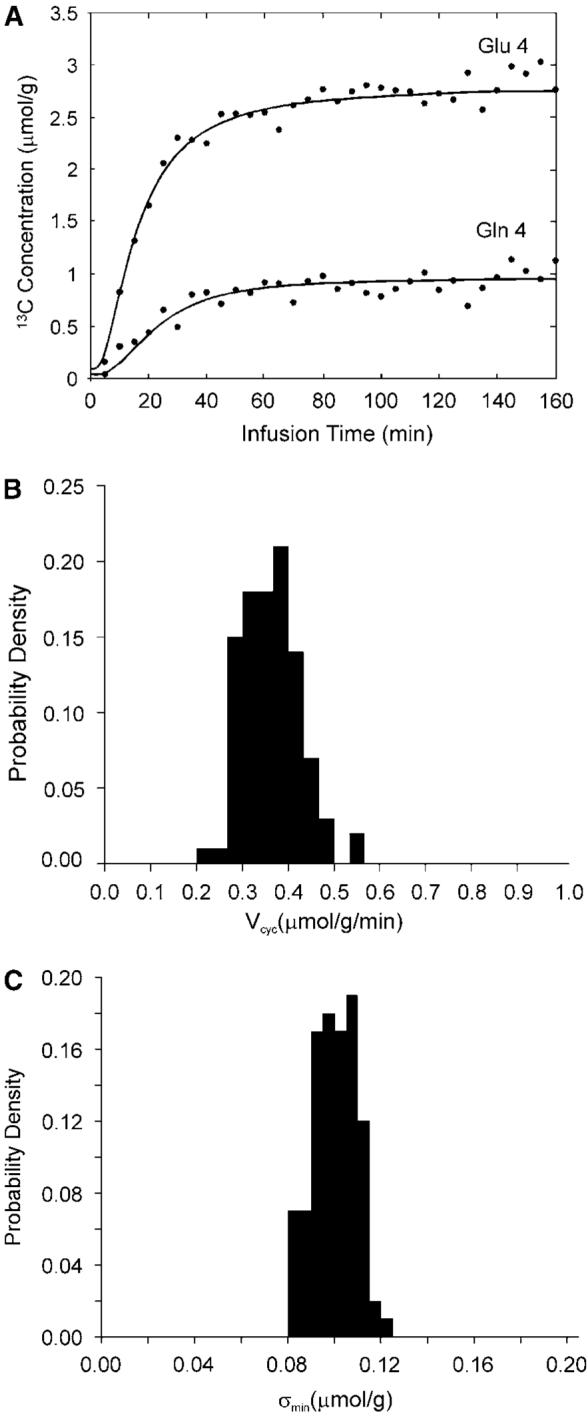
(A) Synthetic glutamate C4 and glutamine C4 turnover curves (lines) generated by solving the two coupled differential equations describing the model in Figure 1A with the mean metabolic fluxes, and adding normally distributed (Gaussian) noise (dots). The total infusion time is 160 mins with 32 data points per curve and a noise level of σ = 0.1 μmol/g. [1-13C]glucose infusion was assumed. The astroglial dilution is revealed in (A) by comparing the fractional enrichments (=13C labeled concentration/total concentration) of glutamate and glutamine C4. At the end point of glucose infusion, the concentration of glutamine and glutamate C4 is 0.96 and 2.75 μmol/g, respectively. The end point fractional enrichment of glutamine C4 is 1−(0.96/2.75)×(9.1/4.3)=26% lower than that of glutamate C4 as observed experimentally (Shen et al, 1999). (B) An example of the probability density function for Vcyc with constraints aVTCA≤0.1, Vdil(Lac)=0.05, and Vdil(Gln)=0.14 μmol/g/min. (C) The corresponding probability density function of the ‘noise level’ after fitting (σmin). The mean χ2 obtained is 60.8 with a standard deviation of 11.2. σmin averaged over the 100 Monte Carlo data sets is 0.098 μmol/g with a standard deviation of 0.009 μmol/g.
Calculated Values of Vcyc, the Impact of Noise, and Constraining Other Fluxes
Table 1 summarizes the results of Monte Carlo simulations performed for each predetermined condition (noise level and constraints) using the model depicted in Figure 1A which includes astroglial dilution. The constraints examined were on the rate of the glial TCA cycle (aVTCA) and on the rate of glutamine efflux (Vefflux) with Vefflux equal to 20% of the flux of glutamine synthesis (VGln). With no constraints and a noise level of σ = 0.1 μmol/g a mean Vcyc of 0.27 μmol/g/min was calculated with a standard deviation of 37%. At the higher noise level of σ = 0.2 μmol/g a lower value of Vcyc (0.16 μmol/g/min) was determined, as the fitting tends to calculate a very high value of aVTCA. When aVTCA was constrained to be < 0.1 μmol/g, the resulting value of Vcyc was 0.32 μmol/g/min for both noise levels and with a reduced standard deviation. An additional reduction in the standard deviation was obtained by also constraining the value for the net rate of glutamine efflux. Constraining the values for the dilution of the glutamate and glutamine C4 pools further reduced the standard deviation of the calculations.
Table 1.
Standard deviation of the glutamate–glutamine cycling flux determined using Monte Carlo analysis of the two-compartment model shown in Figure 1A with astroglial dilutiona,b
| Constraints (μmol/g/min) | Mean Vcyc (μmol/g/min) | Relative s.d. Vcycc(%) | Noise level (μmol/g) |
|---|---|---|---|
| None | 0.16 | 34 | 0.2 |
| 0.27 | 37 | 0.1 | |
| aVTCA≤0.1 | 0.32 | 37 | 0.2 |
| 0.32 | 28 | 0.1 | |
| aVTCA≤0.1, Vefflux = 0.2VGln | 0.26 | 28 | 0.2 |
| 0.26 | 19 | 0.1 | |
| Vdil(Gln)d | 0.31 | 34 | 0.2 |
| 0.33 | 19 | 0.1 | |
| Vdil(Lac)d, Vdil(Gln)d | 0.32 | 29 | 0.2 |
| 0.32 | 17 | 0.1 | |
| aVTCA≤0.1, Vdil(Lac)d, Vdil(Gln)d | 0.33 | 28 | 0.2 |
| 0.33 | 16 | 0.1 |
Vcyc, cerebral rate of the glutamate–glutamine cycle; VTCA, tricarboxylic acid cycle flux; Vefflux, rate of glutamine efflux; Vdil(Gln), astroglial dilution flux rate; Vdil(Lac), lactate dilution flux rate.
All simulations were carried out with a total infusion time of 160 mins and temporal resolution of 5mins (32 time points). Only the glutamate C4 andglutamine C4 turnover curves were used for extraction of the metabolic fluxes.
Mean χ2 of all simulations lies in the range of 59.0–60.8 with a standard deviation in the range of 10.9–11.4.
With respect to the nominal Vcyc=0.32 μmol/g/min.
Constrained to the mean flux rates given in ‘Materials and methods’.
Effects of the Astroglial Dilution Flux on the Accuracy and Precision of Vcyc Determination
To assess the importance of the dilution factor in the accuracy and precision of the calculations, simulations were also performed with Vdil(Gln) forced to a value of zero. When Vdil(Gln) is forced to zero the 13C-labeled glutamine concentration predicted by the model is higher than that shown in Figure 2A. The 13C-labeled glutamine concentration with Vdil(Gln) =0 was made to match that in Figure 2A by reducing the total glutamine concentration to 2.8 mmol/L in the Monte Carlo simulations. As shown in Table 2, for σ=0.2μmol/g, a relative standard deviation of 438% was obtained for Vcyc, indicating this flux cannot be reliably determined under the simulated condition (Vdil(Gln)= 0) using two-compartment modeling. A large decline in uncertainty was observed at the noise level of 0.1 μmol/g, but the relative standard deviation of 66% was still high. When an upper limit of 0.1 μmol/g/min was imposed on aVTCA and simultaneously forcing the glutamine efflux rate to be 20% of glutamine synthesis, a large reduction in the uncertainty of Vcyc was found. In all cases a smaller standard deviation was found when the dilution of glutamine was included in the modeling.
Table 2.
Standard deviation of the glutamate–glutamine cycling flux determined using Monte Carlo analysis when astrocytic dilution is omitted from the two-compartment modela,b
| Constraints (μmol/g/min) | Mean Vcyc (μmol/g/min) | Relative s.d. Vcycc(%) | Noise level (μmol/g) |
|---|---|---|---|
| None | 0.50 | 438 | 0.2 |
| 0.27 | 66 | 0.1 | |
| aVTCA≤0.1, Vefflux = 0.2VGln | 0.27 | 32 | 0.2 |
| 0.26 | 21 | 0.1 |
VTCA, tricarboxylic acid cycle flux; Vefflux, rate of glutamine efflux; VGln, flux of glutamine synthesis.
All simulations were carried out with a total infusion time of 160 mins and temporal resolution of 5 mins (32 time points). Only the glutamate C4 and glutamine C4 turnover curves were used for extraction of the metabolic fluxes. When Vdil(Gln) is forced to zero 13C-labeled glutamine concentration predicted by the model is higher than that shown in Figure 2A. The 13C-labeled glutamine concentration with Vdil(Gln) = 0 was made to match that in Figure 2A by reducing the total glutamine concentration to 2.8 mmol/L in the Monte Carlo simulations. This was done in order to simulate the Gruetter et al (2001) model (Shestov et al, 2007) where astroglial dilution was omitted.
Mean χ2 of all simulations lies in the range of 60.2–61.1 with a standard deviation in the range of 10.9–11.3.
With respect to the nominal Vcyc = 0.32 μmol/g/min.
Discussion
Sources of Isotopic Dilution Fluxes
Glucose is the major source of carbon oxidized in the TCA cycles of brain cells. Although the majority of the 13C label from glucose arrives through glycolysis, other substrates and metabolic pathways may contribute predominantly unlabeled carbon to the TCA cycles. Despite the inflows of unlabeled substrates, the TCA cycle rate can still be correctly determined by incorporating isotopic dilution pathways in the metabolic models. The experimentally determined fractional enrichment of glutamate C4 was smaller than that expected with glucose being the sole carbon source for glutamate. This dilution includes contributions from the influx of unlabeled substrates from blood, including lactate, pyruvate, ketone bodies, free amino acids, as well as amino acids produced by protein degradation, and metabolism in the pentose shunt. On the basis of a quantitative analysis of various carbon influxes into brain reported in the literature, lactate was considered to be the major contribution to this dilution under normal physiologic conditions (Mason et al, 1995). Hence, we have used Vdil(Lac), as described in Shen et al (1999) and in the present study, to represent the lumped effect of these dilution fluxes. GABA is reassimilated into the TCA cycle by contributing carbons to C1–C3 but not C4 or C5 of glutamate and glutamine. Therefore, GABA catabolism does not contribute to isotopic dilution of glutamate and glutamine C4.
Vdil(Lac), presumably dominated by influx of lactate, is expected to cause reduced isotopic enrichment at both glutamate C4 and glutamine C4. In contrast, however, the astroglial dilution flux accounts for an additional ∼26% of label dilution at glutamine C4. There are several potential sources of this dilution. Astroglial glutamine is in exchange with unlabeled glutamine in blood across the blood–brain barrier, primarily mediated by N-system transporters (Bröer and Brookes, 2001). Oxidation of short- and medium-chain free fatty acids (e.g., acetate, butyrate, octanoate) occur preferentially in the astroglia. Findings from studies of rats infused with 14C-acetate (Cruz et al, 2005) or 13C-octanoate (Ebert et al, 2003) indicate that these endogenous free fatty acids at basal blood levels may contribute significantly to astroglial oxidation. For example, Cruz et al (2005) found that acetate utilization could provide 28% to 115% of total astroglial oxidation, depending on brain region and level of activity. The oxidation of the even chain-length free fatty acids will generate unlabeled acetyl-CoA leading to label dilution at glutamine C4 (odd chain length fatty acids such as propionate are metabolized to succinate and would not contribute to glutamate/glutamine C4 dilution).
Leucine and other branched chain amino acids (BCAAs) readily cross the blood–brain barrier and a portion of these are oxidized in the brain (Hutson et al, 2005). [U-14C]leucine injected systemically labels brain proteins and free amino acids, primarily glutamine, glutamate, and aspartate (Patel and Balázs, 1970). The 14C-specific activity ratio of glutamine/glutamate is greater than 1 after postnatal day 15, consistent with ‘small pool’ glutamate metabolism in astroglia (Patel and Balázs, 1970). Thus, leucine and other BCAAs metabolized to acetyl-CoA or glutamate will contribute to isotopic dilution of glutamine C4. The potential dilution generated by BCAA oxidation can be estimated for human brain based on published net uptake rates of leucine and isoleucine (Grill et al, 1992)—quantitatively the most important and relevant to the issue of dilution—and glucose (Ide et al, 2000). The net uptake and catabolism of leucine (arterial–jugular vein difference = 3.8 μmol/L) and isoleucine (1.3 μmol/L), producing 3 and 1 mol of acetyl-CoA per mole of the respective amino acids, would produce 12.7 μmol/L equivalents of acetyl-CoA. In contrast the net uptake of glucose is 550 μmol/L (Ide et al, 2000), which provides 2 mol of acetyl-CoA per mole of glucose or 1100 μmol/L equivalents of acetyl-CoA for oxidation. Assuming that astroglia oxidize 30% of the total acetyl-CoA supplied by glucose, and all of that provided by BCAA, then the latter could account for ∼3.8% ( = 12.7/(0.30×1100)×100) of astroglial oxidation, and a similar percentage of glutamine C4 dilution, which is less than the observed. Thus, oxidation of branched-chain amino acids can explain some but not all of the dilution observed.
As a result of the additional isotopic dilution in astroglia, the fractional enrichment of glutamine C4 is significantly lower than glutamate C4 at all times during [1-13C] or [1,6-13C2]glucose infusion, including isotopic steady state. Without the astroglial dilution flux, the isotopic steady state fractional enrichment of the downstream glutamine C4 would have been the same as that of glutamate C4. The experimentally measured glutamine C4 turnover curve results from a balance between 13C label flows entering the glutamine pool (e.g., the glutamate–glutamine cycling flux) and flows carrying 13C label away from glutamine (e.g., glutamate–glutamine cycling flux and the astroglial dilution flux). The existence of astroglial dilution sensitizes the entire glutamine C4 turnover curve to changes in the glutamate–glutamine cycling flux.
Vdil(Gln) and the Sensitivity of 13C Turnover Curves to Vcyc
In the results of the Monte Carlo simulations listed in Table 1, Vdil(Gln) was shown to have a large influence on the sensitivity of the glutamine C4 turnover curve to the value of Vcyc. Incorporating both the Vdil(Gln) flux into the model and constraining its value significantly affected the relative standard deviation of Vcyc. The relationship between Vdil(Gln) and the sensitivity of the glutamine C4 turnover curve to the value of Vcyc may seem surprising at first. Intuitively, this relationship can be easily explained using a simplified version of the two-compartment model (Figure 1B), in which all 13C labels flow from pyruvate C3 to neuronal glutamate C4, which is in exchange with astroglial glutamine C4. This simplified model represents the dominant metabolic pathway for the trafficking of 13C labels in brain when [1-13C] or [1,6-13C2]glucose infusion is used. For this simple model, the kinetics of 13C label incorporation into glutamine C4 is described by the following differential equation describing the bidirectional label dilution of glutamine C4:
| (1) |
where fe represents the fractional enrichment. The incoming astroglial dilution flux brings in 12C-glutamine C4 and does not explicitly appear in Equation (1). At isotopic steady state,
| (2) |
With Vdil(Gln) = 0, the fractional enrichment of the downstream glutamine C4 approaches that of the upstream glutamate C4 after the initial infusion period, thereby losing sensitivity to the label-feeding flux (Vcyc) with time and leading to an overall reduced sensitivity to Vcyc. At isotopic steady state, the fractional enrichments of glutamine C4 and glutamate C4 are equal for Vdil(Gln) = 0; thus, the isotopic steady state glutamine C4 curve bears no relationship with Vcyc. However, with the Vdil(Gln) term included, Equation (2) of the simplified model clearly shows that the entire glutamine C4 turnover curve (fe(Gln C4) versus time) is sensitive to Vcyc, even at isotopic steady state. The relationship fe(Gln C4) < fe(Glu C4) is maintained at isotopic steady state. Unless Vcyc≫Vdil(Gln), the extent of the label dilution at glutamate C4 will not be the same as that at glutamine C4. As illustrated by Equations (1 and 2), Vdil(Gln) affects the turnover of glutamine C4 quite differently from Vcyc, allowing the two fluxes to be separately determined.
The sensitivity of the glutamine C4 turnover curve to Vcyc, as illustrated by the simplified model shown in Figure 1B and the values given in Table 1, was confirmed using a direct sensitivity analysis of the two-compartment model shown in Figure 1A. Figures 3A and 3B show the effect of changing the value of Vcyc by ±50% (from 0.32 to 0.16 and 0.48 μmol/g/min) while maintaining all other parameters unchanged. In the case of Vdil(Gln) = 0, the end point glutamine C4 intensities converge as the isotopic steady state is approached, and where the fractional enrichments of glutamine C4 and glutamate C4 are equal regardless of Vcyc. Much larger changes in the simulated glutamine C4 turnover curve was clearly seen in Figure 3B for Vdil(Gln) = 0.14 μmol/g/min, indicating that the glutamine C4 enrichment curve is very sensitive to changes in Vcyc, especially so when Vcyc is not much larger than 0.32 μmol/g/min. Note that, in Figure 3B, both the glutamate C4 and glutamine C4 intensities are lower than in Figure 3A because of the additional dilution and due to the glutamine-to-glutamate half of the glutamate–glutamine cycling which passes label dilution from glutamine C4 to glutamate C4. The glutamate C4 turnover curve is also responsive (in the opposite direction) to changes in Vcyc. In fact, the relative constancy of the glutamine C4-to-glutamate C4 ratio after the initial infusion period and its significant sensitivity to Vcyc indicate that this ratio could be used as a surrogate marker for Vcyc in clinical studies where relatively long scan times to capture the full labeling kinetics is difficult or impossible to implement.
Figure 3.
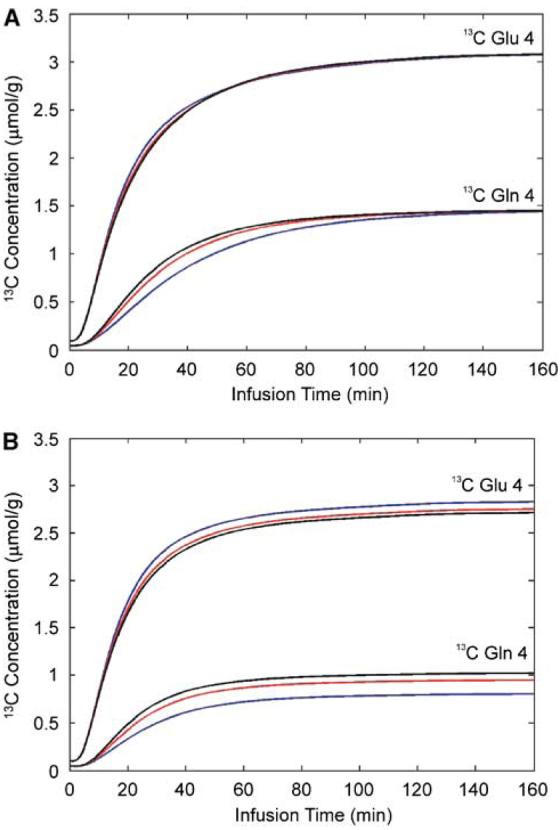
The effect of changing the value of Vcyc by ±50% (from 0.32 to 0.16 and 0.48 μmol/g/min) on the glutamate C4 and glutamine C4 turnover curves while maintaining all other parameters unchanged. (A) Vdil(Gln) = 0. (B) Vdil(Gln) = 0.14 μmol/g/min. Red line: Vcyc = 0.32 μmol/g/min; black line: Vcyc = 0.48 μmol/g/min; blue line: Vcyc = 0.16 μmol/g/min.
The importance of Vdil(Gln) in the sensitivity of the 13C turnover curves to the value of Vcyc was further confirmed by the expected finding of a relatively strong positive correlation between Vcyc and Vdil(Gln) using the metabolic model in Figure 1A in cases where no constraints were applied (Table 1, the first two rows). The corresponding Pearson's product–moment correlation coefficient for Vcyc∼Vdil(Gln) was 0.87 for σ = 0.1 μmol/g and 0.74 for σ = 0.2 μmol/g, respectively. Note that in Figure 3, the incorporation of Vdil(Gln) into the model also causes a decrease in labeled glutamate C4 concentration because of the glutamine-to-glutamate half of the glutamate–glutamine cycle. Because 13C label dilution at the level of pyruvate/lactate (Vdil(Lac)) competes with Vdil(Gln) in fitting to the glutamate and glutamine C4 enrichment levels, a negative correlation is expected between Vdil(Lac) and Vdil(Gln) and, by inference, between Vcyc and Vdil(Lac) for the first two cases given in Table 1 (the first two rows). The corresponding Pearson's correlation coefficient for Vcyc∼Vdil(Lac) is −0.89 for σ = 0.1 μmol/g and −0.42 for σ = 0.2 μmol/g, respectively.
Effects of Constraining other Metabolic Fluxes
A limitation of obtaining metabolic fluxes from glutamate and glutamine C4 labeling curves for [1-13C]glucose as precursor is that the rate information on anaplerosis and the astroglial TCA cycle resides primarily in the early part of the glutamate and glutamine labeling curves, placing a premium on the signal-to-noise ratio of the acquired data. An error in the calculation of these fluxes will propagate into the Vcyc calculation, as shown in Table 1. With no constraints the Vcyc values obtained were 0.27±0.12 and 0.16±0.11 μmol/g/min for noise levels of 0.1 and 0.2 μmol/g, respectively. The corresponding aVTCA values were 0.19±0.27 and 1.11±1.95 μmol/g/min, respectively. The downward trend in the calculated value of Vcyc was due to the high value of aVTCA. At the extreme limit where aVTCA is infinitely fast, it can be shown that the value found for Vcyc will approach asymptotically a low value of ∼0.16 μmol/g/min because of the very rapid labeling of the astroglial glutamate precursors. Table 1 shows that the bias in the mean value of Vcyc was removed when aVTCA was singularly constrained (with an upper limit of 0.1 μmol/g/min). Fitting the simulated glutamate and glutamine C4 time courses with σ = 0.1 μmol/g and the constraint aVTCA≤0.15 or ≤0.20 μmol/g/min gave values of Vcyc of 0.31±0.10 or 0.29±0.10 μmol/g/min, respectively. We note that these constraints reflect values of aVTCA above those found by direct measurement in vivo (Blüml et al, 2002; Gruetter et al, 1998, 2001; Lebon et al, 2002). Furthermore, the Lebon et al (2002) and Blüml et al (2002) studies used glial-specific substrates, which enhanced the accuracy of the measurement.
Another limitation of extracting metabolic fluxes from glutamate and glutamine C4 data and [1-13C] or [1,6-13C2]glucose infusion is that there is no information on the rate of 13C label exchange between the mitochondria and cytosol (Vx). In the model used by Shen et al (1999), Vx was assumed to be much greater than nVTCA. The assumption Vx≫nVTCA is supported by the studies of Patel et al (2004) and de Graaf et al (2004). Nevertheless, it should be pointed out that Vx has little effect on the astroglial isotopic dilution flux Vdil(Gln). Regardless of Vx, the extent of astroglial dilution of glutamine C4 is determined by the relative magnitude of label influx (mainly Vcyc × fe(Glu C4)) versus label efflux (Vdil(Gln) × fe(Gln C4) + Vcyc × fe(Gln C4)). Equation (1) (and therefore its solution) does not change upon addition of Vx into the model shown in Figure 1B.
An additional reduction in the standard deviation was obtained by constraining glutamine efflux from the brain based on experimental measurements of glutamine efflux, ammonia fixation, and isotopic labeling of glutamine through the anaplerotic pathway, which mirrors the approach taken in previous work (Mason et al, 2003, 2007; Shen et al, 1998; Sibson et al, 2001). To explore the effect of this parameter we constrained Vefflux as 0.2VGln based on the average of several measurements of the human brain (Gruetter et al, 2001; Mason et al, 2007; Shen et al, 1999), where VGln = Vcyc + Vefflux. We note that this is a high value because the efflux of glutamine is considerably lower than the rate of anaplerosis from which the value of Vefflux is derived in human MRS studies (Lebon et al, 2002; Mason et al, 2007). This constraint reduced the standard deviation in Vcyc by preventing the assignment of most of VGln to the anaplerotic flux (Vana) due to the relatively low sensitivity of the glutamate and glutamine C4 curves to 13C labeling through this pathway. A secondary effect of this constraint was revealed as a downward bias in the value of Vcyc due to the assumed value of Vefflux being higher than what was used to generate the simulated curves. However, a direct measurement may be obtained by use of a glial-specific substrate to measure the rate of anaplerosis, providing a maximum estimate of Vefflux (Sibson et al, 2001; Mason et al, 2007) or direct NH3 incorporation into glutamine (Shen et al, 1998).
It is significant to note that in previously published studies where fitted glutamate and glutamine C4 time courses were used in the determination of nVTCA and/or Vcyc, the fluxes Vx, Vefflux/Vana, and aVTCA were constrained either explicitly or implicitly (Gruetter et al, 1998, 2001; Shen et al, 1999; Sibson et al, 1997, 1998). Our simulations indicate that the improvements obtained with these constraints are significant. As discussed below the uncertainties we derive are highly consistent with the reported standard deviations in all of the human studies published to date (Table 3).
Table 3.
Experimental measurement of Vcyc in the resting human brain from literaturea
| Reference | Vcyc | nVTCA | Vcyc/nVTCA |
|---|---|---|---|
| Gruetter et al (1998) | 0.32 (0.09) | 0.86 (0.06) | 0.37b |
| Shen et al (1999) | 0.32 (0.05) | 0.71 (0.08) | 0.45b |
| Gruetter et al (2001) | 0.17 (0.05) | 0.57 (0.06) | 0.30b |
| Chhina et al (2001)c | 0.25 (0.08)d | 0.75 (0.06)d | 0.33b |
| Lebon et al (2002) | 0.32 (0.07)e | 0.80f | 0.39 (0.09) |
| Mason et al (2003)g | 0.21 (0.04) | 0.52 (0.12) | 0.40b |
| Mason et al (2007) | 0.34 (0.16) | 0.72 (0.25) | 0.47b |
Vcyc, cerebral rate of the glutamate–glutamine cycle; VTCA, trichloroacetic acid cycle flux.
All flux rates are in the units of μmol/g/min. Data in () are standard deviation in the same unit.
Calculated by the ratio of the mean Vcyc and nVTCA.
Resting brain data only.
Calculated from the means of the reported Vcyc values in Chhina et al (2001).
Calculated by assuming nVTCA = 0.80 μmol/g/min.
Assumed nVTCA.
From VGln (i.v.) and Vcyc = 0.9 VGln as in Mason et al, 2003.
Comparison with Experimentally Derived Metabolic Rates and Uncertainty
Table 3 shows the published mean and standard deviation of nVTCA and Vcyc for all of the human 13C MRS studies to date that analyzed their data using a two-compartment model. In addition the ratio Vcyc/nVTCA is given for each study. The studies of Shen et al (1999) and later ones (Mason et al, 2003, 2007) included the astroglial dilution flux. We note that the standard deviations in our previously published reports are consistent with the results of the simulations presented here. Lebon et al (2002) used the steady state enrichments from the metabolism of [2-13C]acetate, a glial-specific tracer, to determine the ratio of Vcyc/nVTCA. The use of the steady state enrichment data to compute the ratio (relative fluxes) removes the dependence on the early portions of the labeling curves. As shown in Table 3, the value of the ratio, Vcyc/nVTCA, measured with [1-13C]glucose as tracer is consistent with that measured using the glial-specific [2-13C]acetate tracer.
Comparison to Previous Numerical Analysis with Omission of Astroglial Dilution
Previously, Shestov et al (2007) reported a Monte Carlo analysis of the two-compartment model of the glutamate–glutamine cycle as formulated by Gruetter et al (2001) which omitted the astroglial dilution flux. Fitting this model to the glutamate C4 and glutamine C4 13C enrichment curves alone, these authors arrived at values of the relative standard deviation of the glutamate–glutamine cycling flux of up to 10,000%. Although the main difference between our results and those of Shestov et al (2007) may be explained by the astroglial dilution factor, even without this factor our simulations showed higher accuracy and precision in the measurement of Vcyc. This higher statistical reliability was attained in the simulations despite the use of a lower glutamine pool size in the case where no astroglial dilution was assumed (2.8 versus 4.3 mmol/L) to be consistent with the in vivo labeling. Although Monte Carlo analysis is a useful tool to assess reliability of the fitted parameters, this assessment per se critically depends on the goodness-of-fit, which was not reported in the Shestov et al (2007) study. For comparison, the goodness-offit in our simulation study was measured using the χ2-statistic to ensure that the true best fits were obtained in each run.
The value of Vdil(Gln), the astroglial 13C label dilution flux, was included in our previous model at the level of glutamine (Shen et al, 1999). This flux was incorporated into the two-compartment model to account for the ∼26% lower end point fractional enrichment of glutamine C4 as compared with that of glutamate C4. Although not included in the metabolic model of Gruetter et al (2001), Vdil(Gln) was incorporated in a subsequent study by the same group (Oz et al, 2004). Vdil(Gln) was denoted as Vex (with a mean value of 0.16 to 0.22 μmol/g/min in the awake rat brain) to account for the ∼19% lower end point fractional enrichment of glutamine C4 relative to glutamate C4, as measured in the whole brain extract.
In contrast to the Shestov et al (2007) study, we have shown that the neuronal–glial two-compartment model proposed previously can determine the glutamate–glutamine cycling rate to a reasonable precision and accuracy by the use of [1-13C]glucose or [1,6-13C2]glucose infusion alone. The precision and accuracy of Vcyc undoubtably can be further improved with additional independent measurements. Recently, Boumezbeur et al (2008) showed that when [1-13C]glucose and [2-13C]acetate infusion data obtained from the same subject are fitted together, the reliability of Vcyc determined from the neuronal–glial two-compartment model is significantly enhanced.
Conclusion
We found using Monte Carlo analysis that the rate the glutamate–glutamine cycle may be determined within acceptable limits of accuracy and precision from 13C MRS time course data obtained during an infusion of [1-13C] glucose when astroglial dilution is accounted for. The sensitivity and accuracy of the measurement was significantly improved when the experimentally measured isotopic dilutions of both glutamate C4 and glutamine C4 are included in the model (Shen et al, 1999). We also examined the impact of constraints on other rates based on separate experimental measurements, an approach used explicitly or implicitly in previously published work. Further improvements in precision and accuracy may be obtained by constraining the rate of the glial TCA cycle and glutamine efflux based upon other more sensitive measurements. The calculated standard deviation of the simulation results was in good agreement with published standard deviations based on the variation of Vcyc between different subjects.
Acknowledgments
This work was supported by the Intramural Program of NIH, NIMH, NS37527 (NINDS), and DK27121 (NIDDK).
Footnotes
Disclosure/conflict of interest
The authors have no duality of interest.
References
- Auestad N, Korsak RA, Morrow JW, Edmond J. Fatty acid oxidation and ketogenesis by astrocytes in primary culture. J Neurochem. 1991;56:1376–86. doi: 10.1111/j.1471-4159.1991.tb11435.x. [DOI] [PubMed] [Google Scholar]
- Badar-Goffer RS, Bachelard HS, Morris PG. Cerebral metabolism of acetate and glucose studied by 13C-n.m.r. spectroscopy. A technique for investigating metabolic compartmentation in the brain. Biochem J. 1990;266:133–9. doi: 10.1042/bj2660133. [DOI] [PMC free article] [PubMed] [Google Scholar]
- Blüml S, Moreno-Torres A, Shic F, Nguy CH, Ross BD. Tricarboxylic acid cycle of glia in the in vivo human brain. NMR Biomed. 2002;15:1–5. doi: 10.1002/nbm.725. [DOI] [PubMed] [Google Scholar]
- Boumezbeur F, Petersen KF, de Graaf RA, Cline GW, Behar KL, Shulman GI, Rothman DL, Mason GF. Proc Intl Soc Magn Reson Med. Toronto: 2008. Combination of datasets from [2-13C] acetate and [1-13C]glucose experiments improve accuracy of metabolite rates determination in humans. Abstract no. 196. [Google Scholar]
- Bröer S, Brookes N. Transfer of glutamine between astrocytes and neurons. J Neurochem. 2001;77:705–19. doi: 10.1046/j.1471-4159.2001.00322.x. [DOI] [PubMed] [Google Scholar]
- Cerdán S, Kunnecke B, Seelig J. Cerebral metabolism of [1, 2-13C2]acetate as detected by in vivo and in vitro13C NMR. J Biol Chem. 1990;265:12916–26. [PubMed] [Google Scholar]
- Cerdán S, Rodrigues TB, Sierra A, Benito M, Fonseca LL, Fonseca CP, García-Martín ML. The redox switch/redox coupling hypothesis. Neurochem Int. 2006;48:523–30. doi: 10.1016/j.neuint.2005.12.036. [DOI] [PubMed] [Google Scholar]
- Chapa F, Kunnecke B, Calvo R, Escobar del Rey F, Morreale de Escobar G, Cerdan S. Adult-onset hypothyroidism and the cerebral metabolism of (1, 2-13C2) acetate as detected by 13C nuclear magnetic resonance. Endocrinology. 1995;136:296–305. doi: 10.1210/endo.136.1.7828544. [DOI] [PubMed] [Google Scholar]
- Chhina N, Kuestermann E, Halliday J, Simpson LJ, Macdonald IA, Bachelard HS, Morris PG. Measurement of human tricarboxylic acid cycle rates during visual activation by 13C magnetic resonance spectroscopy. J Neurosci Res. 2001;66:737–46. doi: 10.1002/jnr.10053. [DOI] [PubMed] [Google Scholar]
- Choi IY, Lei H, Gruetter R. Effect of deep pentobarbital anesthesia on neurotransmitter metabolism in vivo: on the correlation of total glucose consumption with glutamatergic action. J Cereb Blood Flow Metab. 2002;22:1343–51. doi: 10.1097/01.WCB.0000040945.89393.46. [DOI] [PubMed] [Google Scholar]
- Chowdhury GM, Gupta M, Gibson KM, Patel AB, Behar KL. Altered cerebral glucose and acetate metabolism in succinic semialdehyde dehydrogenase-deficient mice: evidence for glial dysfunction and reduced glutamate/glutamine cycling. J Neurochem. 2007;103:2077–91. doi: 10.1111/j.1471-4159.2007.04887.x. [DOI] [PubMed] [Google Scholar]
- Cruz NF, Lasater A, Zielke HR, Dienel GA. Activation of astrocytes in brain of conscious rats during acoustic stimulation: acetate utilization in working brain. J Neurochem. 2005;92:934–47. doi: 10.1111/j.1471-4159.2004.02935.x. [DOI] [PubMed] [Google Scholar]
- de Graaf RA, Mason GF, Patel AB, Rothman DL, Behar KL. Regional glucose metabolism and glutamatergic neurotransmission in rat brain in vivo. Proc Natl Acad Sci USA. 2004;101:12700–5. doi: 10.1073/pnas.0405065101. [DOI] [PMC free article] [PubMed] [Google Scholar]
- Ebert D, Haller RG, Walton ME. Energy contribution of octanoate to intact rat brain metabolism measured by 13C nuclear magnetic resonance spectroscopy. J Neurosci. 2003;23:5928–35. doi: 10.1523/JNEUROSCI.23-13-05928.2003. [DOI] [PMC free article] [PubMed] [Google Scholar]
- Garcia-Espinosa MA, Rodrigues TB, Sierra A, Benito M, Fonseca C, Gray HL, Bartnik BL, Garcia-Martin ML, Ballesteros P, Cerdan S. Cerebral glucose metabolism and the glutamine cycle as detected by in vivo and in vitro13C NMR spectroscopy. Neurochem Int. 2004;45:297–303. doi: 10.1016/j.neuint.2003.08.014. [DOI] [PubMed] [Google Scholar]
- Grill V, Bjorkman O, Gutniak M, Lindqvist M. Brain uptake and release of amino acids in nondiabetic and insulin-dependent diabetic subjects: important role of glutamine release for nitrogen balance. Metabolism. 1992;41:28–32. doi: 10.1016/0026-0495(92)90186-e. [DOI] [PubMed] [Google Scholar]
- Gruetter R, Novotny EJ, Boulware SD, Mason GF, Rothman DL, Shulman GI, Prichard JW, Shulman RG. Localized 13C NMR spectroscopy in the human brain of amino acid labeling from D-[1-13C]glucose. J Neurochem. 1994;63:1377–85. doi: 10.1046/j.1471-4159.1994.63041377.x. [DOI] [PubMed] [Google Scholar]
- Gruetter R, Seaquist ER, Kim S, Ugurbil K. Localized in vivo13C-NMR of glutamate metabolism in the human brain: initial results at 4 tesla. Dev Neurosci. 1998;20:380–8. doi: 10.1159/000017334. [DOI] [PubMed] [Google Scholar]
- Gruetter R, Seaquist ER, Ugurbil K. A mathematical model of compartmentalized neurotransmitter metabolism in the human brain. Am J Physiol Endocrinol Metab. 2001;281:100–12. doi: 10.1152/ajpendo.2001.281.1.E100. [published erratum appears in Am J Physiol Endocrinol Metab 2004; 286: E320] [DOI] [PubMed] [Google Scholar]
- Hutson SM, Sweatt AJ, Lanoue KF. Branched-chain amino acid metabolism: implications for establishing safe intakes. J Nutr. 2005;135:1557S–64S. doi: 10.1093/jn/135.6.1557S. [published erratum in J Nutr 2005; 135: 2009] [DOI] [PubMed] [Google Scholar]
- Ide K, Schmalbruch IK, Quistorff B, Horn A, Secher NH. Lactate, glucose and O2 uptake in human brain during recovery from maximal exercise. J Physiol. 2000;522:159–64. doi: 10.1111/j.1469-7793.2000.t01-2-00159.xm. [DOI] [PMC free article] [PubMed] [Google Scholar]
- Kanamori K, Kondrat RW, Ross BD. 13C enrichment of extracellular neurotransmitter glutamate in rat brain–combined mass spectrometry and NMR studies of neurotransmitter turnover and uptake into glia in vivo. Cell Mol Biol (Noisy-le-grand) 2003;49:819–36. [PubMed] [Google Scholar]
- Kirkpatrick S, Gelatt CD, Vecchi MP. Optimization by simulated annealing. Science. 1983;220:671–80. doi: 10.1126/science.220.4598.671. [DOI] [PubMed] [Google Scholar]
- Kunnecke B, Cerdan S, Seelig J. Cerebral metabolism of [1, 2-13C2]glucose and [U-13C4]-hydroxybutyrate in rat brain as detected by 13C NMR spectroscopy. NMR Biomed. 1993;6:64–77. doi: 10.1002/nbm.1940060406. [DOI] [PubMed] [Google Scholar]
- Lebon V, Petersen KF, Cline GW, Shen J, Mason GF, Dufour S, Behar KL, Shulman GI, Rothman DL. Astroglial contribution to brain energy metabolism in humans revealed by 13C nuclear magnetic resonance spectroscopy: elucidation of the dominant pathway for neurotransmitter glutamate repletion and measurement of astrocytic oxidative metabolism. J Neurosci. 2002;22:1523–31. doi: 10.1523/JNEUROSCI.22-05-01523.2002. [DOI] [PMC free article] [PubMed] [Google Scholar]
- Li S, Yang J, Shen J. Novel strategy for cerebral 13C MRS using very low RF power for proton decoupling. Magn Reson Med. 2007;57:265–71. doi: 10.1002/mrm.21148. [DOI] [PubMed] [Google Scholar]
- Lovatt D, Sonnewald U, Waagepetersen HS, Schousboe A, He W, Lin JH, Han X, Takano T, Wang S, Sim FJ, Goldman SA, Nedergaard M. The transcriptome and metabolic gene signature of protoplasmic astrocytes in the adult murine cortex. J Neurosci. 2007;27:12255–66. doi: 10.1523/JNEUROSCI.3404-07.2007. [DOI] [PMC free article] [PubMed] [Google Scholar]
- Mason GF, Falk Petersen K, de Graaf RA, Kanamatsu T, Otsuki T, Shulman GI, Rothman DL. A comparison of 13C NMR measurements of the rates of glutamine synthesis and the tricarboxylic acid cycle during oral and intravenous administration of [1-13C]glucose. Brain Res Brain Res Protoc. 2003;10:181–90. doi: 10.1016/s1385-299x(02)00217-9. [published erratum in Brain Res Brain Res Protoc 2003; 11: 143] [DOI] [PubMed] [Google Scholar]
- Mason GF, Gruetter R, Rothman DL, Behar KL, Shulman RG, Novotny EJ. Simultaneous determination of the rates of the TCA cycle, glucose utilization, alpha ketoglutarate/glutamate exchange, and glutamine synthesis in human brain by NMR. J Cereb Blood Flow Metab. 1995;15:12–25. doi: 10.1038/jcbfm.1995.2. [DOI] [PubMed] [Google Scholar]
- Mason GF, Petersen KF, de Graaf RA, Shulman GI, Rothman DL. Measurements of the anaplerotic rate in the human cerebral cortex using 13C magnetic resonance spectroscopy and [1-13C] and [2-13C] glucose. J Neurochem. 2007;100:73–86. doi: 10.1111/j.1471-4159.2006.04200.x. [DOI] [PMC free article] [PubMed] [Google Scholar]
- Oz G, Berkich DA, Henry PG, Xu Y, LaNoue K, Hutson SM, Gruetter R. Neuroglial metabolism in the awake rat brain: CO2 fixation increases with brain activity. J Neurosci. 2004;24:11273–9. doi: 10.1523/JNEUROSCI.3564-04.2004. [DOI] [PMC free article] [PubMed] [Google Scholar]
- Patel AB, Chowdhury GM, de Graaf RA, Rothman DL, Shulman RG, Behar KL. Cerebral pyruvate carboxylase flux is unaltered during bicuculline-seizures. J Neurosci Res. 2005;79:128–38. doi: 10.1002/jnr.20311. [published erratum in J Neurosci Res 2005; 80: 738] [DOI] [PubMed] [Google Scholar]
- Patel AB, de Graaf RA, Mason GF, Kanamatsu T, Rothman DL, Shulman RG, Behar KL. Glutamatergic neurotransmission and neuronal glucose oxidation are coupled during intense neuronal activation. J Cereb Blood Flow Metab. 2004;24:972–85. doi: 10.1097/01.WCB.0000126234.16188.71. [DOI] [PubMed] [Google Scholar]
- Patel AJ, Balázs R. Manifestation of metabolic compartmentation during the maturation of the rat brain. J Neurochem. 1970;17:955–71. doi: 10.1111/j.1471-4159.1970.tb02249.x. [DOI] [PubMed] [Google Scholar]
- Petroff OA, Errante LD, Rothman DL, Kim JH, Spencer DD. Glutamate–glutamine cycling in the epileptic human hippocampus. Epilepsia. 2002;43:703–10. doi: 10.1046/j.1528-1157.2002.38901.x. [DOI] [PubMed] [Google Scholar]
- Shen J. 13C magnetic resonance spectroscopy studies of alterations in glutamate neurotransmission. Biol Psychiatry. 2006;59:883–7. doi: 10.1016/j.biopsych.2005.07.042. [DOI] [PubMed] [Google Scholar]
- Shen J, Petersen KF, Behar KL, Brown P, Nixon TW, Mason GF, Petroff OA, Shulman GI, Shulman RG, Rothman DL. Determination of the rate of the glutamate/glutamine cycle in the human brain by in vivo13C NMR. Proc Natl Acad Sci USA. 1999;96:8235–40. doi: 10.1073/pnas.96.14.8235. [DOI] [PMC free article] [PubMed] [Google Scholar]
- Shen J, Rothman DL. Magnetic resonance spectroscopic approaches to studying neuronal: glial interactions. Biol Psychiatry. 2002;52:694–700. doi: 10.1016/s0006-3223(02)01502-0. [DOI] [PubMed] [Google Scholar]
- Shen J, Sibson NR, Cline G, Behar KL, Rothman DL, Shulman RG. 15N-NMR spectroscopy studies of ammonia transport and glutamine synthesis in the hyperammonemic rat brain. Dev Neurosci. 1998;20:434–43. doi: 10.1159/000017341. [DOI] [PubMed] [Google Scholar]
- Shestov AA, Valette J, Ugurbil K, Henry PG. On the reliability of 13C metabolic modeling with two-compartment neuronal–glial models. J Neurosci Res. 2007;85:3294–303. doi: 10.1002/jnr.21269. [DOI] [PubMed] [Google Scholar]
- Sibson NR, Dhankhar A, Mason GF, Behar KL, Rothman DL, Shulman RG. In vivo13C NMR measurements of cerebral glutamine synthesis as evidence for glutamate–glutamine cycling. Proc Natl Acad Sci USA. 1997;94:2699–704. doi: 10.1073/pnas.94.6.2699. [DOI] [PMC free article] [PubMed] [Google Scholar]
- Sibson NR, Dhankhar A, Mason GF, Rothman DL, Behar KL, Shulman RG. Stoichiometric coupling of brain glucose metabolism and glutamatergic neuronal activity. Proc Natl Acad Sci USA. 1998;95:316–21. doi: 10.1073/pnas.95.1.316. [DOI] [PMC free article] [PubMed] [Google Scholar]
- Sibson NR, Mason GF, Shen J, Cline GW, Herskovits AZ, Wall JE, Behar KL, Rothman DL, Shulman RG. In vivo13C NMR measurement of neurotransmitter glutamate cycling, anaplerosis and TCA cycle flux in rat brain during [2-13C]glucose infusion. J Neurochem. 2001;76:975–89. doi: 10.1046/j.1471-4159.2001.00074.x. [DOI] [PubMed] [Google Scholar]
- von Mises R, editor. Mathematical Theory of Probability and Statistics. Academic Press; New York, NY: 1964. [Google Scholar]
- Xu S, Shen J. In vivo dynamic turnover of cerebral 13C isotopomers from [U-13C]glucose. J Magn Reson. 2006;182:221–8. doi: 10.1016/j.jmr.2006.07.003. [DOI] [PubMed] [Google Scholar]
- Yang J, Shen J. In vivo evidence for reduced cortical glutamate–glutamine cycling in rats treated with the antidepressant/antipanic drug phenelzine. Neuroscience. 2005;135:927–37. doi: 10.1016/j.neuroscience.2005.06.067. [DOI] [PubMed] [Google Scholar]