

Abstract
Despite recent advances the majority of IBD susceptibility ‘genes’ remain undiscovered. Recent data suggest that autoimmune conditions may ‘share’ susceptibility loci. Epidemiological evidence indicate an association between celiac disease and IBD and both conditions demonstrate increased gut permeability. MAGI2, recently implicated in UC and celiac disease, encodes a scaffolding protein involved in epithelial integrity. Our aim was to test MAGI2 variants for association with IBD and also their role in determining intermediate hereditary phenotypes defined by antibody production to microbial antigens. We genotyped 113 MAGI2 SNPs in 681 cases of Crohn’s disease (CD), 259 ulcerative colitis (UC) cases and 195 controls. The most significant IBD association was in intron 6 (rs2160322, p=0.009)) and both UC (p=0.006) and CD (p=0.03) contributed to this association. The most significant CD association was with an intron 2 haplotype (rs7785088/rs323149/rs13246026, p=0.002). We observed highly significant associations with UC in intron 6 (rs7803276/rs7803705, p=0.002) and also significant associations in introns 2, 6 and 20. Significant associations were seen with: IgG ASCA positive CD in intron 3 (p=0.003), intron 6 (p=0.003), and intron 20 (p=0.001); anti-CBir1 positive CD in intron 3 (p=0.0001) and intron 6 (p=0.008); and anti-OMPc positive CD in intron 3 (p=0.0009), and intron 9 (p=0.007). Quantitative antibody levels were also associated with variants in intron 4 (anti-IgA ASCA, p=0.0003 and anti-IgG ASCA, p=0.0002). These findings support the significance of the epithelial barrier in IBD pathogenesis.
Keywords: Inflammatory bowel disease, MAGI2, genetic susceptibility, serology
INTRODUCTION
It is clear from both genetic and clinical perspectives that the inflammatory bowel diseases (IBD) in general and Crohn’s disease (CD) in particular are heterogenous conditions. Early successes in the field of IBD genetics implicated genetic variants that alter innate immunity responses in IBD pathogenesis (1, 2). More recently, through utilizing the technological advances of genome-wide association scans (GWAS), novel ‘pathways’ have been implicated in disease pathogenesis including autophagy(3–5) and the IL23/Th17(6) (7)pathway. Intriguingly recently published data have suggested that a number of autoimmune conditions may ‘share’ genetic susceptibility loci such as the gene encoding the interleukin-23 receptor (L23R), which has not only been implicated in IBD pathogenesis (6) but also in ankylosing spondylitis(8) and psoriasis(9). These findings support earlier genetic data suggesting that there is likely to be a ‘shared’ genetic predisposition to some autoimmune conditions(10, 11) with the exact phenotype being modulated through some other mechanism such as phenotype determining genes and/or environmental factors.
In searching for disease genes one can investigate the relationship with clinical disease and with intermediate phenotypes. Serological immunophenotypes defined by antibody production to microbial antigens (e.g. antibodies to oligomannan, anti-Saccromyces Cerevisiae (ASCA),(both IgG and IgA), the Pseudomonas fluorescens-related protein (anti-I2), Escherichia Coli outer membrane porin C (anti-OMPC) and CBir1 flagellin (anti-CBir1)) are heritable quantitative traits in IBD(11–14). Serotypes are associated with distinct phenotypes and with a more severe course of CD(15, 16) and it is also recognized that more severe phenotypes of genetically complex diseases may contain individuals with a greater genetic contribution. The data that demonstrate that individuals who have a greater reactivity to microbial antigens and have a more severe course of disease carry more NOD2 CD associated genetic variants supports this hypothesis(17). These data also provide support for the association between a defect in innate immunity/bacterial handling and reactivity to microbial antigens.
Despite the powerful nature of the GWASs, it is clear that these studies have not yet identified even the majority of susceptibility alleles for CD, and other genetic approaches are still warranted. Alternative approaches include; the investigation of susceptibility alleles identified from related conditions or diseases; the study of more homogenous IBD groups defined by demographic or clinical phenotypes (e.g. early age of disease onset, more severe disease etc) or immunophenotypes (as discussed above); the study of candidate genes under peaks of linkage; the investigation of human genes implicated from animal models of mucosal inflammation; and the investigation of implicated pathways that contribute to the pathophysiology of IBD. Previously published data from both ‘functional’ (18) and genetic studies(19, 20) have implicated epithelial barrier disruption as a risk factor for developing IBD, and epidemiological evidence suggests an association between IBD and celiac disease(21). In both disorders there is evidence of enhanced intestinal permeability(20, 22, 23)and in CD increased intestinal permeability is apparent in unaffected relatives of people with CD suggesting a primary genetic etiology to this permeability(24, 25). Epithelial barrier integrity is a primary mode of innate defense against commensal bacteria.
Recently an association between a variant in the MYO9B gene that encodes an epithelial scaffolding protein, and the risk of both celiac disease and ulcerative colitis has gone some way to explain this epidemiological association between gluten sensitivity and IBD(26, 27). A further study by Wapenaar et al described an association between variants within the gene encoding membrane associated guanylate kinase, WW and PDZ containing protein 2 (MAGI2) and celiac disease(28). The study also describes a borderline association between a single MAGI2 SNP and UC, but no association was seen between MAGI2 and Crohn’s disease (CD) (28).
MAGI2 is a large gene of approximately 1.4 megabases consisting of 21 exons that encode a protein of 2410 amino acids. MAGI2 is located on chromosome 7 in a genetic region implicated by linkage analyses as harboring susceptibility gene(s) for IBD(29). The aim of our study was to further investigate the role that genetic variants in the tight junction pathway gene MAGI2 may have in the development of CD and UC and also to responses to CD related microbial antigens.
MATERIALS AND METHODS
Subjects
Six hundred and eighty-one CD cases, 259 UC cases and 195 control subjects were included in the study. IBD phenotype was assigned using a combination of standard endoscopic, histological, and radiographic features (15). Controls were included in the study that had no personal or family history of IBD. All study subjects were Caucasian.
Selection of SNPs
The single nucleotide polymorphisms (SNPs) for genotyping were selected using data from the Caucasian data of the International ‘HapMap’ (30–32)and through utilizing the “Tagger” software program (33). SNPs that were shown to tag the major Caucasian haplotypes and that were also compatible with Illumina technology were genotyped. Our aim was to identify SNPs in linkage disequilibrium with all SNPs in the HapMap data with a minor allele frequency ≥ 5%. One hundred and thirteen SNPs were included in the study and HAPLOVIEW predicted that these SNPs formed 19 haplotypes.
Genotyping
DNA was extracted from Epstein Barr virus transformed lymphoblastoid cell lines using a standard technique of proteinase K digestion, organic extraction, and ethanol precipitation (34). The SNPs were genotyped using the validated oligonucleotide ligation assay, Illumina Golden Gate technology (35) (Illumina, San Diego, CA). The full list of 113 SNPs genotyped in this study is listed in supplementary Table 1.
IBD Serological status
Sera were analyzed at Cedars-Sinai Medical Center for expression of antibodies to oligomannan (anti-Saccaromyces Cerevisiae (ASCA),both IgG and IgA), the Pseudomonas fluorescens-related protein (anti-I2), Escherichia Coli outer membrane porin C (anti-OMPC), and CBir1 flagellin (anti-CBir1) in a blinded fashion by enzyme-linked immunosorbent assay (ELISA), as previously described(15, 16). Any antibody level determined as equal to or more than 2 standard deviations above the population mean was designated as positive. In addition, since seroactivity to microbial antigens is a quantitative trait, the antibody level was assessed ‘across’ each genotype (e.g. homozygote for common allele versus heterozygote versus homozygote for rare allele) using linear regression (see statistical methods).
Statistical Analyses
Case control analyses with the Chi squared test (Haploview v4 (31)) were used to test for association with any given phenotype. The p values for association with any phenotype have been represented graphically by calculating the Logarithm of the inverted P value (1/P). All p values reported are two-tailed p values and are not corrected for multiple testing. However, we have calculated the number of expected results to have occurred by chance and those actually observed positive associations for a cut-off p value of ≤ 0.01 (see results).
We used Haploview v4 (31) to determine haplotype blocks using the Gabriel et al confidence interval method (36). Association with IBD phenotypes and immunophenotypes with all haplotypes was determined within Haploview using the Chi squared test. Association with quantitative values of the IBD serologies was calculated in PLINK (http://pngu.mgh.harvard.edu/purcell/plink/)(37) using linear regression. SNPs were excluded from the analysis if they failed to meet Hardy-Weinberg equilibrium (p ≤ 0.01). Since MAGI2 is a large gene, with many SNPs and haplotypes, we have conferred each SNP or haplotype a ‘locus’, so that relationships regarding disease and intermediate phenotypes can be compared (see results section and tables).
ETHICAL CONSIDERATIONS
Subjects and controls were recruited at Cedars-Sinai Medical Center following approval of the Cedars-Sinai Medical Center Institutional Review Board. Blood samples for serological and genetic analyses were drawn following informed consent.
Results
We genotyped 113 SNPs across the MAGI2 gene in 681 CD cases, 259 UC cases and 195 control subjects. One MAGI2 SNP was excluded from the analyses as it failed to meet our criteria for Hardy-Weinberg equilibrium. These SNPs generate 19 haplotype blocks. Overall we observed 34 positive associations with disease and/or with intermediate phenotype at a p value of 0.01 or less, by chance we should have observed 15 associations with this statistical cut-off. Thus 19 of the associations were likely to be true positives.
IBD, UC and CD and MAGI2
The association between the MAGI2 SNPs and haplotypes with IBD, CD and UC are demonstrated graphically in figure 1a and listed in full in table 1. A three marker intron 2 MAGI2 haplotype (rs7785088, rs323149 and rs13246026, MAGI2 locus 1) was protective against IBD susceptibility (IBD haplotype frequency 8.2% vs. control haplotype frequency 12.9%, OR 0.61 (95% CI 0.44–0.86, p = 0.006). CD was the main contributor to this association (OR 0.57, CI 0.40 – 0.81, p = 0.002) with a trend towards association in UC with this haplotype (p = 0.11). CD was also associated with alleles in introns 2, 5, 6 and 20 (table 1). An intron 6 SNP (rs2160322, ‘locus’ 4) was significantly associated with UC, with the common C allele being the risk allele (UC 72.2% vs control allele frequency 63.6% (OR 1.49, 1.12 – 1.97, p = 0.006). Two further SNPs (rs7788384, ‘locus’ 5, and rs2110871, ‘locus’ 9) and a 2 marker haplotype (rs7803276/rs7803705, ‘locus’ 8) from intron 6 were associated with UC susceptibility. Intron 20 (p = 0.03, ‘locus’ 10) and intron 2 (p = 0.02, ‘locus’ 7) SNPs were also associated with UC (table 1 and figure 1A).
Figure 1. Graphical representation of the association between MAGI2 and IBD and IBD phenotypes.
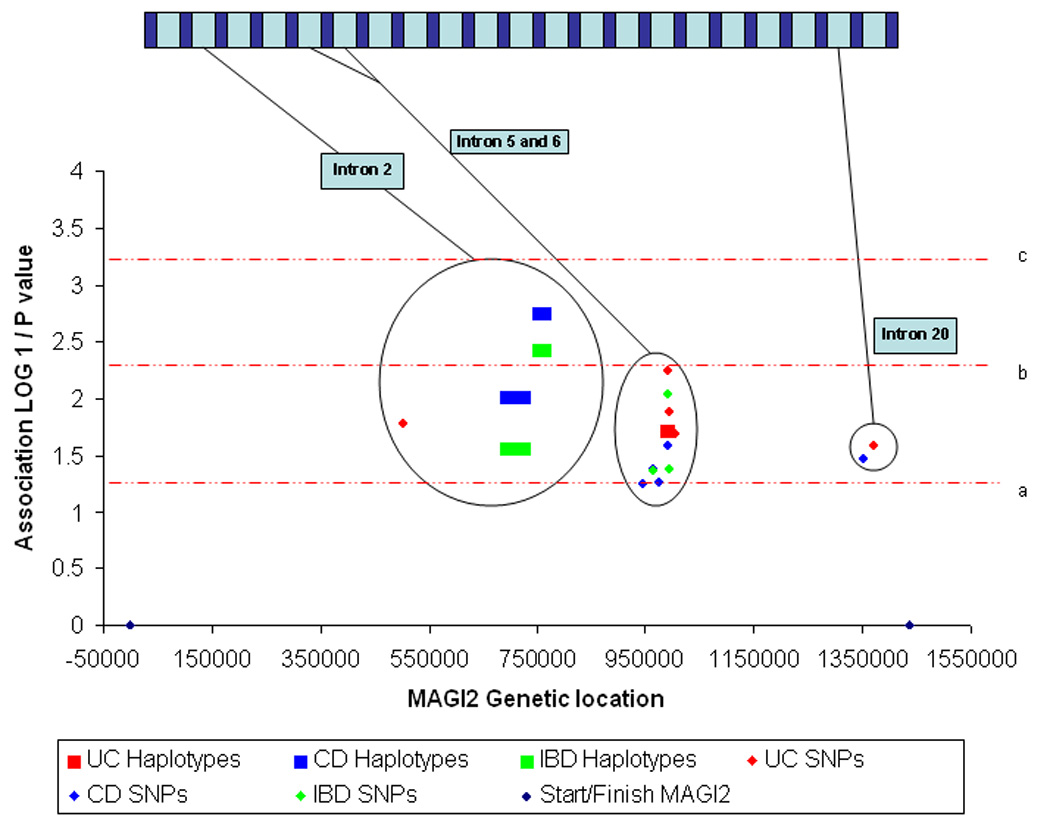
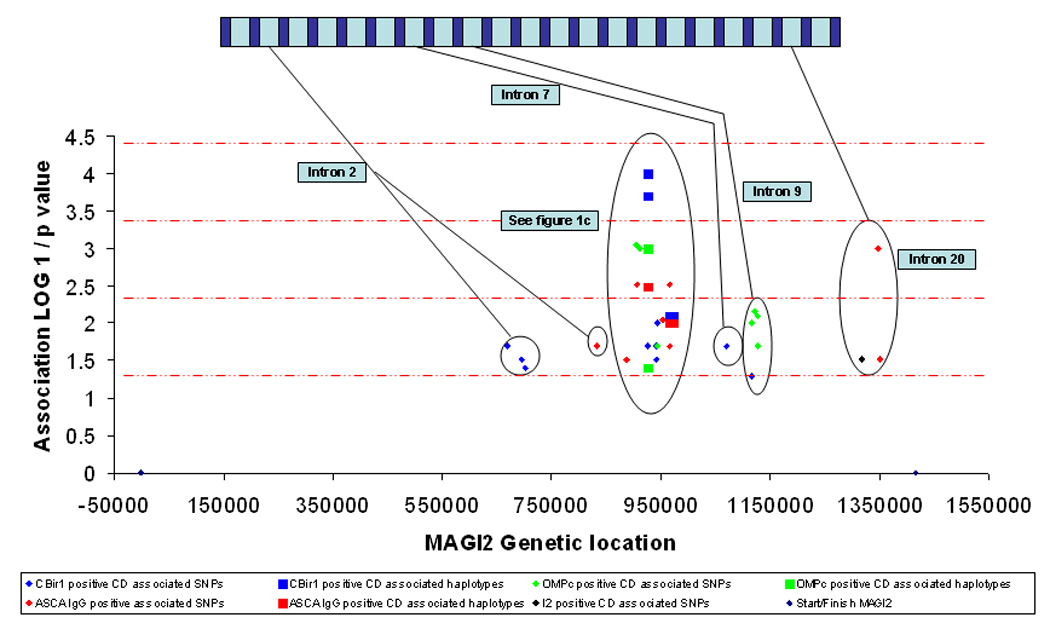
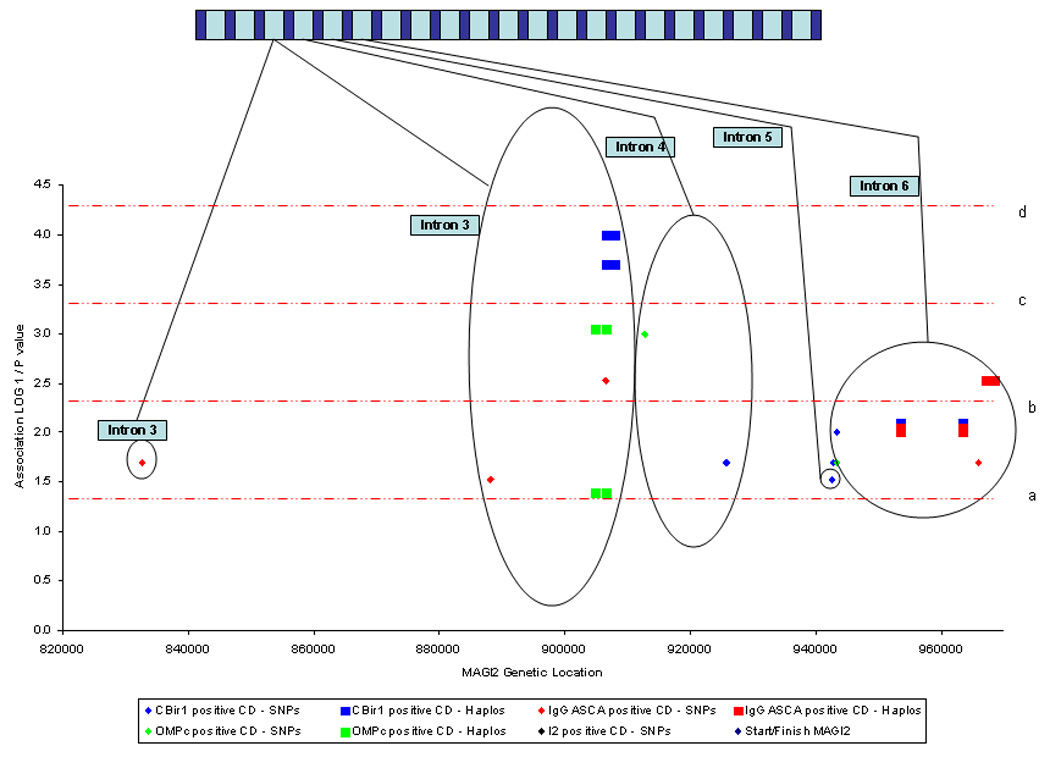
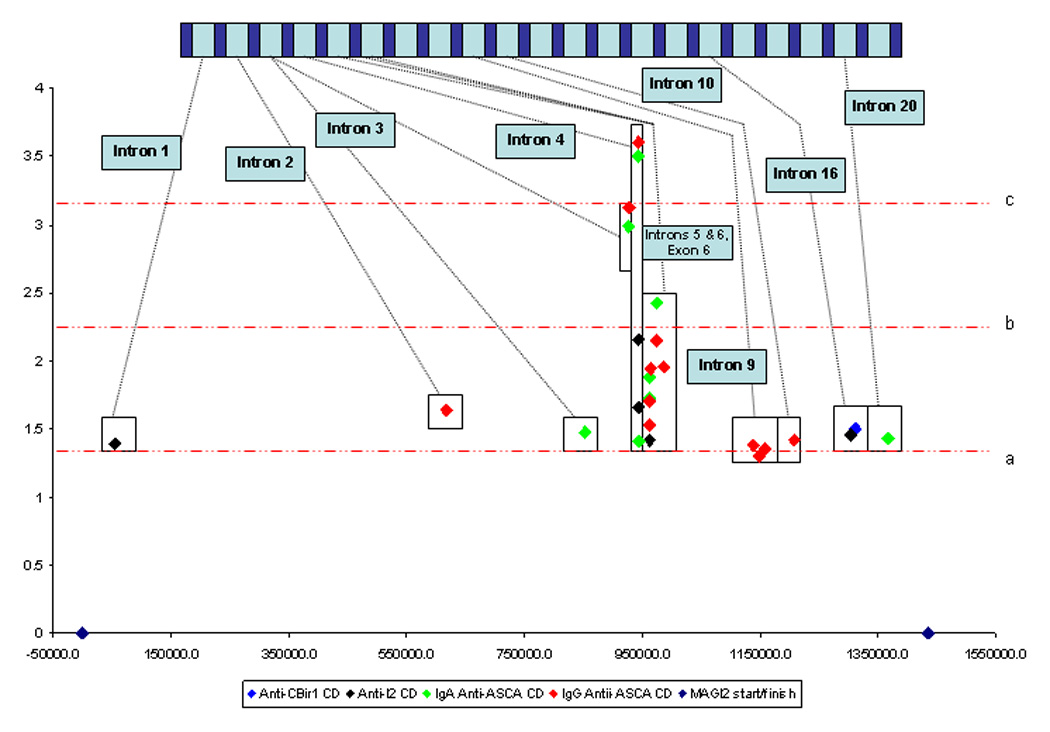
1a. Association between MAGI2 SNPs and haplotypes and IBD, UC and CD. 1b. Association between MAGI2 SNPs and haplotypes and IBD immunophenotypes defined by anti-microbial serology. 1c. Association between MAGI2 SNPs and haplotypes and IBD immunophenotypes defined by anti-microbial serology from intron 3 to intron 6. 1d. Association between MAGI2 SNPs and quantitative values of anti-microbial serologies. The × axis represents a ‘true’ scale of genetic distance with the start and finish of the gene marked by blue diamonds. The gene is represented in a graphic form at the top of the individual diagrams (not to scale). The y axis demonstrates the degree of statistical association in a logarithmic scale through calculating the LOG10 1/p value where the p value has been calculated from the Chi squared test used to test association with MAGI2 alleles. The red dotted lines represent degrees of statistical significance: a – p = 0.05; b – p = 0.005; c – p = 0.0005; and d – p = 0.00005
Table 1. Association between MAGI2 SNPs and haplotypes and IBD, UC and CD.
The MAGI2 locus column identifies loci across the gene to enable the reader an easier method of cross-referencing across the tables.
|
MAGI2 SNP or Haplotype |
MAGI2 locus |
‘Risk’ allele |
Gene location (intron etc) |
Phenotype | ‘Disease’ allele Hz |
Control allele Hz |
OR | 95% CI | P value |
|---|---|---|---|---|---|---|---|---|---|
| rs7785088/rs323149/ | 1 | GTC | Intron 2 | IBD | 8.2% | 12.9% | 0.61 | 0.44 – 0.86 | 0.006 |
| rs13246026 | |||||||||
| rs10242163/rs10808167/ | 2 | GGGC | Intron 2 | IBD | 3.5% | 5.9% | 0.59 | 0.36 –0.96 | 0.04 |
| rs1207881/rs10264296 | |||||||||
| rs10260232 | 3 | T | Intron 5 | IBD | 55.9% | 50.3% | 1.25 | 1.01 –1.56 | 0.05 |
| rs2160322 | 4 | C | Intron 6 | IBD | 70.3% | 63.6% | 1.35 | 1.08 – 1.70 | 0.009 |
| rs7788384 | 5 | G | Intron 6 | IBD | 61.7% | 56.2% | 1.26 | 1.01 – 1.57 | 0.05 |
| rs7785088/rs323149/ | 1 | GTC | Intron 2 | CD | 7.7% | 12.9% | 0.57 | 0.40 – 0.81 | 0.002 |
| rs13246026 | |||||||||
| rs10242163/rs10808167/ | 2 | GGGC | Intron 2 | CD | 3.1% | 5.9% | 0.51 | 0.30 – 0.85 | 0.01 |
| rs1207881/rs10264296 | |||||||||
| rs1026023 | 3 | T | Intron 5 | CD | 56.1% | 50.3% | 1.27 | 1.01 – 1.58 | 0.04 |
| rs2160322 | 4 | C | Intron 6 | CD | 69.6% | 63.6% | 1.31 | 1.03 – 1.66 | 0.03 |
| rs3807736 | 6 | T | Intron 20 | CD | 56.3% | 50.3% | 1.28 | 1.02 – 1.60 | 0.04 |
| rs7799287 | 7 | C | Intron 2 | UC | 39.8% | 32.1% | 1.40 | 1.06 – 1.84 | 0.02 |
| rs17151725/rs7799287 | 7 | GC | Intron 2 | UC | 39.8% | 32.1% | 1.40 | 1.06 – 1.84 | 0.02 |
| rs7803276/rs7803705 | 8 | GC | Intron 6 | UC | 58.0% | 50.2% | 1.37 | 1.05 – 1.78 | 0.02 |
| rs7803276/rs7803705 | 8 | AG | Intron 6 | UC | 21.5% | 30.4% | 0.62 | 0.46 – 0.84 | 0.002 |
| rs2160322 | 4 | C | Intron 6 | UC | 72.2% | 63.6% | 1.49 | 1.12 – 1.97 | 0.006 |
| rs7788384 | 5 | G | Intron 6 | UC | 64.3% | 56.2% | 1.40 | 1.07 – 1.84 | 0.01 |
| rs2110871 | 9 | C | Intron 6 | UC | 73.7% | 66.7% | 1.40 | 1.05 – 1.88 | 0.02 |
| rs7791394 | 10 | G | Intron 20 | UC | 57.5% | 50.0% | 1.35 | 1.04 – 1.76 | 0.03 |
IBD – inflammatory bowel disease. CD – Crohn’s disease. UC – ulcerative colitis. Hz – frequency. OR – odds ratio. CI – confidence intervals.
IBD serotype and MAGI2
Since serotypes have been shown to define particular IBD phenotypes, are heritable traits, and have been associated with genetic variation in innate immunity(17) we hypothesized that CD specific microbial antibody responses could be related to epithelial barrier defects. A number of MAGI2 alleles were associated with CD immunophenotypes; these are listed in table 2 and demonstrated in Figure 1.b and 1.c. Anti-CBir1 positive CD was most highly associated with an intron 3 SNP (T allele of rs10239917, P = 0.0002, locus 12) and a 2 marker haplotype constructed from this SNP (rs10239917) and rs11773635 produces both risk a haplotype (allele TA, P = 0.0002) and a protective haplotype (allele CA, P = 0.0001) for ant-CBir1 positive CD. IgG ASCA positive CD is associated with 2 separate haplotype blocks within intron 6. The GC rs7803705/rs7803276 haplotype (locus 8) is protective for IgG ASCA positive CD (P = 0.003), and the rs6951193/rs759332 haplotype (locus 15) demonstrates both risk alleles (AA, P = 0.01) and protective alleles (GA, P = 0.009) for IgG ASCA positive CD. Anti-OMPC positive CD is associated with the rs11773635 SNP in intron 3 (locus 13, OR 1.56, CI 1.20 – 2.04, P = 0.0009) with no fewer than 4 separate SNPs in intron 9 (loci 23, 25, 26, 27)(rs798285, P = 0.007; rs798287, P = 0.008; rs798292, P = 0.01 and rs798279, P = 0.02), as well as an intronic 4 SNP (locus 24, rs725555, P = 0.001).
Table 2. Association between MAGI2 SNPs and haplotypes and CD associated immunophenotype.
The MAGI2 locus column identifies loci across the gene for ease of cross-referencing.
|
MAGI2 SNP or Haplotype |
MAGI2 locus |
‘Risk’ allele |
Gene location (intron etc) |
Phenotype | Case allele Hz |
Control allele Hz |
OR | 95% CI | P value |
|---|---|---|---|---|---|---|---|---|---|
| rs7791394 | 10 | C | Intron 20 | anti-ASCA+ve CD1 | 57.6% | 50.6% | 1.32 | 1.07 – 1.64 | 0.01 |
| rs38121 | 11 | C | Intron 2 | anti-IgG ASCA +ve CD2 | 72.2% | 66.2% | 1.35 | 1.07 – 1.70 | 0.02 |
| rs10239917 | 12 | T | Intron 3 | anti-IgG ASCA +ve CD2 | 44.2% | 36.3% | 1.39 | 1.12 – 1.73 | 0.003 |
| rs319870 | 13 | A | Intron 3 | anti-IgG ASCA +ve CD2 | 80.1% | 74.7% | 1.36 | 1.05 – 1.76 | 0.02 |
| rs17437602 | 14 | T | Intron 3 | anti-IgG ASCA +ve CD2 | 70.1% | 64.4% | 1.30 | 1.03 – 1.63 | 0.03 |
| rs10239917/rs11773635 | 13 | TA | Intron 3 | anti-IgG ASCA +ve CD2 | 44.2% | 36.3% | 1.39 | 1.12 – 1.73 | 0.003 |
| rs7803705 | 8 | A | Intron 6 | anti-IgG ASCA +ve CD2 | 74.2% | 66.7% | 1.43 | 1.13 – 1.82 | 0.003 |
| rs6951193 | 15 | A | Intron 6 | anti-IgG ASCA +ve CD2 | 72.2% | 65.8% | 1.35 | 1.07 – 1.71 | 0.01 |
| rs7803276 | 8 | A | Intron 6 | anti-IgG ASCA +ve CD2 | 50.7% | 44.2% | 1.30 | 1.05 – 1.61 | 0.02 |
| rs7803705/rs7803276 | 8 | GC | Intron 6 | anti-IgG ASCA +ve CD2 | 25.7% | 33.3% | 0.69 | 0.55 – 0.88 | 0.003 |
| rs6951193/rs759332 | 15 | AA | Intron 6 | anti-IgG ASCA +ve CD2 | 35.5% | 29.0% | 1.35 | 1.07 – 1.70 | 0.010 |
| rs6951193/rs759332 | 15 | GA | Intron 6 | anti-IgG ASCA +ve CD2 | 27.4% | 34.0% | 0.74 | 0.58 – 0.93 | 0.009 |
| rs7791394 | 10 | C | Intron 20 | anti-IgG ASCA +ve CD2 | 59.4% | 50.6% | 1.42 | 1.15 – 1.77 | 0.001 |
| rs4727608 | 16 | C | Intron 20 | anti-IgG ASCA +ve CD2 | 71.8% | 66.2% | 1.30 | 1.03 – 1.65 | 0.03 |
| rs3807728 | 17 | G | Intron 20 | anti-I2+ve CD3 | 49.0% | 43.1% | 1.27 | 1.02 – 1.58 | 0.03 |
| rs10264296 | 2 | C | Intron 2 | anti-CBir1 +ve CD4 | 55.7% | 49.1% | 1.25 | 1.02 – 1.54 | 0.02 |
| rs10808167 | 2 | A | Intron 2 | anti-CBir1 +ve CD4 | 53.0% | 47.0% | 1.27 | 1.02 – 1.58 | 0.03 |
| rs10242163 | 2 | G | Intron 2 | anti-CBir1 +ve CD4 | 59.0% | 53.2% | 1.27 | 1.02 – 1.58 | 0.04 |
| rs10239917 | 12 | T | Intron 3 | anti-CBir1 +ve CD4 | 43.6% | 33.5% | 1.53 | 1.22 – 1.92 | 0.0002 |
| rs10239917/rs11773635 | 12 | CA | Intron 3 | anti-CBir1 +ve CD4 | 35.9% | 46.2% | 0.65 | 0.52 – 0.82 | 0.0001 |
| rs10239917/rs11773635 | 12 | TA | Intron 3 | anti-CBir1 +ve CD4 | 43.6% | 33.5% | 1.53 | 1.22 – 1.92 | 0.0002 |
| rs2110630 | 18 | A | Intron 4 | anti-CBir1 +ve CD4 | 36.0% | 29.9% | 1.31 | 1.04 – 1.66 | 0.02 |
| rs1990577 | 19 | A | Intron 5 | anti-CBir1 +ve CD4 | 49.1% | 43.0% | 1.28 | 1.03 – 1.59 | 0.03 |
| rs3735442 | 20 | A | Exon 6 | anti-CBir1 +ve CD4 | 34.7% | 28.7% | 1.32 | 1.04 – 1.67 | 0.02 |
| (ns) | |||||||||
| s759334 | 21 | A | Intron 6 | anti-CBir1 +ve CD4 | 52.6% | 45.7% | 1.32 | 1.06 – 1.64 | 0.01 |
| rs6951193/rs759333 | 15 | AA | Intron 6 | anti-CBir1 +ve CD4 | 34.4% | 27.5% | 1.38 | 1.09 – 1.75 | 0.008 |
| rs7801139 | 22 | C | Intron 7 | anti-CBir1 +ve CD4 | 30.0% | 24.0% | 1.36 | 1.06 – 1.74 | 0.02 |
| rs798292 | 23 | A | Intron 9 | anti-CBir1 +ve CD4 | 79.3% | 74.6% | 1.30 | 1.01 – 1.69 | 0.05 |
| rs11773635 | 13 | C | Intron 3 | anti-OmpC +ve CD5 | 25.1% | 17.6% | 1.56 | 1.20 – 2.04 | 0.0009 |
| rs10239917/rs11773635 | 13 | CC | Intron 3 | anti-OmpC +ve CD5 | 25.1% | 17.6% | 1.55 | 1.20 – 2.03 | 0.0009 |
| rs10239917/rs11773635 | 13 | CA | Intron 3 | anti-OmpC +ve CD5 | 36.4% | 42.0% | 0.79 | 0.64 – 0.99 | 0.04 |
| rs725555 | 24 | G | Intron 4 | anti-OmpC +ve CD5 | 25.2% | 18.0% | 1.53 | 1.18 – 1.99 | 0.001 |
| rs759334 | 21 | A | Intron 6 | anti-OmpC +ve CD5 | 54.1% | 47.4% | 1.30 | 1.05 – 1.62 | 0.02 |
| rs798285 | 25 | C | Intron 9 | anti-OmpC +ve CD5 | 45.9% | 38.6% | 1.35 | 1.08 – 1.68 | 0.007 |
| rs798287 | 26 | G | Intron 9 | anti-OmpC +ve CD5 | 45.9% | 38.7% | 1.35 | 1.08 – 1.68 | 0.008 |
| rs798292 | 23 | A | Intron 9 | anti-OmpC +ve CD5 | 81.1% | 75.2% | 1.41 | 1.09 – 1.85 | 0.01 |
| rs798279 | 27 | G | Intron 9 | anti-OmpC +ve CD5 | 80.9% | 75.5% | 1.37 | 1.05 – 1.79 | 0.02 |
Anti-ASCA +ve CD – allele frequency in CD patients who are anti-ASCA positive compared to those who are anti-ASCA negative.
anti-IgG ASCA +ve CD – allele frequency in CD patients who are anti-IgG ASCA positive compared to those who are anti-IgG ASCA negative.
anti-I2+ve CD – allele frequency in CD patients who are anti-I2 positive compared to those who are anti-I2 negative.
Anti-CBir1 +ve CD – allele frequency in CD patients who are anti-CBir1 positive compared to those who are anti-CBir1 negative.
Anti-OmpC +ve CD – allele frequency in CD patients who are anti-OMPC positive compared to those who are anti-OMPC negative. Hz – frequency. OR – odds ratio. CI – confidence intervals.
A number of studies have demonstrated that increasing numbers of seropositivity for antibodies to microbial antigens are associated with a more severe course of disease in CD (reviewed in(17)). In addition, combinations of seropositivity may create yet more genetically homogenous groups for testing association. The T allele of rs10239917 (intron 3, locus 12) is associated with both anti-CBir1 and IgG ASCA positive CD (P = 0.000038) when compared to those not positive for both serotypes. Similarly the intron 3 two marker haplotype (rs10239917/rs11773635, locus 12) shows both a risk (CC, P = 0.0055) and protective haplotype (CA, P = 0.0008) with anti-CBir1 and anti-OMPc positive CD.
Quantitative data
Antibody levels were analyzed as a quantitative trait using linear regression and the positive associations are shown in table 3 and in figure 1.d.. Interestingly, the T allele of rs10239917 (locus 12, see above) in intron 3 is also associated with IgG ASCA level.
Table 3. Association between quantitative antibody levels and MAGI2 SNPs.
The MAGI2 locus column identifies loci across the gene for ease of cross-referencing.
| MAGI2 SNP | MAGI2 ‘locus’ |
Associated allele |
Gene position | Antibody level | P value |
|---|---|---|---|---|---|
| rs10239917 | 12 | T | Intron 3 | anti-IgA ASCA | 0.001 |
| rs319872 | 25 | G | intron 3 | anti-IgA ASCA | 0.034 |
| rs17436052 | 26 | G | Intron 4 | anti-IgA ASCA | 0.0003 |
| rs1030015 | 27 | G | Intron 4 | anti-IgA ASCA | 0.039 |
| rs1990577 | 28 | A | Intron 5 | anti-IgA ASCA | 0.013 |
| rs3735442 | 20 | A | Exon 6 | anti-IgA ASCA | 0.019 |
| rs6951193 | 15 | G | Intron 6 | anti-IgA ASCA | 0.004 |
| rs7791394 | 10 | T | Intron 20 | anti-IgA ASCA | 0.038 |
| rs17454991 | 29 | T | Intron 2 | anti-IgG ASCA | 0.023 |
| rs10239917 | 13 | T | Intron 3 | anti-IgG ASCA | 0.0008 |
| rs17436052 | 26 | G | Intron 4 | anti-IgG ASCA | 0.0002 |
| rs1990577 | 27 | A | Intron 5 | anti-IgG ASCA | 0.029 |
| rs7803705 | 8 | G | Intron 6 | anti-IgG ASCA | 0.011 |
| rs6951193 | 15 | G | Intron 6 | anti-IgG ASCA | 0.007 |
| rs759334 | 21 | A | Intron 6 | anti-IgG ASCA | 0.011 |
| rs798343 | 30 | T | Intron 9 | anti-IgG ASCA | 0.044 |
| rs798279 | 24 | A | Intron 9 | anti-IgG ASCA | 0.050 |
| rs798292 | 23 | G | Intron 9 | anti-IgG ASCA | 0.041 |
| rs798356 | 30 | T | Intron 10 | anti-IgG ASCA | 0.038 |
| rs2107992 | 31 | G | Intron 1 | anti-I2 | 0.040 |
| rs17436052 | 32 | G | Intron 4 | anti-I2 | 0.007 |
| rs1030015 | 33 | G | Intron 4 | anti-I2 | 0.022 |
| rs1990577 | 19 | A | Intron 5 | anti-I2 | 0.038 |
| rs3807694 | 34 | A | Intron 16 | anti-I2 | 0.035 |
| rs12668675 | 35 | C | Intron 16 | anti- CBir1 | 0.032 |
P value calculated by logistic regression across the genotype (see statistical methods for further details)
Discussion
Using a haplotype tagging approach, an efficient method of investigating such a large gene, we have identified associations between variants within MAGI2 and IBD, UC and CD, as well as with immunophenotypes defined by seroreactivity to microbial antigens. The findings presented here support, by extension, previous work that identified a weak association with MAGI2 and UC(28) but also identify novel associations with CD. In the previous study a ‘targeted’ approach to the MAGI2 gene was adopted given its size. The investigators tagged SNPs located in the exons and exon-intron boundaries with a mean allele frequency greater than 20%. The single MAGI2 marker (rs6962966, intron 14) that demonstrated association with CD in the paper by Wapenaar et al was not included in our list of tagging SNPs as we had devised this list prior to the publication of the Wapennar et al paper. Not one of the SNPs that we have demonstrated to be associated with IBD were tested in the Dutch IBD collection and none of the SNPs we tested showed strong LD with rs6962966 (D’ < 0.50).
Given the approach we have taken to this large gene it is unlikely that we have identified actual ‘causative’ polymorphisms and are more likely to have identified the SNPs that are in linkage disequilibrium (LD) with the disease and antibody phenotype related polymorphisms. This may be particularly true as, with one exception (rs3735442, synonymous exon 6 SNP, locus 20), the SNPs associated with disease or phenotype are all located within introns. However it is increasingly recognized that many disease associated SNPs may be intronic or even occur at regulatory sites that are thought to be in ‘gene deserts’(38). One IBD GWAS utilized a genome-wide study of global gene expression (39) to demonstrate that a SNP in a gene desert on chromosome 5p that was associated with CD susceptibility was also associated with quantitative expression of the prostaglandin receptor EP4, PTGER4(38). Utilizing the same expression database(39), we have found that two of the disease associated MAGI2 SNPs are in LD with SNPs associated with changes in MAGI2 gene expression (the intron 3 SNP rs17437602,locus 14) is in LD with rs10485909 (D’ = 0.58) which is associated with MAGI2 quantitative gene expression levels (P = 0.0009); the intron 20 SNP rs4727608 (locus 16) is in LD with rs2471597 (D’ = 0.60) which is associated with MAGI2 quantitative gene expression levels (P = 0.001). Furthermore it can be seen that the associations with both CD and UC as well as with disease associated immunophenotypes demonstrated in this study cluster in regions such as intron 3, intron 6 and intron 20. The stronger association with haplotypes than individual SNPs, as seen with locus 1 and CD, locus 8 and UC, and locus 15 and CBir1 positive CD, is further evidence that we have ‘tagged’ risk or protective haplotypes rather than ‘causative’ SNPs suggesting that further fine-mapping and or sequencing targeted at individuals carrying the disease associated haplotypes is warranted.
It is recognized that there is impaired gut barrier function in IBD(20, 22, 25) and increased epithelial permeability may result in a break down in the first line of defense against commensal bacteria by allowing increased translocation of bacteria from the gut lumen. This coupled with other ‘permissive’ genetic variants could lead to an increase in innate and adaptive immune responses to disease related microbial antigens. MAGI2 encodes a scaffolding protein that is involved in epithelial tight junction assembly(40) and hence a defect in MAGI2 expression or function may explain the association between MAGI2 SNPs and antibodies to microbial antigens. The associations with immunophenotypic sub-groups are particularly strong, a finding that reinforces the approach of using homogenous groups based on physiological intermediate phenotypes and not just clinical and demographic parameters as a powerful method for detecting disease associations as has recently been demonstrated in identifying a novel asthma susceptibility locus(41).
The previous association between CD and genetic variation within DLG5(19) had already implicated genetic variants within scaffold proteins involved in epithelial integrity as important molecules in IBD pathogenesis. The scaffolding proteins enable proteins to ‘come together’ thereby allowing them to interact. MAGI2 is known to contain nine potential protein-protein interaction domains including a Guk (guanylate kinase-like) domain, two WW domains (domains that mediate protein-protein interaction through recognizing proline-rich peptide motifs and phosphorylated serine/threonine-proline sites(42)) and six PDZ domains (modular protein interaction domains that bind in a sequence-specific manner to short C-terminal peptides). In addition to its effect on epithelial integrity, MAGI2 has been demonstrated to inhibit cell migration and proliferation via PTEN(phosphatase and tensin homolog)(43). PTEN is a key regulator of cell growth and apoptosis and PTEN protein stability is increased following binding to MAGI2(44). Defects in apoptosis have been implicated in IBD pathogenesis(45).
While the demonstrated MAGI2 associations presented in this paper have not been adjusted by a conservative Bonferroni correction for multiple testing given the large number of SNPs needed to ‘tag’ this gene, we would propose that the excess of significant associations (i.e. more than double than would be expected), the previous finding of association with UC and celiac disease, and the function of the MAGI2 protein as an epithelial scaffolding molecule, as well as the genetic location of the gene, make a convincing argument for the role of MAGI2 variants in both UC and CD pathogenesis. These findings also support the emerging hypothesis of the pleiotropic effects of some genes in predisposing to a number of autoimmune conditions. There is an increased risk of celiac disease in people with type 1 diabetes(46), and interestingly a recent study has suggested that not only is there increased intestinal permeability in type 1 diabetes but this abnormality precedes the development of disease onset(47). These data suggest that MAGI2’s role in IBD pathogenesis and other autoimmune conditions should be further investigated and future studies should concentrate on fine-mapping the gene, although this will be a considerable body of work given that MAGI2 is approximately 1.4MB in length. Investigation on the expression and function of MAGI2 in IBD should also be considered, the results of which would give us further insight into the underlying processes that lead to chronic gastrointestinal inflammation. Furthermore therapeutic strategies that can reverse increased intestinal permeability may restrict antigen presentation to a genetically ‘primed’ immune system thereby ‘preventing’ the development of conditions such as IBD and celiac disease.
Acknowledgments
Financial support: NIH/NIDDK grant P01 DK046763; Cedars-Sinai Medical Center Inflammatory Bowel Disease Research Funds; The Feinstein Family Chair in IBD (SRT); The Cedars-Sinai Board of Governors’ Chair in Medical Genetics (JIR) and the GCRC.
Abbreviations
- CD
Crohn’s disease
- GWAS
genome wide association study
- IBD
inflammatory bowel disease
- MAGI2
membrane associated guany late kinase, WW and PDZ domain containing 2 (dbGENE id 9863)
- OR
odds ratio
- CI
confidence intervals
- SNP
single nucleotide polymorphism
- ASCA
Anti-Saccharomyces cerevisiae antibodies
- IgG
immunoglobulin G
- IgA
immunoglobulin A
- anti-I2
antibody to Pseudomonas fluorescens-related protein
- anti-OmpC
antibody to Escherichia Coli outer membrane porin C
- anti-CBir1
antibody to CBir1 flagellin
- ELISA
enzyme-linked immunosorbent assay
References
- 1.Hugot JP, Chamaillard M, Zouali H, et al. Association of NOD2 leucine-rich repeat variants with susceptibility to Crohn's disease. Nature. 2001;411:599–603. doi: 10.1038/35079107. [DOI] [PubMed] [Google Scholar]
- 2.Ogura Y, Bonen DK, Inohara N, et al. A frameshift mutation in NOD2 associated with susceptibility to Crohn's disease. Nature. 2001;411:603–606. doi: 10.1038/35079114. [DOI] [PubMed] [Google Scholar]
- 3.Rioux JD, Xavier RJ, Taylor KD, et al. Genome-wide association study identifies new susceptibility loci for Crohn disease and implicates autophagy in disease pathogenesis. Nat Genet. 2007;39:596–604. doi: 10.1038/ng2032. [DOI] [PMC free article] [PubMed] [Google Scholar]
- 4.Parkes M, Barrett JC, Prescott NJ, et al. Sequence variants in the autophagy gene IRGM and multiple other replicating loci contribute to Crohn's disease susceptibility. Nat Genet. 2007;39:830–832. doi: 10.1038/ng2061. [DOI] [PMC free article] [PubMed] [Google Scholar]
- 5.Hampe J, Franke A, Rosenstiel P, et al. A genome-wide association scan of nonsynonymous SNPs identifies a susceptibility variant for Crohn disease in ATG16L1. Nat Genet. 2007;39:207–211. doi: 10.1038/ng1954. [DOI] [PubMed] [Google Scholar]
- 6.Duerr RH, Taylor KD, Brant SR, et al. A genome-wide association study identifies IL23R as an inflammatory bowel disease gene. Science. 2006;314:1461–1463. doi: 10.1126/science.1135245. [DOI] [PMC free article] [PubMed] [Google Scholar]
- 7.Taylor KD, Targan SR, Mei L, et al. IL23R haplotypes provide a large population attributable risk for Crohn's disease. Inflamm Bowel Dis. 2008 doi: 10.1002/ibd.20478. [DOI] [PMC free article] [PubMed] [Google Scholar]
- 8.Rueda B, Orozco G, Raya E, et al. The IL23R Arg381Gln non-synonymous polymorphism confers susceptibility to ankylosing spondylitis. Ann Rheum Dis. 2008 doi: 10.1136/ard.2007.080283. [DOI] [PubMed] [Google Scholar]
- 9.Cargill M, Schrodi SJ, Chang M, et al. A large-scale genetic association study confirms IL12B and leads to the identification of IL23R as psoriasis-risk genes. Am J Hum Genet. 2007;80:273–290. doi: 10.1086/511051. [DOI] [PMC free article] [PubMed] [Google Scholar]
- 10.Becker KG, Simon RM, Bailey-Wilson JE, et al. Clustering of non-major histocompatibility complex susceptibility candidate loci in human autoimmune diseases. Proc Natl Acad Sci U S A. 1998;95:9979–9984. doi: 10.1073/pnas.95.17.9979. [DOI] [PMC free article] [PubMed] [Google Scholar]
- 11.Yang H, Taylor KD, Rotter JI. Inflammatory bowel disease. In: King RA JIR, Motulsky AG, editors. Genetic Basis of Common Diseases. 2nd Edition. New York: Oxford University Press; 2002. [Google Scholar]
- 12.Papadakis KA, Yang H, Ippoliti A, et al. Anti-flagellin (CBir1) phenotypic and genetic Crohn's disease associations. Inflamm Bowel Dis. 2007;13:524–530. doi: 10.1002/ibd.20106. [DOI] [PubMed] [Google Scholar]
- 13.Mei L, Targan SR, Landers CJ, et al. Familial expression of anti-Escherichia coli outer membrane porin C in relatives of patients with Crohn's disease. Gastroenterology. 2006;130:1078–1085. doi: 10.1053/j.gastro.2006.02.013. [DOI] [PubMed] [Google Scholar]
- 14.Sutton CL, Yang H, Li Z, et al. Familial expression of anti-Saccharomyces cerevisiae mannan antibodies in affected and unaffected relatives of patients with Crohn's disease. Gut. 2000;46:58–63. doi: 10.1136/gut.46.1.58. [DOI] [PMC free article] [PubMed] [Google Scholar]
- 15.Mow WS, Vasiliauskas EA, Lin YC, et al. Association of antibody responses to microbial antigens and complications of small bowel Crohn's disease. Gastroenterology. 2004;126:414–424. doi: 10.1053/j.gastro.2003.11.015. [DOI] [PubMed] [Google Scholar]
- 16.Targan SR, Landers CJ, Yang H, et al. Antibodies to CBir1 flagellin define a unique response that is associated independently with complicated Crohn's disease. Gastroenterology. 2005;128:2020–2028. doi: 10.1053/j.gastro.2005.03.046. [DOI] [PubMed] [Google Scholar]
- 17.Devlin SM, Yang H, Ippoliti A, et al. NOD2 variants and antibody response to microbial antigens in Crohn's disease patients and their unaffected relatives. Gastroenterology. 2007;132:576–586. doi: 10.1053/j.gastro.2006.11.013. [DOI] [PubMed] [Google Scholar]
- 18.Zeissig S, Burgel N, Gunzel D, et al. Changes in expression and distribution of claudin 2, 5 and 8 lead to discontinuous tight junctions and barrier dysfunction in active Crohn's disease. Gut. 2007;56:61–72. doi: 10.1136/gut.2006.094375. [DOI] [PMC free article] [PubMed] [Google Scholar]
- 19.Stoll M, Corneliussen B, Costello CM, et al. Genetic variation in DLG5 is associated with inflammatory bowel disease. Nat Genet. 2004;36:476–480. doi: 10.1038/ng1345. [DOI] [PubMed] [Google Scholar]
- 20.Hollander D, Vadheim CM, Brettholz E, et al. Increased intestinal permeability in patients with Crohn's disease and their relatives. A possible etiologic factor. Ann Intern Med. 1986;105:883–885. doi: 10.7326/0003-4819-105-6-883. [DOI] [PubMed] [Google Scholar]
- 21.Tursi A, Giorgetti GM, Brandimarte G, et al. High prevalence of celiac disease among patients affected by Crohn's disease. Inflamm Bowel Dis. 2005;11:662–666. doi: 10.1097/01.mib.0000164195.75207.1e. [DOI] [PubMed] [Google Scholar]
- 22.Ma TY. Intestinal epithelial barrier dysfunction in Crohn's disease. Proc Soc Exp Biol Med. 1997;214:318–327. doi: 10.3181/00379727-214-44099. [DOI] [PubMed] [Google Scholar]
- 23.Sander GR, Cummins AG, Henshall T, et al. Rapid disruption of intestinal barrier function by gliadin involves altered expression of apical junctional proteins. FEBS Lett. 2005;579:4851–4855. doi: 10.1016/j.febslet.2005.07.066. [DOI] [PubMed] [Google Scholar]
- 24.Halme L, Paavola-Sakki P, Turunen U, et al. Family and twin studies in inflammatory bowel disease. World J Gastroenterol. 2006;12:3668–3672. doi: 10.3748/wjg.v12.i23.3668. [DOI] [PMC free article] [PubMed] [Google Scholar]
- 25.Katz KD, Hollander D, Vadheim CM, et al. Intestinal permeability in patients with Crohn's disease and their healthy relatives. Gastroenterology. 1989;97:927–931. doi: 10.1016/0016-5085(89)91499-6. [DOI] [PubMed] [Google Scholar]
- 26.Monsuur AJ, de Bakker PI, Alizadeh BZ, et al. Myosin IXB variant increases the risk of celiac disease and points toward a primary intestinal barrier defect. Nat Genet. 2005;37:1341–1344. doi: 10.1038/ng1680. [DOI] [PubMed] [Google Scholar]
- 27.van Bodegraven AA, Curley CR, Hunt KA, et al. Genetic variation in myosin IXB is associated with ulcerative colitis. Gastroenterology. 2006;131:1768–1774. doi: 10.1053/j.gastro.2006.09.011. [DOI] [PubMed] [Google Scholar]
- 28.Wapenaar MC, Monsuur A, van Bodegraven A, et al. Associations With Tight Junction Genes Pard3 And Magi2 In Dutch Patients Point To A Common Barrier Defect For Celiac Disease And Ulcerative Colitis. Gut. 2007 doi: 10.1136/gut.2007.133132. [DOI] [PubMed] [Google Scholar]
- 29.Satsangi J, Parkes M, Louis E, et al. Two stage genome-wide search in inflammatory bowel disease provides evidence for susceptibility loci on chromosomes 3, 7 and 12. Nat Genet. 1996;14:199–202. doi: 10.1038/ng1096-199. [DOI] [PubMed] [Google Scholar]
- 30.The International HapMap Project. Nature. 2003;426:789–796. doi: 10.1038/nature02168. [DOI] [PubMed] [Google Scholar]
- 31.Barrett JC, Fry B, Maller J, et al. Haploview: analysis and visualization of LD and haplotype maps. Bioinformatics. 2005;21:263–265. doi: 10.1093/bioinformatics/bth457. [DOI] [PubMed] [Google Scholar]
- 32.Frazer KA, Ballinger DG, Cox DR, et al. A second generation human haplotype map of over 3.1 million SNPs. Nature. 2007;449:851–861. doi: 10.1038/nature06258. [DOI] [PMC free article] [PubMed] [Google Scholar]
- 33.de Bakker P. 2004 [Google Scholar]
- 34.Sambrook J, Fritsch E, Maniatis T. Molecular Cloning. New York: Cold Spring Harbor Laboratory; 1989. [Google Scholar]
- 35.Shen R, Fan JB, Campbell D, et al. High-throughput SNP genotyping on universal bead arrays. Mutat Res. 2005;573:70–82. doi: 10.1016/j.mrfmmm.2004.07.022. [DOI] [PubMed] [Google Scholar]
- 36.Gabriel SB, Schaffner SF, Nguyen H, et al. The structure of haplotype blocks in the human genome. Science. 2002;296:2225–2229. doi: 10.1126/science.1069424. [DOI] [PubMed] [Google Scholar]
- 37.Purcell S, Neale B, Todd-Brown K, et al. PLINK: a tool set for whole-genome association and population-based linkage analyses. Am J Hum Genet. 2007;81:559–575. doi: 10.1086/519795. [DOI] [PMC free article] [PubMed] [Google Scholar]
- 38.Libioulle C, Louis E, Hansoul S, et al. Novel Crohn disease locus identified by genome-wide association maps to a gene desert on 5p13.1 and modulates expression of PTGER4. PLoS Genet. 2007;3:e58. doi: 10.1371/journal.pgen.0030058. [DOI] [PMC free article] [PubMed] [Google Scholar]
- 39.Dixon AL, Liang L, Moffatt MF, et al. A genome-wide association study of global gene expression. Nat Genet. 2007;39:1202–1207. doi: 10.1038/ng2109. [DOI] [PubMed] [Google Scholar]
- 40.Wu X, Hepner K, Castelino-Prabhu S, et al. Evidence for regulation of the PTEN tumor suppressor by a membrane-localized multi-PDZ domain containing scaffold protein MAGI-2. Proc Natl Acad Sci U S A. 2000;97:4233–4238. doi: 10.1073/pnas.97.8.4233. [DOI] [PMC free article] [PubMed] [Google Scholar]
- 41.Ober C, Tan Z, Sun Y, et al. Effect of variation in CHI3L1 on serum YKL-40 level, risk of asthma, and lung function. N Engl J Med. 2008;358:1682–1691. doi: 10.1056/NEJMoa0708801. [DOI] [PMC free article] [PubMed] [Google Scholar]
- 42.Ingham RJ, Colwill K, Howard C, et al. WW domains provide a platform for the assembly of multiprotein networks. Mol Cell Biol. 2005;25:7092–7106. doi: 10.1128/MCB.25.16.7092-7106.2005. [DOI] [PMC free article] [PubMed] [Google Scholar]
- 43.Hu Y, Li Z, Guo L, et al. MAGI-2 Inhibits cell migration and proliferation via PTEN in human hepatocarcinoma cells. Arch Biochem Biophys. 2007;467:1–9. doi: 10.1016/j.abb.2007.07.027. [DOI] [PubMed] [Google Scholar]
- 44.Valiente M, Andres-Pons A, Gomar B, et al. Binding of PTEN to specific PDZ domains contributes to PTEN protein stability and phosphorylation by microtubule-associated serine/threonine kinases. J Biol Chem. 2005;280:28936–28943. doi: 10.1074/jbc.M504761200. [DOI] [PubMed] [Google Scholar]
- 45.Ina K, Itoh J, Fukushima K, et al. Resistance of Crohn's disease T cells to multiple apoptotic signals is associated with a Bcl-2/Bax mucosal imbalance. J Immunol. 1999;163:1081–1090. [PubMed] [Google Scholar]
- 46.Dube C, Rostom A, Sy R, et al. The prevalence of celiac disease in average-risk and at-risk Western European populations: a systematic review. Gastroenterology. 2005;128:S57–S67. doi: 10.1053/j.gastro.2005.02.014. [DOI] [PubMed] [Google Scholar]
- 47.Bosi E, Molteni L, Radaelli MG, et al. Increased intestinal permeability precedes clinical onset of type 1 diabetes. Diabetologia. 2006;49:2824–2827. doi: 10.1007/s00125-006-0465-3. [DOI] [PubMed] [Google Scholar]