Abstract
We studied the robustness of photosynthetic metabolism in the chloroplasts of C3 plants under drought stress and at high CO2 concentration conditions by using a method called Minimization of Metabolic Adjustment Dynamic Flux Balance Analysis (M_DFBA). Photosynthetic metabolism in the chloroplasts of C3 plants applies highly cooperative regulation to minimize the fluctuation of metabolite concentration profiles in the face of transient perturbations. Our work suggests that highly cooperative regulation assures the robustness of the biological system and that there is closer cooperation under perturbation conditions than under normal conditions. This results in minimizing fluctuations in the profiles of metabolite concentrations, which is the key to maintaining a system's function. Our methods help in understanding such phenomena and the mechanisms of robustness for complex metabolic networks in dynamic processes.
Keywords: climate extremes, environmental stress, flux balance, metabolic control, metabolomics
Advances in metabolomics technologies provide adequate data to make it possible to simulate the cell's metabolic networks as coherent systems (1). Approaches to analyzing the properties of such systems, such as Metabolic Control Analysis (MCA) and Flux Balance Analysis (FBA), provide means to assess the robustness of metabolic systems in compensating for perturbations (2, 3). FBA and Minimization of Metabolic Adjustment (MOMA) have been applied to study the robustness of biochemical pathways in the steady state (4–7). FBA can give the optimal value of the state of a homeostatic system, which we assume is the one acquired through the evolutionary process. To improve on FBA, the MOMA method has been designed to analyze metabolic networks under perturbations based on the hypothesis that perturbed metabolic fluxes undergo a minimum redistribution. It has been found that in some aspects MOMA is closer than FBA in predicting the result of inserting a mutation into a metabolic network (5, 8, 9). Under perturbed conditions, metabolic networks reach a new state through dynamic adjustment. To investigate these dynamics, Dynamic Flux Balance Analysis (DFBA) has been developed on the basis of dynamic optimal control theory (10). DFBA can incorporate kinetic information and has been applied successfully to simulate the diauxic growth of Escherichia coli. We developed an approach called Minimization of Metabolic Adjustment Dynamic Flux Balance Analysis (M_DFBA), which is a DFBA method modified by extending the MOMA hypothesis (11). M_DFBA has been used to model myocardial energy metabolism. We found that under ischemic conditions, the myocardium does not maximize the rate of ATP production as it does under normal conditions, but rather minimizes the fluctuation of the profile of metabolite concentrations (12). Even without complete system parameters, these methods can find the optimal state of a system or process by searching for the optimal solution using stoichiometric information for the reactions concerned. An objective function of the system, reflecting inherent motivity and system function, for example, the maximum rate of ATP production in myocardial energy metabolism or the maximum biomass concentration by the metabolic network of E. coli, is the goal of cooperative regulation of a complex biological system.
As a general definition, robustness is a property that maintains system function in the face of various perturbations (13, 14). It is one of the inherent properties of biological systems. In particular, aspects of the mechanism and the origin of robustness have been investigated, for instance, the topology of networks such as the bow-tie structure of biological systems (15), feedback control (16), robustness tradeoffs such as Highly Optimized Tolerance (HOT) theory (17), duplication of pathways (18), and decoupling pathways (19). More recently, Kitano has suggested how to describe the robustness of biological systems quantitatively (20).
Here, we have applied the M_DFBA method to explore the robustness of photosynthetic metabolism in the chloroplasts of C3 plants. There is extensive work on mathematical modeling of the metabolism of chloroplasts under normal and perturbed conditions (21–23), illustrating the effects of perturbations, but that do not characterize the degree of resistance to perturbation. Our article examines the effects of key environmental modifications, water deficit and high-CO2 conditions, on photosynthetic metabolism. We analyze the robustness of the system, and from this we suggest a general rule about the robustness of metabolic systems.
Results and Discussion
Modeling of Photosynthetic Metabolism in the Chloroplasts of C3 Plants.
We have constructed a model of photosynthetic metabolism in the chloroplasts of C3 plants and examined it with two objective functions in mind by using different approaches under perturbation conditions: first, minimizing the fluctuations of the profile of metabolite concentrations by using the M_DFBA method; and second, maximizing the rate of 3-phosphoglycerate (PGA) production by using the DFBA method. Because PGA is a major building block used to synthesize sugars, starch, and other important plant materials, the key function of chloroplasts is to produce PGA. To describe chloroplast dynamics completely, our model includes not only photosynthetic metabolism but also the expression of Rubisco (ribulose-1,5-biphosphate carboxylase/oxygenase), as measured by the expression of rbcL, which is a large subunit of Rubisco. Rubisco is the key enzyme in both the photosynthesis and photorespiration, and its concentration decreases with increasing concentrations of CO2 (24).
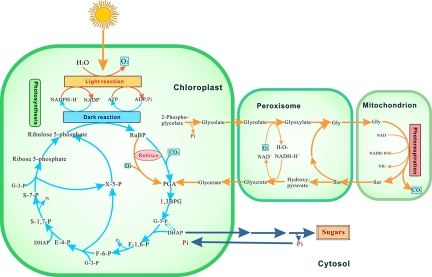
Our model considers photosynthetic metabolism under normal conditions as shown in Fig. 1. Photosynthesis is composed of the light reaction and the dark reaction in the chloroplasts. In the light reaction, light energy is absorbed and then conserved in ATP and NADPH, and simultaneously O2 is evolved. The dark reaction involves three stages: Stage 1, fixation of CO2 into PGA, catalyzed by Rubisco, a key enzyme in the dark reaction; Stage 2, reduction in two steps of PGA to glyceraldehyde 3-phosphate and dihydroxyacetone phosphate, which is used to synthesize starch or sugar; Stage 3, regeneration of ribulose 1,5-bisphosphate (RuBP) from glyceraldehyde 3-phosphate, which consumes energy (ATP and NADPH) provided by the light reaction. This involves a series of transformations of glyceraldehyde 3-phosphate to regenerate RuBP for continued CO2 fixation. Photorespiration is a costly side reaction of photosynthesis in the plant, also producing PGA. It involves three cellular compartments: chloroplasts, peroxisomes, and mitochondria, consuming O2 to produce CO2 catalyzed by Rubisco. However, the rate of photorespiration is less than the rate of the photosynthesis, so that photorespiration is a slower way to produce PGA. It also consumes more energy, so another function of photorespiration is to protect the plant against oxidative damage by consuming redundant energy.
Fig. 1.
Photosynthetic metabolism in the chloroplasts of C3 plants. 1,3BPG, bisphosphoglycerate; G-3-P, glyceraldehyde 3-phosphate; DHAP, dihydroxyacetone phosphate; F-1,6-P, fructose 1,6-bisphosphate; F-6-P, fructose 6-phosphate; X-5-P, xylose 5-phosphate; E-4-P, erythrose 4-phosphate; S-1,7-P, sedoheptulose 1,7-bisphosphate; S-7-P, sedoheptulose 7-phosphate.
The photosynthetic network consists of at least 24 reactions and 34 metabolites. All metabolites and reactions need to be parameterized on each collocation point to make calculations with the M_DFBA method, and consequently a very large amount of variables is produced. In practice, without simplifying the network, it is impossible to obtain an optimal solution.
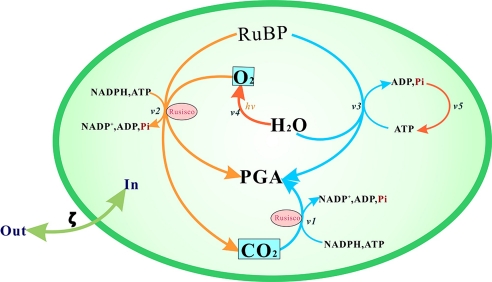
We have made two assumptions for simplifying the network: (i) the function of the chloroplasts in C3 plants is to produce PGA at a maximum rate under normal conditions; (ii) the system maintains its function under perturbed conditions, according to the general definition of robustness. We simplify the network by including only the following components: (i) dark reactions producing PGA efficiently; (ii) photorespiration, as an additional pathway to produce PGA, even though it consumes more energy at a lower speed; (iii) the pathway of regeneration of RuBP because it is the crucial path to CO2 fixation in the whole network; and (iv) the light reaction producing NADPH for reduction and ATP as the energy supplier. Finally, we obtained a simplified photosynthetic model including five pathways involving eight crucial metabolites, presented in Fig. 2. V1 (the dark reaction) is the main reaction producing PGA and Pi catalyzed by Rubisco under normal conditions; V2 (photorespiration) is a side pathway to V1 producing PGA and produces CO2; V3 (RuBP regeneration) continuously synthesizes RuBP; V4 (the light reaction) absorbs light to produce reducing power (NADPH); and V5 (ATP synthesis) produces energy (ATP) through Pi.
Fig. 2.
Simplified photosynthetic metabolism in the chloroplasts of C3 plants considered for M_DFBA. This consisted of 8 metabolites (Rubisco, RuBP, PGA, ATP, ADP, Pi, NADP, and NADPH) and 5 reactions (V1, dark reaction; V2, photorespiration; V3, RuBP regeneration; V4, light reaction; V5:, ATP synthesis). Through pathway analysis the main output of this network is defined as PGA, thus the simplified input consists of Pi, CO2, and O2.
Our model of photosynthetic metabolism in C3 plants uses a Dynamic Optimization Approach (DOA), which is one kind of formulation within the DFBA and M_DFBA methods. As mentioned above, maximum PGA production is assumed to be the function of the C3 photosynthesis network under normal conditions. However, under water stress and high CO2 concentrations, we work on the assumption that the goal is minimization of the fluctuation of the profile of metabolite concentrations, according to the M_DFBA hypothesis. To describe the robustness in the chloroplasts, a constraint on the rate of PGA synthesis is required under perturbation conditions, which is the formulation of a PGA synthesis velocity constraint. The solution to the dynamic optimization problem is described in Materials and Methods, and a simple example of how this algorithm works is provided in the supporting information of our previous work (11).
We analyzed the dynamic process of photosynthetic metabolism under water stress and high CO2 conditions over 10 h by using the M_DFBA model. Other factors (illumination, temperature, etc.) affecting photosynthesis are assumed normal and always constant in our model. Under drought, which reduces photosynthesis, at least two phenomena occur almost simultaneously: stomatal closure and reduced entry of CO2 to the leaf. High concentrations of CO2 would tend to increase photosynthesis and the production of PGA. Under both perturbations, we found that the predicted values obtained from the M_DFBA model are closer to the experimental data than those of DFBA model [see supporting information (SI) Figs. S1–S4 for further details]. In our previous work, we found the same difference between the two approaches: the M_DFBA model correctly described the phenomenon of the predominant contribution of fatty acids to oxidative ATP production under mild and moderate ischemic conditions, but the DFBA model failed to do so (11).
Performance of the Model Under Water Deficit.
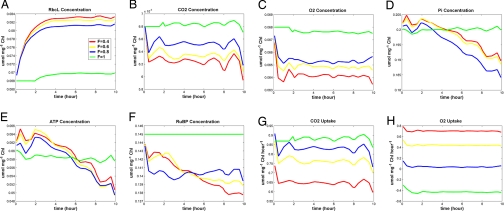
Because the parameters of our model come from different C3 plants, we have used the transition trend of the curves in the present work. Fig. 3 shows metabolic response under water stress, where F represents the relative water content. At different levels of relative water content, the simulation conditions are defined as normal water condition (F = 1, green line) and water stress condition (F <1), including mild (F = 0.8, blue line), moderate (F = 0.6, yellow line), and severe (F = 0.4, red line), respectively. At the beginning of the water stress condition lasting 2 h, the concentration of CO2 decreases (Fig. 3B) and leads to an increase in the concentration of Rubisco (Fig. 3A). Simultaneously, the concentration of O2 decreases (Fig. 3C), and the uptake of O2 reverses from evolution to absorption when the water stress becomes severe (Fig. 3H). After the reduction of CO2 concentration, the concentration of CO2 increases and becomes steady after 2 h. The concentration of other substrates such as ATP and Pi decreases sharply (Fig. 3 D and E). Our results are consistent with previous publications (25).
Fig. 3.
Modeling results of photosynthetic metabolism in the chloroplasts of C3 plants by the M_DFBA method under different levels of water stress. F represents water stress: normal (1), mild (0.8), moderate (0. 6), and severe (0.4). (A) rbcL concentration, which represents the Rubisco concentration, increases during the decreased water content. (B–F) CO2, O2, Pi, ATP, and RuBP concentration are reduced under the water stress. (G) Uptake of CO2 drops because of stomatal closure under water deficiency. (H) Uptake of O2 is raised under severe water deficiency because of the enhanced photorespiration.
Based on the MOMA hypothesis and the above results, we can achieve a systemic analysis of cooperation between the different pathways of photosynthetic metabolism. Water deficit induces stomatal closure, causing a low concentration of CO2 within chloroplasts. This reduction of CO2 concentration raises the concentration of Rubisco and limits the rate of PGA synthesis, which is itself associated with RuBP regeneration and Pi concentration. To increase the CO2 concentration, the plant enhances photorespiration, which consumes O2 to produce CO2 (see Figs. S5 and S6 for details); moreover, photorespiration could rescue the low concentration of PGA and Pi. Yet, this reaction consumes more ATP so that the plant is under low-energy conditions (ATP scarcity). To some extent, the increased CO2 concentration could stimulate photosynthesis, which produces PGA more efficiently than photorespiration. Although the plants use photorespiration to offset low metabolite concentrations rather than photosynthesis during drought conditions, we deduce that a high concentration of Rubisco accelerates the speed of both photosynthesis and photorespiration as soon as possible to minimize fluctuation of the profile of metabolite concentrations so that the plant exerts itself to optimize function under water deficit. Therefore, the plant could stabilize its state by regulating the concentration of Rubisco to realize its function to produce PGA as much as possible.
Performance of the Model at High CO2 Concentrations.
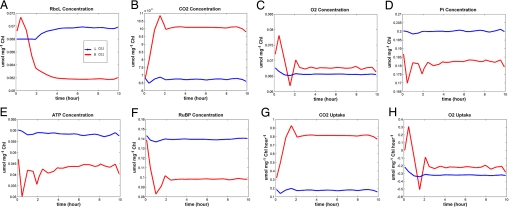
Fig. 4 shows the metabolic response under normal and high CO2 conditions. The concentrations of Pi, CO2 and O2 in the tissue fluid are constant throughout the simulation. At double-ambient CO2, the Rubisco concentration (Fig. 4A) drops, and the concentrations of Pi ATP and RuBP (Fig. 4 D–F) and the uptake of O2 (Fig. 4H) decrease; yet, the concentrations of CO2 and O2 (Fig. 4 B and C) increase. Our results were consistent with previous publications (26).
Fig. 4.
Modeling results of photosynthetic metabolism in the chloroplasts of C3 plants by the M_DFBA method under normal and double concentrations of CO2. (A) rbcL concentration is reduced at double CO2 concentration. (B and G) Concentration and uptake of CO2 increase. (C and H) Concentration and uptake of O2 decrease. (D) Concentration of Pi drops. (E and F) ATP and RuBP are consumed to synthesize PGA.
High CO2 levels stimulate the dark reaction, and RuBP and ATP are consumed more quickly to fix CO2 to PGA than under normal conditions. The decreased ATP concentration boosts ATP synthesis that in turn reduces Pi concentration. The light reaction in photosynthesis is also enhanced to cooperate with the faster dark reaction to provide enough energy, yet the concentration of O2, a side product of the light reaction, also rises. Therefore, the high concentration of O2 speeds up photorespiration. However, a high CO2 concentration resulted in the reduction of Rubisco concentration, and both photosynthesis and photorespiration decelerate to maintain the substrate concentrations. By limiting the Rubisco concentration, the plants control the speed of pathways to optimize stability to produce as much PGA as possible under high CO2 concentration. Even though the favorable condition is advantageous for the C3 plant to produce PGA, it consumes a large amount of substrate that destroys the system balance. The plants have developed a strategy to limit the reaction rate in the long evolutionary process by reducing the concentration of Rubisco, as mentioned above, whose concentration is affected by high CO2 concentration. Through limiting Rubisco, the plant can regulate the rate of photosynthesis, assuring that there are only slight fluctuations in the substrate concentration profiles, to stabilize the plant.
Cooperation Analysis.
All biological processes involve cooperation with correlated pathways, and this is one of the reasons for high system complexity (27). Through cooperation, biological systems cannot only realize their function, but also stabilize their state. Previous studies have focused on the cooperation of biological systems, for example: Vo et al. (28) used FBA to analyze results of the model with various objective functions and found that pathways of human mitochondria carry out the system's function through cooperation; Motoaki and coworkers (29) applied a full-length cDNA-monitoring microarray and analyzed the expression profiles of 7,000 Arabidopsis genes under conditions of drought, cold, and high-salinity stress and found that there are cooperations between different signaling cascades.
To describe quantitatively the cooperation of photosynthetic metabolism in the chloroplasts of the C3 plants, we calculated the correlation between the velocities of five pathways in our simplified network. To further prove the effect of cooperation of the system, we compared the result by using another objective function that minimizes the fluctuation of the profile of the fluxes with the one by minimizing the fluctuation of the profile of metabolite concentrations.
According to DOA, the velocity of each pathway has been parameterized on each collocation point on the whole process (see Figs. S5 and S6 for details). We calculated the correlation of time series data of velocity of each pair of pathways by mutual information under the severe water deficit condition (F = 0.4) and under normal water condition (F = 1). For each result we obtained a P value (result not shown), which is associated with a given value of mutual information in the null hypothesis by Monte Carlo simulation (the calculation method is shown in Materials and Methods). The results shown in Table 1 display that each pair of pathways has high cooperation under normal and severe water conditions. Moreover, under perturbation conditions, it shows higher cooperation than that of under normal water condition. The above results suggest that the system applies closer cooperation under perturbation conditions than under normal conditions.
Table 1.
Correlation of time series data of velocity of each pair of pathways by mutual information under severe water deficit conditions (F = 0.4, lower left) and normal water conditions (F = 1, upper right)
| Velocity | V1 | V2 | V3 | V4 | V5 |
|---|---|---|---|---|---|
| V1 | 0.3485 | 0.5548 | 0.5563 | 0.5731 | |
| V2 | 0.6070 | 0.4806 | 0.4970 | 0.4459 | |
| V3 | 0.7598 | 0.8473 | 0.8615 | 0.9116 | |
| V4 | 0.7626 | 0.8340 | 0.9213 | 0.8585 | |
| V5 | 0.7598 | 0.8473 | 0.9322 | 0.9213 |
The velocities of five pathways are: V1, dark reaction; V2, photorespiration; V3, RuBP regeneration; V4, light reaction; and V5, ATP synthesis. See Results and Discussion for details.
Rubisco utilizes both CO2 and O2 as substrates to form PGA in the chloroplasts. Under drought conditions, or low CO2 concentrations, O2 competes with CO2 at the active site of Rubisco. Table 1 shows relatively low correlations between V1 (dark reaction in the photosynthesis) and V2 (photorespiration) because CO2 fixation in the dark reaction is inhibited by the O2 in the process of photorespiration. Both the dark reaction and photorespiration depend on RuBP regeneration (V3) to continuously produce RuBP to form PGA, so V3 showed high correlation with the light reaction (V4) and ATP synthesis (V5) under normal and stress condition. The correlation of V2 with V3, V4, and V5 under perturbation conditions is lower than the correlation of V1 with V3, V4, and V5 under normal conditions because the dark reaction plays a key role in the plant, whereas photorespiration is a side pathway or a rescue pathway. However, compared with normal conditions, the correlation of V2 with V3, V4, and V5 under water stress conditions (F = 0.4) is relatively higher (Table 1). This is because under stress conditions, photorespiration is enhanced to respond to the stress.
To understand the importance of cooperative regulation in the biological system under perturbed conditions, we stimulated the system's state without the cooperative regulation. We changed the objective function to minimize the fluctuation of the profile of flux velocities. The results of this objective function (see Figs. S7–S10 for details) show that to stabilize the system's profile of flux one part of the metabolite concentrations are raised sharply, whereas the other part of the metabolite concentrations drop sharply. System function is impaired because of the unreasonable distribution of metabolite concentrations. Moreover, it is harmful for the system because the high concentration of some metabolites may damage its survival. Therefore, it is uneconomic to achieve system function, and the result does not accord with experimental evidence. Our stimulation shows that a system's function is realized through cooperative regulation, which can also decrease the fluctuation of metabolite concentration profiles.
Conclusion
In the present work, we have built a mathematical model of photosynthetic metabolism in the chloroplasts of C3 plants by using the M_DFBA method. We have analyzed the dynamic reprogramming, robustness, and cooperativity of the chloroplast's network under drought stress and under high CO2 concentration conditions. Based on the results of this study and our previous works, we showed that in the face of transient perturbation, metabolic systems are inclined to maintain their state by cooperative regulation to achieve their function.
Under disturbed conditions, the homeostasis of metabolite concentrations is destroyed. In the view of the fluctuation–dissipation theory, a system's state will fluctuate in response to the changes in the surroundings (30). The fluctuation induces the departure of some of the system's elements from its statistical average, which impairs the cooperativity of the whole system and causes decreased system function. As a highly cooperative system, metabolic networks use a system cooperative regulation to achieve their function. The system cooperatively regulates the velocity of pathways to minimize fluctuations in the profiles of metabolite concentrations.
Materials and Methods
Model of the Photosynthetic Metabolism in the Chloroplasts of C3 Plants.
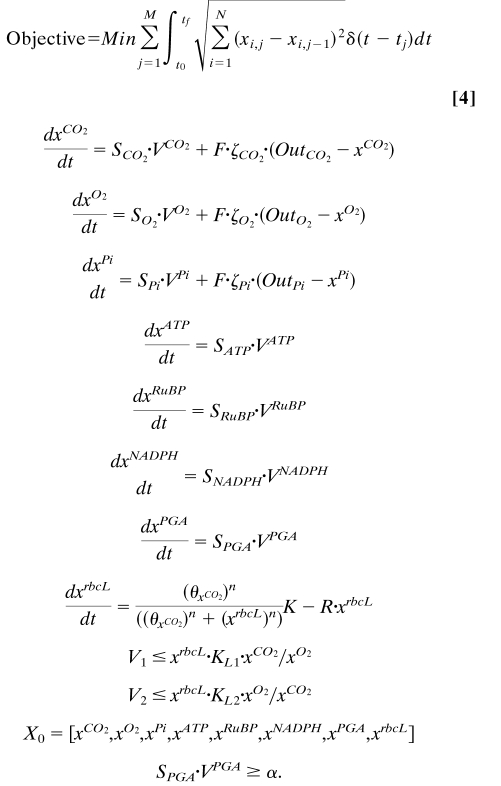
As chloroplasts continuously exchange metabolic substances with cytoplasm, such as Pi, O2, and CO2, we used the following ordinary differential equation (ODE) to describe the rate of change of metabolites concentration:
where x is a vector of metabolite concentration, t is the time, S is the stoichiometric matrix, V is a vector comprising the values of all reactions and transport fluxes, F is water flow into cytoplasm, Outx is the concentration of a particular metabolite in the cytoplasm, ζx is the diffusion coefficient, Inx is the metabolite concentration in chloroplasts, and F · ζx · (Outx − Inx) is the flux of a particular metabolite from cytoplasm flow to chloroplasts. Rubisco is the most ubiquitous protein in the nature; in each chloroplast it has a large copy number (31). So, we need not consider randomicity in rbcL expression (32, 33). We used the following deterministic ODE to describe the rate of change of rbcL protein:
where K is the rate of rbcL expression, and R is the rate of degradation of rbcL protein.
rbcL is the larger unit of Rubisco, catalyzing the photosynthesis and photorespiration. So we use rbcL content, which could nearly represent the Rubisco concentration, and its dynamic parameter to constrain the velocity of photosynthesis and photorespiration. In addition, because the normal optimal objective function of PGA production is replaced under perturbed conditions by minimizing metabolite concentration fluctuation, a new constraint is required for the purpose of describing the unaltered requirement of function of system in the chloroplasts. We made a qualitative estimate of the lower limit constraint of PGA synthesis velocity to express this function, where α represents the normal velocity of PGA production. Finally, successional constraint of all metabolite concentrations was necessary at the beginning of each finite element and initial state (the values of the parameters used in Eq. 4 are listed in Table S1.
 |
Mutual Information.
In probability theory and information theory, the mutual information of two random variables is a quantity that measures the mutual dependence of two variables. In this work, we used mutual information to describe quantitatively the cooperation of the system.
Based on the rank transformation of the series data of velocity of each pathway, the correlation of the velocity of each pair of pathways is calculated by the following equation:
 |
where Nm is the number of samples, p(x, y) is the joint probability distribution function of X and Y, and p1(x) and p2(y) are the marginal probability distribution functions of X and Y, respectively (34).
Supplementary Material
Acknowledgments.
This work was supported by National High-Tech Research and Development Program of China Grant 2006AA02Z302, National Natural Science Foundation of China Grants 30700164, 30830071 and 30570109, Major State Basic Research Development Program Grants 2003CB715904 and 2006CB910700), Shanghai Leading Academic Discipline Project B111, Shanghai Science and Technology Committee Grant 07XD14025, National Infrastructure of Natural Resources for Science and Technology (2005DKA21403), Shanghai Committee of Science and Technology (07JC14049), and Chinese Academy of Sciences Grants 2007KIP406 and KSCX2-YW-R-112.
Footnotes
The authors declare no conflict of interest.
This article contains supporting information online at www.pnas.org/cgi/content/full/0810731105/DCSupplemental.
References
- 1.Palsson B. The challenges of in silico biology. Nat Biotechnol. 2000;18:1147–1150. doi: 10.1038/81125. [DOI] [PubMed] [Google Scholar]
- 2.Schilling CH, Schuster S, Palsson BO, Heinrich R. Metabolic pathway analysis: Basic concepts and scientific applications in the post-genomic era. Biotechnol Prog. 1999;15:296–303. doi: 10.1021/bp990048k. [DOI] [PubMed] [Google Scholar]
- 3.Varma A, Palsson BO. Stoichiometric flux balance models quantitatively predict growth and metabolic by-product secretion in wild-type Escherichia coli W3110. Appl Environ Microbiol. 1994;60:3724–3731. doi: 10.1128/aem.60.10.3724-3731.1994. [DOI] [PMC free article] [PubMed] [Google Scholar]
- 4.Edwards JS, Palsson BO. Robustness analysis of the Escherichia coli metabolic network. Biotechnol Prog. 2000;16:927–939. doi: 10.1021/bp0000712. [DOI] [PubMed] [Google Scholar]
- 5.Segre D, Vitkup D, Church GM. Analysis of optimality in natural and perturbed metabolic networks. Proc Natl Acad Sci USA. 2002;99:15112–15117. doi: 10.1073/pnas.232349399. [DOI] [PMC free article] [PubMed] [Google Scholar]
- 6.Edwards JS, Palsson BO. The Escherichia coli MG1655 in silico metabolic genotype: Its definition, characteristics, and capabilities. Proc Natl Acad Sci USA. 2000;97:5528–5533. doi: 10.1073/pnas.97.10.5528. [DOI] [PMC free article] [PubMed] [Google Scholar]
- 7.Deutscher D, Meilijson I, Kupiec M, Ruppin E. Multiple knockout analysis of genetic robustness in the yeast metabolic network. Nat Genet. 2006;38:993–998. doi: 10.1038/ng1856. [DOI] [PubMed] [Google Scholar]
- 8.Kauffman KJ, Prakash P, Edwards JS. Advances in flux balance analysis. Curr Opin Biotechnol. 2003;14:491–496. doi: 10.1016/j.copbio.2003.08.001. [DOI] [PubMed] [Google Scholar]
- 9.Stephanopoulos G, Alper H, Moxley J. Exploiting biological complexity for strain improvement through systems biology. Nat Biotechnol. 2004;22:1261–1267. doi: 10.1038/nbt1016. [DOI] [PubMed] [Google Scholar]
- 10.Mahadevan R, Edwards JS, Doyle FJ., III Dynamic flux balance analysis of diauxic growth in Escherichia coli. Biophys J. 2002;83:1331–1340. doi: 10.1016/S0006-3495(02)73903-9. [DOI] [PMC free article] [PubMed] [Google Scholar]
- 11.Luo RY, et al. Dynamic analysis of optimality in myocardial energy metabolism under normal and ischemic conditions. Mol Syst Biol. 2006;2:2006.0031. doi: 10.1038/msb4100071. [DOI] [PMC free article] [PubMed] [Google Scholar]
- 12.Raamsdonk LM, et al. A functional genomics strategy that uses metabolome data to reveal the phenotype of silent mutations. Nat Biotechnol. 2001;19:45–50. doi: 10.1038/83496. [DOI] [PubMed] [Google Scholar]
- 13.Stelling J, Sauer U, Szallasi Z, Doyle FJ, III, Doyle J. Robustness of cellular functions. Cell. 2004;118:675–685. doi: 10.1016/j.cell.2004.09.008. [DOI] [PubMed] [Google Scholar]
- 14.Kitano H. Biological robustness. Nat Rev Genet. 2004;5:826–837. doi: 10.1038/nrg1471. [DOI] [PubMed] [Google Scholar]
- 15.Csete M, Doyle J. Bow ties, metabolism, and disease. Trends Biotechnol. 2004;22:446–450. doi: 10.1016/j.tibtech.2004.07.007. [DOI] [PubMed] [Google Scholar]
- 16.Hasty J, McMillen D, Collins JJ. Engineered gene circuits. Nature. 2002;420:224–230. doi: 10.1038/nature01257. [DOI] [PubMed] [Google Scholar]
- 17.Carlson JM, Doyle J. Highly optimized tolerance: A mechanism for power laws in designed systems. Phys Rev E Stat Phys Plasmas Fluids Relat Interdiscip Top. 1999;60:1412–1427. doi: 10.1103/physreve.60.1412. [DOI] [PubMed] [Google Scholar]
- 18.Hartwell LH, Hopfield JJ, Leibler S, Murray AW. From molecular to modular cell biology. Nature. 1999;402:C47–C52. doi: 10.1038/35011540. [DOI] [PubMed] [Google Scholar]
- 19.Hartman JLT, Garvik B, Hartwell L. Cell biology: Principles for the buffering of genetic variation. Science. 2001;291:1001–1004. doi: 10.1126/science.291.5506.1001. [DOI] [PubMed] [Google Scholar]
- 20.Kitano H. Towards a theory of biological robustness. Mol Syst Biol. 2007;3:137. doi: 10.1038/msb4100179. [DOI] [PMC free article] [PubMed] [Google Scholar]
- 21.Pettersson G, Ryde-Pettersson U. A mathematical model of the Calvin photosynthesis cycle. Eur J Biochem. 1988;175:661–672. doi: 10.1111/j.1432-1033.1988.tb14242.x. [DOI] [PubMed] [Google Scholar]
- 22.Laisk A, Eichelmann H, Oja V. C3 photosynthesis in silico. Photosynth Res. 2006;90:45–66. doi: 10.1007/s11120-006-9109-1. [DOI] [PubMed] [Google Scholar]
- 23.Wingler A, Lea PJ, Quick WP, Leegood RC. Photorespiration: Metabolic pathways and their role in stress protection. Philos Trans R Soc London Ser B. 2000;355:1517–1529. doi: 10.1098/rstb.2000.0712. [DOI] [PMC free article] [PubMed] [Google Scholar]
- 24.Cheng SH, Moore B, Seemann JR. Effects of short- and long-term elevated CO2 on the expression of ribulose-1,5-bisphosphate carboxylase/oxygenase genes and carbohydrate accumulation in leaves of Arabidopsis thaliana (L) Heynh. Plant Physiol. 1998;116:715–723. doi: 10.1104/pp.116.2.715. [DOI] [PMC free article] [PubMed] [Google Scholar]
- 25.Tezara W, Mitchell V, Driscoll SP, Lawlor DW. Effects of water deficit and its interaction with CO2 supply on the biochemistry and physiology of photosynthesis in sunflower. J Exp Bot. 2002;53:1781–1791. doi: 10.1093/jxb/erf021. [DOI] [PubMed] [Google Scholar]
- 26.Spencer W, Bowes G. Photosynthesis and growth of water hyacinth under CO2 enrichment. Plant Physiol. 1986;82:528–533. doi: 10.1104/pp.82.2.528. [DOI] [PMC free article] [PubMed] [Google Scholar]
- 27.Shimizu H, Haken H. Cooperative dynamics in organelles. J Theor Biol. 1983;104:261–273. doi: 10.1016/0022-5193(83)90414-9. [DOI] [PubMed] [Google Scholar]
- 28.Vo TD, Greenberg HJ, Palsson BO. Reconstruction and functional characterization of the human mitochondrial metabolic network based on proteomic and biochemical data. J Biol Chem. 2004;279:39532–39540. doi: 10.1074/jbc.M403782200. [DOI] [PubMed] [Google Scholar]
- 29.Seki M, et al. Monitoring the expression profiles of 7000 Arabidopsis genes under drought, cold and high-salinity stresses using a full-length cDNA microarray. Plant J. 2002;31:279–292. doi: 10.1046/j.1365-313x.2002.01359.x. [DOI] [PubMed] [Google Scholar]
- 30.Prigogine I, Nicolis G, Babloyantz A. Nonequilibrium problems in biological phenomena. Ann NY Acad Sci. 1974;231:99–105. doi: 10.1111/j.1749-6632.1974.tb20557.x. [DOI] [PubMed] [Google Scholar]
- 31.Tcherkez GGB, Farquhar GD, Andrews TJ. Despite slow catalysis and confused substrate specificity, all ribulose bisphosphate carboxylases may be nearly perfectly optimized. Proc Natl Acad Sci USA. 2006;103:7246–7251. doi: 10.1073/pnas.0600605103. [DOI] [PMC free article] [PubMed] [Google Scholar]
- 32.Kaern M, Elston TC, Blake WJ, Collins JJ. Stochasticity in gene expression: From theories to phenotypes. Nat Rev Genet. 2005;6:451–464. doi: 10.1038/nrg1615. [DOI] [PubMed] [Google Scholar]
- 33.Kaufmann BB, van Oudenaarden A. Stochastic gene expression: From single molecules to the proteome. Curr Opin Genet Dev. 2007;17:107–112. doi: 10.1016/j.gde.2007.02.007. [DOI] [PubMed] [Google Scholar]
- 34.Basso K, et al. Reverse engineering of regulatory networks in human B cells. Nat Genet. 2005;37:382–390. doi: 10.1038/ng1532. [DOI] [PubMed] [Google Scholar]
Associated Data
This section collects any data citations, data availability statements, or supplementary materials included in this article.


