Abstract
Metachromatic leukodystrophy is a lysosomal sphingolipid storage disorder caused by the deficiency of arylsulfatase A. The disease is characterized by progressive demyelination, causing various neurologic symptoms. Since no naturally occurring animal model of the disease is available, we have generated arylsulfatase A-deficient mice. Deficient animals store the sphingolipid cerebroside-3-sulfate in various neuronal and nonneuronal tissues. The storage pattern is comparable to that of affected humans, but gross defects of white matter were not observed up to the age of 2 years. A reduction of axonal cross-sectional area and an astrogliosis were observed in 1-year-old mice; activation of microglia started at 1 year and was generalized at 2 years. Purkinje cell dendrites show an altered morphology. In the acoustic ganglion numbers of neurons and myelinated fibers are severely decreased, which is accompanied by a loss of brainstem auditory-evoked potentials. Neurologic examination reveals significant impairment of neuromotor coordination.
Keywords: sulfatide, lysosomal storage disorders
Metachromatic leukodystrophy (MLD), an autosomal recessively inherited lysosomal storage disease with an estimated frequency of 1 in 40,000 newborns, is due to the deficiency of arylsulfatase A (ASA). The substrate of the enzyme is the sphingolipid cerebroside-3-sulfate (sulfatide), which is a major lipid component of myelin. Deficiency of the enzyme leads to the storage of sulfatide in a number of organs. Whereas the function of peripheral organs is not impaired, the central nervous system exhibits a progressive demyelination. At the age of about 18 months, patients affected with late infantile MLD present with ataxia and gait disturbance and later develop loss of speech, epileptic seizures, and a spastic quadriplegia. Symptoms are progressive and children die in a decerebrated state (1).
Patients store sulfatide in metachromatic granules in oligodendrocytes, astrocytes, certain types of neurons, and in numerous peripheral organs like kidney, gall bladder, and liver (1, 2). Macroscopically, a reduced volume of white matter and in severe cases a spongiform or cystic degeneration are noted. Microscopically a loss of myelin sheaths, a reduction in the number of oligodendrocytes, and accumulation of metachromatic granules are observed. Pathologic descriptions of human tissues are almost exclusively derived from postmortem examinations of the final disease stages. The early pathologic changes and the course of development of pathology are unknown.
More than 30 defects in the gene causing MLD have been characterized (3). Homozygosity for alleles that do not allow the synthesis of any functional enzyme always causes the most severe late infantile form of MLD. Alleles in which the mutations cause an incomplete loss of enzyme function are found in the juvenile and adult forms of the disease (4, 5).
The lack of a naturally occurring animal model of MLD has hampered studies on the molecular pathogenesis. The link between lipid storage and demyelination on the molecular level is unknown. Since an animal model would facilitate studies on the pathogenesis and therapy of the disease, we generated ASA-deficient mice.
MATERIALS AND METHODS
Construction of the Targeting Replacement Vector.
We have recently described (6) the isolation of two overlapping λ phage clones encompassing the entire murine ASA gene and 10 kb and 8 kb of 5′ and 3′ flanking sequences, respectively. This clone was isolated from a library of 129/SvJ mice genomic DNA (6). A 13-kb SalI–HindIII fragment excised from λ clone 1 was cloned into Bluescript SK−. This fragment encompasses 11 kb of 5′ flanking sequences and 2 kb of sequence of the ASA gene containing exons 1 to 4. This plasmid was linearized with HindIII and blunted with the Klenow fragment of DNA polymerase I. This HindIII site is located in the coding sequence of exon 4. A blunted neo cassette excised from the plasmid pMCneoPoly(A) (Stratagene) was inserted into the blunted HindIII site. In the course of this blunt end ligation a unique HindIII site was regenerated at the 3′ end of the neo cassette. Subsequently, a 5-kb KpnI flanked fragment was removed from the 5′ end, the KpnI site of the vector was blunted and a blunted herpes simplex virus thymidine kinase gene (tk) was inserted. This plasmid was linearized at the HindIII site at the 3′ end of the neo cassette and a 4-kb HindIII fragment of the murine ASA gene containing exons 4 to 8 and about 2 kb of 3′ flanking sequences was inserted. The vector was linearized at a NotI restriction site close to the 5′ end of the tk cassette. Fig. 1 shows the structure of the replacement vector.
Figure 1.
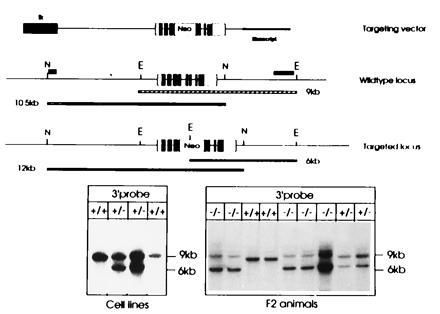
Structure of the targeting vector and the targeted ASA locus. The structure of the linearized replacement vector is shown on top. The ASA gene is indicated by boxes, open parts are 5′ or 3′ untranslated regions, and solid parts depict coding sequences. The tk gene at the 5′ end is shown as a hatched box; the Bluescript plasmid vector is indicated by a bold line. The wild-type locus is shown below, N and E indicate NsiI and EcoRI sites, respectively. The position of external probes used to detect the targeted locus is shown at the 5′ and 3′ end. Size of the fragments (9 and 10.5 kb) hybridizing to these probes is indicated by the bars below. The third schematic drawing depicts the homologously recombined locus and the altered size of the DNA fragments detected by the 5′ and 3′ probe. Southern Blot analysis of DNA isolated from ES cells (Left) and tail tips of F2 animals (Right) are shown at the bottom. EcoRI-digested DNA was hybridized to the 3′ external probe. The size of fragments is indicated on the right. Genotypes are shown on top. This analysis was frequently complicated by the presence of an additional fragment slightly larger than the 9-kb fragment indicative of the wild-type locus. This fragment is most likely due to partial digestion as can be concluded from the varying intensities of this fragment in comparison to the 6-kb fragment in the homozygous −/− mice. Blots of NsiI-digested DNA hybridized with the 5′ probe are not shown.
Selection and Identification of Embryonic Stem (ES) Cells With Targeted Disruption of the ASA Gene.
The targetting vector was linearized with NotI and introduced into the ES cell line E14-1 (7). Electroporation, culture, and selection conditions have been described (7, 8). Colonies selected with G418 and gancyclovir were screened by Southern blot analysis of DNA digested with EcoRI and hybridization with the external 3′ probe (Fig. 1). Homologous recombination was confirmed with a NsiI digestion and hybridization with the 5′ probe. Among 89 colonies examined, two targeted clones were identified and injected into blastocysts of C57BL/6J mice as described (8). Chimeric male mice were bred with C57BL/6J females and the offspring was analyzed by Southern blot analysis of tail DNA for the presence of the homologously recombined ASA gene. ASA(+/−) mice were mated to obtain mice homozygous for the disrupted ASA gene.
Cell Culture of Murine Tail Fibroblasts and Oligodendrocytes.
A 0.5-cm-long tip of tails was cut into small pieces and incubated for 1 h at 37°C in 2 ml phosphate-buffered saline/0.2% collagenase III and 24 ml of dispase (2 units/ml). Samples were centrifuged at 1000 × g for 5 min, and the pellet was resuspended in 1 ml of DMEM/10% fetal calf serum. Cells were plated on a 28-cm2 culture dish and grown to confluency. Oligodendrocytes were isolated from 15-day embryos as described (9).
Sulfatide Loading.
Sulfatide loading assays were performed on cultured tail fibroblasts and oligodendrocytes as described (10). Fluorescently labeled sulfatide was kindly provided by S. Marchesini, Department of Biomedical Sciences, University of Brescia, Brescia, Italy.
Southern and Northern Blot Analyses.
Genomic DNA from embryonic stem cells or DNA prepared from tail tips of mice was digested with EcoRI or NsiI, subjected to agarose gel electrophoresis, and blotted as described (11). For Northern blot analysis, RNA was isolated from cultured tail fibroblast of mice using the guanidinium isothiocyanate lysis and subsequent centrifugation through a cesium chloride cushion. Hybridization conditions for Southern and Northern blots were identical and have been described (11).
Assessment of Neuromotor Capabilities.
General motor activity. In general, neurologic examination of mice was done with animals 12–14 months of age. Motor activity was measured with a technique modified from Crawley and Goodwin (12). Mice were placed in an empty cage (16 × 22 cm) for 40 min. Three infrared sensors record the movements of the animals. Motor activity is expressed as the total number of infrared beam crossings. Open field activity was assessed with the Poly Track Video tracking System (San Diego Instruments, San Diego), which allowed video recording of movements during a 10-min stay in a brightly lit 50 × 50 cm open field. Path length and several other activity parameters were recorded.
Neuromotor coordination.
Walking pattern was determined by wetting the hind paws with ink and letting the animals walk on a strip of paper, down a brightly lit corridor (40 cm long, 4.5 cm wide) toward a dark compartment. Recordings were made in duplicate and were directly measured from the tracks. Rotarod performance was tested with an apparatus according to Dunham and Miya (13). When an animal stays on the rod for 2 min or falls off earlier, it is returned to the cage and put back for another trial 5 min later.
Learning behavior.
Passive avoidance learning was tested in a two-compartment step-through box. Animals were put in a small (5 × 9 cm) brightly lit compartment. After 5 sec, the sliding door leading to the big (20 × 30 cm) dark compartment was opened. Upon entrance into the dark compartment, the door was closed and animals received a slight electric foot shock. Twenty-four hours later, the experiment was repeated and the time the animals stayed in the small compartment was measured.
The Morris water maze test was performed according to a technique modified from Morris (14). Animals were placed in the pool four times at different random starting positions, with a 15-min break in between trials.
Two-factor analysis of variance (ANOVA) was conducted in all experiments to reveal significance of correlations of genotype and values of parameters measured.
Brainstem auditory evoked potentials.
Brainstem auditory evoked potentials were recorded using subcutaneous platinum needle electrodes during pentobarbitone anesthesia. One derivation was constructed using an electrode placed at the vertex as negative and an electrode placed above the lumbar spine as positive lead. A third subcutaneous needle was inserted over the thoracic spine and connected to ground. The stimulus was a series of clicks, delivered at a rate of 11 Hz through a speaker 10 cm in front of the mouse. The recorded signal was averaged on-line using a pathfinder (Nicolet). For each animal two recordings of 2000 sweeps were made.
Morphological Investigations. Tissue preparation.
Morphological examinations were performed on animals 6–24 months of age. Tissues were fixed by vascular perfusion through the left ventricle with 3% glutaraldehyde or 3% paraformaldehyde. For immunohistochemistry, specimens fixed in paraformaldehyde were embedded in paraffin. Additionally, unfixed and Zamboni-fixed brains were frozen and cut on a cryomicrotome. For electron microscopy, specimens were postfixed in osmium tetroxide and processed. Semithin sections were stained with toluidine blue at alkaline pH or with p-phenylenediamine. Ultrathin sections were stained with uranyl acetate and lead citrate.
Visualization of stored lipids by histochemistry.
Vibratome slices cut from glutaraldehyde-fixed material were incubated with 0.025% alcian blue at pH 5.7 in 0.025 M sodium acetate buffer containing 0.3 M MgCl2 (15). Frozen sections from unfixed tissues were stained with 0.1% toluidine blue or 1% alcian blue at pH 1 (16).
Immunohistochemistry.
Sections were incubated with monoclonal antibodies against glial fibrillary acidic protein to visualize astrocytes, (Sigma), F4/80 for murine microglia (American Type Culture Collection), and sulfatide (provided by S. Ghandour, Laboratoire de Neurobiologie Ontogemque, Strasbourg, France) (17). The brain isoform NO synthase polyclonal antibody was from Biomol (Plymouth Meeting, PA).
Prior to the primary antibody, sections were incubated with 3% hydrogen peroxide in methanol to suppress endogenous peroxidase activity. After blocking with 0.75% BSA in PBS, the primary antibody dissolved in the same blocking buffer was applied for 1 h at room temperature. Detection of primary antibody binding was performed by using biotinylated secondary antibodies and avidin-biotin complexes tagged with peroxidase or glucose oxidase (Vector Laboratories).
Morphometric analysis of myelinated axons.
Semithin sections of the optic nerve and corpus callosum were stained with p-phenylenediamine. Sections were digitized at high magnification with a resolution of 512 × 512 pixels and 256 grey values using a semiautomatic image analysis system (AnalySIS 2.3, SIS, Münster, F.R.G.) attached to the charge-coupled device (CCD) camera of a video microscope. After digital contrast enhancement, images were binarized to extract digital representations of axons and myelin sheaths. At least 500 myelinated axons from each sample were assessed for minimal, mean, and maximal area of axonal transverse section. Sample data were subjected to nonparametric Mann–Whitney tests to analyze the statistical significance of the differences observed.
RESULTS
Disruption of the Murine ASA Gene.
The structure of the replacement vector introduced into the embryonic stem cells is shown in Fig. 1. The vector encompasses 6 kb of 5′ flanking upstream sequence, the entire coding sequence, and 2 kb of 3′ flanking downstream sequences of the murine ASA locus. A tk cassette was introduced at the 5′ end of the vector. The neo cassette was placed into the coding sequence of exon 4 and disrupts the open reading frame. Both cassettes had the same 5′ → 3′ direction as the ASA gene. After introduction of the vector into ES cells and selection with G418 and gancyclovir, 89 resistant colonies were obtained and examined by Southern blot analysis. A probe was isolated from a region 3′ of the ASA gene, which is not part of the replacement vector. In the wild-type locus, this external probe hybridizes to a 9-kb EcoRI fragment, while due to the introduction of an EcoRI site within the neo cassette, this fragment is reduced to 6 kb in the homologously recombined locus (see Fig. 1). Similarly an external 5′ probe differentiates a 10.5-kb wild-type NsiI fragment from a 12-kb fragment at the recombined locus (data not shown). Cells from two independently targeted ES cell colonies were injected into blastocysts. In a total of 18 litters, 83 mice were born, 10 of which were chimeras; 3 mice transmitted the mutant allele to their offspring. ASA(+/−) mice were bred such that ASA(−/−) mice were obtained. Frequencies of genotypes of offspring of ASA(+/−) mice were in accordance with Mendelian inheritance (data not shown). ASA(−/−) mice are fertile. Compared with controls no difference in litter size was noted.
ASA-Deficient Mice Do Not Metabolize Sulfatide.
Total RNA isolated from cultured tail fibroblasts of ASA(−/−), (+/−), and (+/+) mice was subjected to Northern blot analysis. ASA mRNA was completely deficient in the ASA(−/−) mice. Even after long exposure no signal was detected (data not shown). A specific and sensitive assay to measure ASA activity is the sulfatide loading assay. Cultured fibroblasts of (−/−), (+/−), and (+/+) mice were allowed to endocytose fluorescently labeled sulfatide (10). Fibroblasts (Fig. 2) and cultured oligodendrocytes (data not shown) from ASA(+/+) and (+/−) mice converted most of the sulfatide to galactosyl ceramide and ceramide—72% for (+/+) and 61% for (+/−), respectively—whereas no turnover of sulfatide was detected in cells from ASA (−/−) mice.
Figure 2.
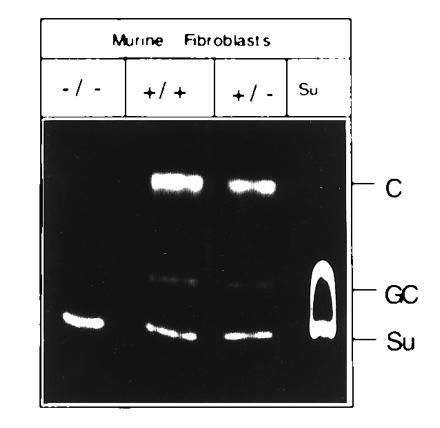
Sulfatide loading of cultured fibroblasts. Cultured tail fibroblasts of −/−, +/−, and +/+ mice were exposed to fluorescently labeled sulfatide. Cells were allowed to metabolize the lipid for 16 h. Extracted lipids were subjected to thin layer chromatography and visualized by UV-irradiation. Lane Su contains only sulfatide. Su, nonmetabolized sulfatide; GC, galactocerebroside; C, ceramide.
Neuromotor, Behavioral, and Auditory Assessment of Deficient Mice.
Behavioral and neuromotor examinations were performed with 10 ASA(−/−) mice, 6 age matched (+/−), and 10 (+/+) control mice. All mice were female, aged 12–14 months and of comparable weight. The examinations of the neuromotor capabilities of the animals can be divided into three categories. First, general motor and open field activity were determined. In these experiments, no difference was noted between control and deficient animals.
Second, the walking pattern of mice and their performance on a rotarod apparatus was evaluated. Paw measures like print length and toe spread were not different between control and deficient animals, but the distance of the hind limb paw prints was significantly smaller in the knockout mice compared with the controls. The mean maximal distance of left/right foot prints was 73.1/74.3 mm in (+/+) animals, 75.8/79.8 mm in (+/−) animals, and 68.1/67.2 mm in (−/−) animals. Two-factor ANOVA showed a significant effect of genotype on paw print distance [F(1,28) = 9.6, P = 0.004]. Control and deficient animals were placed on a rotarod apparatus and the number of mice able to stay on the rod for 2 min was counted. Most of the (+/+) and (+/−) animals were able to stay on the rod from second trial onward, whereas only 4 or 5 out of 10 (−/−) animals stayed on the rod for 2 min. The difference was significant (P = 0.01, two-tailed Fisher exact test; Fig. 3).
Figure 3.
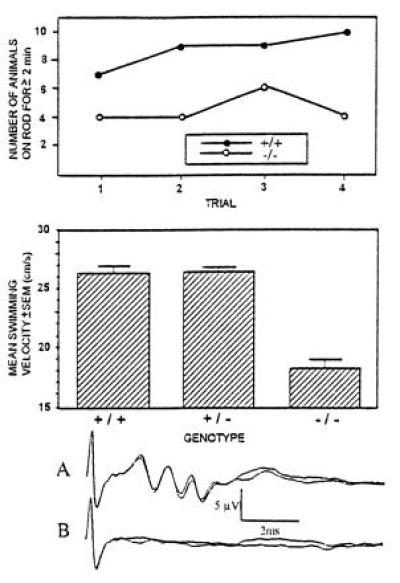
Summary of the neuromotor examinations of control and deficient mice. The figure summarizes the results of tests in which neuromotor abnormalities were detected in the ASA-deficient mice. (Upper) Number of mice able to stay on a rotating rod for longer than 2 min. In each group, 10 mice were examined. Number of subsequent trials is indicated on the abscissa. (Middle) Swimming velocity of control and ASA-deficient mice. (Lower) Control (trace A) and deficient animals (trace B) were placed in front of a loudspeaker emitting clicks at a frequency of 11 Hz. Brainstem auditory-evoked potentials were recorded from electrodes placed in the anesthesized mice. Each curve represents 2000 measurements.
Third, learning abilities of the mice were evaluated with the passive avoidance learning tests and the Morris water maze procedure. In the passive avoidance test, animals learn to avoid a compartment in which they receive a slight electric shock. No difference was noted between control and deficient animals. The Morris water maze evaluates spatial learning capabilities of small rodents. Probe trials revealed that the swimming velocity of ASA-deficient mice was significantly lower than in the controls (Fig. 3). Statistical analysis with one-factor ANOVA showed that the difference between groups was significant [F(2,20) = 5.6, P = 0.01]. During eight trials, the time required to find the hidden platform (escape latency) and the length of the swimming path decreased for control and (−/−) animals as a result of training. However, in all trials and for both measures the deficient animals performed significantly worse than the controls.
Auditory brainstem evoked potentials were recorded from three ASA(−/−) and three control animals. All deficient mice showed an absence of brainstem auditory-evoked potentials (Fig. 3).
In the second year of life, animals developed a low-frequency tremor of the head (estimated frequency, 2–3 sec−1), which was not seen in controls. The tremor was only visible when animals move but not when they rest.
Morphological Investigations. Storage of sulfated glycolipids in parenchymal organs.
Sulfatide was stored in kidneys, gall bladder, and bile ducts of mice 6–11 months of age. In kidneys, storage was most prominent in Henle’s loop and moderate in collecting ducts. With toluidine blue, the storage material gave a metachromatic reaction. No evidence of storage was found in hepatocytes, adrenal glands, thyroid, skeletal muscle, lymphatic organs, urinary bladder epithelia, and gastric mucosa.
Neuropathology of ASA-deficient mice.
The effect of ASA deficiency in 11- and 24-month-old mice on brain morphology appeared less severe than described for the final stages of the human disease. In brains of 11-month-old mice, staining with alcian blue revealed storage of sulfatide within the white matter (corpus callosum, hippocampal fimbria, internal capsule, and optic nerve) (Fig. 4). On the light microscopical level, storage in the white matter appeared in two different morphologies: (i) in the form of numerous fine granules arranged immediately adjacent to myelinated nerve fibers and (ii) as clusters of larger granules within swollen cells interspersed within the white matter. The small granules may represent sulfatide accumulation in oligodendrocyte processes. Some of the cells storing the larger granules were identified as astrocytes by immunohistochemistry with an anti-glial fibrillary acidic protein antibody, others were identified as microglia by immunohistochemistry with the F4/80 antibody. Ultrastructurally, lamellar deposits, herringbone patterns, and tuffstone-like materials were found in astrocytes, oligodendrocytes microglial, and Schwann cells (Fig. 4). Myelin sheaths had a normal ultrastructure. However, a quantitative analysis of axon cross-sectional area of myelinated fibers in the corpus callosum and the optic nerve revealed a statistically significant (P < 0.0001) reduction from 0.65 μm2 to 0.50 μm2 and 1.11 μm2 to 0.79 μm2, respectively.
Figure 4.
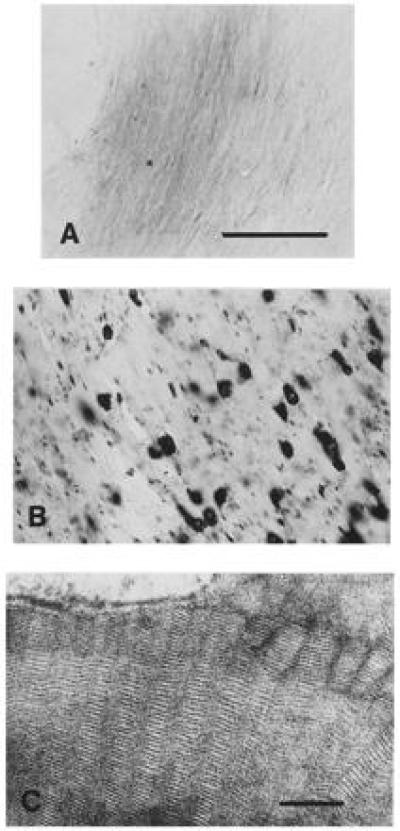
Histochemistry and ultrastructure of sulfatide storage. White matter (hippocampal fimbria) sections of a control (A) and ASA-deficient mouse (B) were stained for sulfatide with alcian blue. No staining can be detected in the brain of the control mouse. White matter of the deficient mouse displays cells filled with large storage granules and linearly arranged small cellular processes with small granules. (Bar = 100 μm.) (C) Ultrastructure of storage material. Prismatic herringbone-like inclusions in an astrocyte of a deficient mouse. (Bar = 100 nm.)
Compared with 1-year-old mice, alcian blue staining revealed an increase in sulfatide accumulation at 2 years. Sulfatide was now also found in the white matter of the cerebellum (data not shown). Storage was now seen predominantly in microglial cells, which were activated as determined by RCA I binding (RCA I is a marker of microglial activation) (Fig. 5) and upregulated major histocompatibility complex class II (MHC II) expression (data not shown). Activation tends to appear earlier and to be more severe in the cerebellum than in the telencephalic hemispheres. Activation of microglia started at the age of 1 year and appeared to be generalized at the age of 2 years, when white matter was crowded with epitheloid microglia (Fig. 5.)
Figure 5.
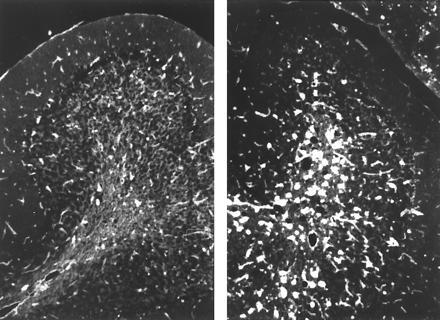
Activation of microglial cells in 1- and 2-year-old animals. Cerebellar sections of 1 (Left) and 2-year-old (Right) animals are shown. Sections show binding of RCA I, a marker of microglial activation.
White matter tracts such as corpus callosum or optic nerve displayed a considerable astrogliosis. Glial fibrillary acidic protein-positive cells were seen in increased numbers and displayed enlarged, sometimes epitheloid somata and broader cell processes. In semithin sections, the astrocytes were similarly seen at higher densities compared with controls (Fig. 6). The extent of astrogliosis was unaltered when brains of animals 1 and 2 years of age were compared. Several classes of neurons exibited sulfatide storage. Neuronal storage without apparent cellular damage was observed in several nuclei of brainstem, diencephalon, spinal chord, and cerebellum. In contrast, no storage of sulfatide was detected in Purkinje cells of the cerebellar cortex, although in (−/−) mice, these neurons exhibited crippled dendritic trees with narrower profiles and irregular swellings (Fig. 6).
Figure 6.
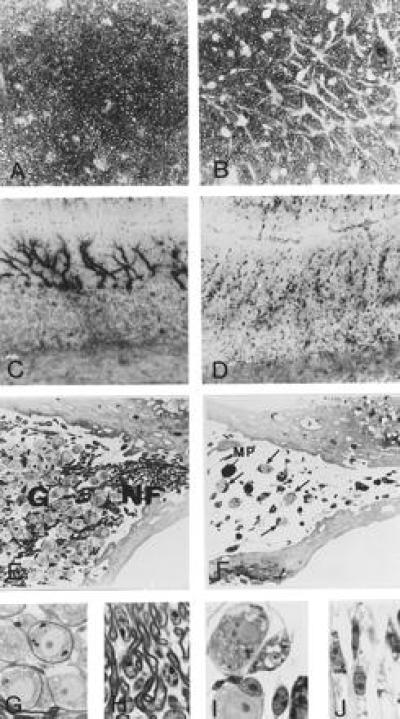
Pathology of optic nerve, cerebellum, and acoustic ganglion. Transverse sections of the optic nerve of control (A) and ASA-deficient mouse (B) were stained with p-phenylenediamine. Myelin sheaths appear dark whereas axons and glial cells appear pale. Nonstained astrocytes appear as white patches, the number and size of which is clearly increased in the deficient animal. The cells feature thickened and elongated processes. Purkinje cells (C and D) were visualized by immunohistochemistry using an antibody to brain isoform of NO synthase. Cerebellar cortex of a control mouse is shown in C and that of a deficient mouse in D. Section of the inner ear of a control (E) and ASA-deficient (F) 11-month-old mouse. Ganglion cells (G) and myelinated nerve fibers (NF) in the acoustic ganglion are severely reduced in the deficient mice. Some lipid-laden macrophages (MP) are observed. Arrows depict surviving neurons. Details of perisomatic (G and I) and periaxonal (H and J) Schwann cells of control (G and H) and ASA (−/−) mice (I and J). In the deficient mouse, Schwann cells are swollen and filled with abnormal inclusions.
Neuronal damage was dramatic in the inner ear of ASA(−/−) mice. In animals 8 and 11 months of age, the numbers of acoustic ganglion cells as well as their corresponding myelinated nerve fibers were greatly reduced (Fig. 6). The remaining ganglion cells were surrounded by Schwann cells containing large amounts of storage material. In younger mice (6 months), the number of acoustic ganglion cells appeared normal, but the neurons and the surrounding Schwann cells showed marked sulfatide storage. Storage was also observed in the vestibular ganglion but without reduction of neurons and nerve fibers.
In Schwann cells of the peripheral nerves, sulfatide storage was also detected, but there were no signs of demyelination (data not shown).
DISCUSSION
ASA deficiency in (−/−) mice was demonstrated by Northern blot analysis and by the sulfatide loading assay, which is suitable to detect even very low residual enzyme activities such as those found in fibroblasts of juvenile MLD patients (10). The absence of detectable turnover of sulfatide in the cells of (−/−) animals indicates a complete absence of ASA activity. Thus, biochemically the animals resemble the severe late infantile form of MLD (4, 5).
The overall pattern of sulfatide storage resembled that found in autopsy material from human cases (1, 2). The mice, however, displayed a comparatively mild grade of neurological and neuropathological alterations. Late infantile MLD patients develop symptoms at the age of 18 months, which progress rapidly and lead to fatal outcome in childhood. Pathologic alterations described in tissues of final stage patients include severe demyelination and spongiform degeneration. Up to the age of 2 years, ASA(−/−) mice did not show evidence of widespread demyelination and it is thus not surprising that the symptoms of the animals do not resemble the devastating neurologic deficits seen in the advanced stages of human disease. However, a detailed histological examination revealed a variety of pathologic alterations in the nervous system. Axon cross-sectional area of myelinated fibers in the optic nerve and the corpus callosum was reduced. Astroglial cells were more prominent in size and number than in control animals. An astrogliosis has also been described in autoptic human material and has been interpreted as reactive and secondary to demyelination (1). Microglia cells appeared mostly normal in younger animals but were activated at the age of 2 years. The presence of astrogliosis and microglial activation without demyelination in the murine nervous system raises the possibility that astrocytes and microglia may be an early target of ASA deficiency. The impairment of oligodendroglial function, which causes the pathological alterations characteristic for autoptic human tissues, may be a secondary late event in MLD pathogenesis.
Similar to humans, storage material was observed in several encephalic nuclei. Remarkably, in many neurons sulfatide storage did not cause apparent cellular damage. The most severely affected neurons were found in the inner ear. The dramatic reduction of neurons and myelin in the acoustic ganglion may represent the full extent of demyelination and neuronal damage seen in humans. Functionally, the histologic findings in the acoustic ganglion are reflected by the complete loss of brainstem auditory-evoked responses in the deficient mice. Although in humans no histologic analysis of the inner ear has been reported, a delay in brainstem auditory-evoked potentials has been described as one of the earliest symptoms in humans (18).
Cerebellar Purkinje neurons exhibited considerable malformations of their dendritic trees, notably without any obvious signs of sulfatide storage. Thus, the alterations cannot be directly attributed to lipid storage but have to involve other pathogenic mechanisms. In humans, similar Purkinje cell alterations have not been described, although cerebellar damage including astrogliosis, demyelination, and loss of Purkinje cells and fiber connections has been documented (19). It is important to note that initial symptoms in humans are hypotonic paresis and ataxia, which may both be explained by an altered cerebellar function. It seems possible that Purkinje cell alterations similar to those found in the mice may also be present in the early stages of human disease but may have escaped detection, because they may no longer be visible in a severely demyelinated atrophic brain or because the structural preservation after postmortem fixation is poor in contrast to the murine tissues preserved by vascular perfusion fixation. Thus, it is conceivable that the initial symptoms of patients may be caused by impaired cerebellar function rather than by demyelination.
The impairment of neuromotor coordination in deficient mice resembles early stages of human disease, in which ataxia, tremor, and a hypotonic paresis are frequently found. In the Morris water maze, the deficient mice performed worse than the controls. However, with the available set of data, it cannot be concluded that this may indicate reduced learning abilities, because the decreased swimming velocities and impaired coordinative abilities might have been a serious impediment to the training procedure.
Except for deafness, it is not possible to ascribe the neurologic symptoms of the mice specifically to one of the pathologic findings. The presence of symptoms in the absence of white matter degeneration proves the involvement of neuronal, astroglial, and microglial pathology in the pathogenesis of the disease. This suggests that the onset of clinical symptoms in humans may also occur prior to demyelination.
The reasons for the comparatively mild phenotype of (−/−) mice remain unclear. Similarly, mice deficient for β-hexosaminidase A have mild pathology, whereas in humans this deficiency causes fatal Tay–Sachs disease (20). This has recently been explained by differences in the metabolic pathways of the storage compound (21). It should be noted that alternative ASA-independent pathways for sulfatide have been reported (22, 23). If mice can metabolize sulfatide to a small extent even in the absence of ASA, they may accumulate less lipid than humans. Lysosulfatide, a derivative of sulfatide, is toxic to cells and a potent inhibitor of protein kinase C (24). Increased lysosulfatide concentrations have been found in tissues of MLD patients and it has, therefore, been implicated as a major factor in the pathogenesis of MLD (25). If lysosulfatide production is lower in mice or if its degradation is preserved, toxic levels may not be reached in the ASA(−/−) mice.
In summary, the pattern of sulfatide storage (except for the lack of metachromatic material in murine hepatocytes and adrenal glands), astrogliosis, and decreased axonal cross-sectional area in ASA-deficient mice is highly reminiscent to human pathology. The murine symptoms resemble the delay of brainstem auditory-evoked responses, ataxias, tremor, and hypotonic paresis seen early in human disease. However, the pathogenic process in mice does not proceed to the devastating demyelination and symptoms seen in humans. The similarities indicate that the mice may reflect an early stage of human disease and thus open the opportunity the follow the early pathogenic events of MLD in detail.
Acknowledgments
We thank Dr. Ghandour (Strasbourg, France) for the anti-sulfatide monoclonal antibody. This work was supported by the Deutsche Forschungsgemeinschaft and the Fonds der Chemischen Industrie. V.G. was supported by the Hermann und Lilly Schilling-Stiftung of the Deutscher Stifterverband.
Footnotes
Abbreviations: ASA, arylsulfatase A; MLD, metachromatic leukodystrophy; tk, thymidine kinase; ES, embryonic stem.
References
- 1.Kolodny E H. In: The Metabolic and Molecular Bases of Inherited Disease. 6th Ed. Scriver C R, Beaudet A L, Sly W S, Valle D, editors. New York: McGraw–Hill; 1995. pp. 2693–2740. [Google Scholar]
- 2.Wolfe H J, Pietra G G. Am J Pathol. 1964;44:921–930. [PMC free article] [PubMed] [Google Scholar]
- 3.Gieselmann V, Zlotogora J, Harris A, Wenger D A, Morris C P. Hum Mutation. 1994;4:233–242. doi: 10.1002/humu.1380040402. [DOI] [PubMed] [Google Scholar]
- 4.Polten A, Fluharty A L, Fluharty C B, Kappler J, von Figura K, Gieselmann V. N Engl J Med. 1991;324:18–22. doi: 10.1056/NEJM199101033240104. [DOI] [PubMed] [Google Scholar]
- 5.Leinekugel P, Michel S, Conzelmann E, Sandhoff K. Hum Genet. 1992;88:513–523. doi: 10.1007/BF00219337. [DOI] [PubMed] [Google Scholar]
- 6.Kreysing J, Polten A, Hess B, von Figura K, Menz K, Steiner F, Gieselmann V. Genomics. 1994;19:249–256. doi: 10.1006/geno.1994.1055. [DOI] [PubMed] [Google Scholar]
- 7.Hooper M, Hardy K, Handyside A, Hunter S, Monk M. Nature (London) 1987;326:292–295. doi: 10.1038/326292a0. [DOI] [PubMed] [Google Scholar]
- 8.Köster A, Saftig P, Matzner U, von Figura K, Peters C, Pohlmann R. EMBO J. 1993;12:5219–5223. doi: 10.1002/j.1460-2075.1993.tb06217.x. [DOI] [PMC free article] [PubMed] [Google Scholar]
- 9.Aloisi F, Agresti C, Levi G J. Neurosci Res. 1988;21:188–198. doi: 10.1002/jnr.490210211. [DOI] [PubMed] [Google Scholar]
- 10.Kreysing J, Bohne W, Bösenberg C, Marchesini S, Turpin J C, Baumann N, von Figura K, Gieselmann V. Am J Hum Genet. 1993;53:339–346. [PMC free article] [PubMed] [Google Scholar]
- 11.Maniatis T, Fritsch E F, Sambrook J. Molecular Cloning: A Laboratory Manual. 2nd Ed. Plainview, NY: Cold Spring Harbor Lab. Press; 1989. [Google Scholar]
- 12.Crawley J, Goodwin F K. Pharmacol Biochem Behav. 1980;13:167–170. doi: 10.1016/0091-3057(80)90067-2. [DOI] [PubMed] [Google Scholar]
- 13.Dunham N W, Miya T S. J Am Pharm Assoc. 1957;46:208–209. doi: 10.1002/jps.3030460322. [DOI] [PubMed] [Google Scholar]
- 14.Morris R G M. Learn Motiv. 1981;12:239–260. [Google Scholar]
- 15.Scott J E, Orford C R, Hughes E W. Biochem J. 1981;195:573–581. doi: 10.1042/bj1950573. [DOI] [PMC free article] [PubMed] [Google Scholar]
- 16.Lev R, Spicer S S. J Histochem Cytochem. 1964;12:309. doi: 10.1177/12.4.309. [DOI] [PubMed] [Google Scholar]
- 17.Ghandour M S, Nussbaum J L. NeuroReport. 1990;1:13–16. doi: 10.1097/00001756-199009000-00004. [DOI] [PubMed] [Google Scholar]
- 18.Brown F R, Shimizu H, McDonald J M, Moser A B, Marquis P, Chen W W, Moser H W. Neurology. 1981;31:980–986. doi: 10.1212/wnl.31.8.980. [DOI] [PubMed] [Google Scholar]
- 19.Yamano T, Ohta S, Shimada M, Okada S, Yotaka T, Sugita T, Yabuchi H. Brain Dev. 1980;2:359–369. doi: 10.1016/s0387-7604(80)80048-9. [DOI] [PubMed] [Google Scholar]
- 20.Yamanaka S, Johnson M D, Grinberg G, Westphal H, Crawley J N, Taniike M, Suzuki K, Proia R L. Proc Natl Acad Sci USA. 1994;91:9975–9979. doi: 10.1073/pnas.91.21.9975. [DOI] [PMC free article] [PubMed] [Google Scholar]
- 21.Sango K, Yamanaka S, Hoffmann A, Okuda Y, Grinberg A, Westphal H, McDonald M P, Crawley J N, Sandhoff K, Suzuki K, Proia R. Nat Genet. 1995;11:170–176. doi: 10.1038/ng1095-170. [DOI] [PubMed] [Google Scholar]
- 22.Tempesta M C, Salvayre R, Levade T. Biochem J. 1994;297:479–489. doi: 10.1042/bj2970479. [DOI] [PMC free article] [PubMed] [Google Scholar]
- 23.Sundaram S K, Fan J H, Lev M. J Biol Chem. 1995;270:10187–10192. doi: 10.1074/jbc.270.17.10187. [DOI] [PubMed] [Google Scholar]
- 24.Hannun Y A, Bell R M. Science. 1989;243:500–506. doi: 10.1126/science.2643164. [DOI] [PubMed] [Google Scholar]
- 25.Toda K I, Kobayashi K, Goto I, Ohno K, Eto Y, Inui K, Okada S. Neurochemistry. 1990;55:1585–1591. doi: 10.1111/j.1471-4159.1990.tb04942.x. [DOI] [PubMed] [Google Scholar]


