

Abstract
Upon exposure to UVA light, psoralens can induce DNA interstrand cross-links (ICLs), which can block DNA replication and transcription. Among the psoralen derivatives, 8-methoxypsoralen (8-MOP) is conventionally applied for psoriasis therapy, and amotosalen S59 is used to inactivate bacterial and viral pathogens in blood components. In addition to the ICL formation, psoralens also readily form various monoadducts (MAs) with thymidine residues in DNA when exposed to UVA light, and the biological implications for these monoadducts remain unclear. Here, we reported a method, which encompassed digestion with a single enzyme (nuclease P1) and LC-MS/MS, for the simultaneous quantification of ICL and MAs induced in human cells exposed with 8-MOP or S59 and UVA light. Our results showed that the yield of ICL induced by S59, which increased from 3.9 to 12.8 lesions per 103 nucleotides as the dose of UVA light increased from 0.5 to 10.0 J/cm2, was about 100 fold more than that induced by 8-MOP. In addition, three and five products were identified as 8-MOP- and S59-MAs, respectively, and the yields of MAs were significantly lower than that for ICL. The yields of the three 8-MOP-MAs were 7.6-2.2, 1.9-9.9 and 7.2-51 per 106 nucleotides and those of the five S59-MAs were 215-19, 106-39, 25-21, 32-146, and 22-26 per 106 nucleotides as the dose of UVA light increased from 0.5 to 10.0 J/cm2. Although the yields of MAs induced by 8-MOP and S59 were lower than those of the respective ICLs under the same exposure conditions, the formation of appreciable amounts of MAs might account for some of the mutations induced by psoralens.
Introduction
DNA interstrand cross-links (ICLs), which can block DNA replication and transcription by preventing strand separation, are induced by many carcinogens and anticancer drugs. Psoralens (or linear furocoumarins) are natural ICL-inducing agents synthesized in plants, and many psoralen derivatives, e.g., 8-methoxypsoralen (8-MOP, Scheme 1), 4,5’,8-trimethylpsoralen (TMP) and 3-(2-amino-ethoxymethyl)-2,5,9-trimethyl-furo[3,2-g]chromen-7-amotosalen (S59, Scheme 1), are developed as anticancer drugs or pathogen-inactivating agents.1, 2
Scheme 1.

The structures of 8-MOP, S-59, and the tetranucleotide and dinucleotides generated from nuclease P1 digestion of DNA interstrand cross-links and monoadducts induced by S59.
The planar tricyclic structure of psoralen facilitates its intercalation between base pairs of double-stranded nucleic acid, preferentially at 5’-TA-3’ site. Upon UVA irradiation, [2+2] cycloaddition occurs at the 3,4 or 4’,5’ double bonds of psoralen with the 5,6 double bond in thymine, forming a pyrone-side and furan-side monoadducts (MAp or MAf, the structures of the ICL and MAs induced by S-59 are shown in Scheme 1), respectively. Upon absorption of a second photon, MAf can further react with the other thymine on the opposing strand to form ICL. Additionally, it was observed that the MAf could be converted to MAp upon exposure to UVA light.3-7 However, MAp, owing to its lack of absorption of UVA light, cannot be activated to give interstrand cross-link or MAf. Aside from different types of adducts introduced by psoralen, stereoisomers are always involved because psoralen can react from either the 3’ or 5’ face of thymidine, depending on whether the 8-MOP is positioned on top of or underneath the plane of the nucleobase within the binding site.7, 8 Therefore, reaction between psoralen and duplex DNA is complicated, though ICL induction is always considered as the cornerstone of psoralen application.
8-MOP is a psoralen derivative bearing widespread scientific and clinical applications. Combined with long-wavelength UV light irradiation (PUVA), it has been employed in dermatology for many years to treat patients with vitilligo and psoriasis.9 It was also approved by the Food and Drug Administration in 1999 for the treatment of cutaneous T-cell lymphoma.10 Modifications of 8-MOP in isolated DNA and mammalian cells were extensively studied, and these studies mainly focused on ICL formation11-13 under UVA irradiation and the induction of different types of MAs upon exposure to long-wavelength light (>400 nm).4, 7
S59, a more recently developed psoralen derivative, is applied in pathogen-inactivation system with UVA irradiation since it can effectively target and damage DNA or RNA thereby preventing organisms from reproduction.1 Substantial previous studies showed that the application of S59, coupled with UVA irradiation, can inactivate a broad spectrum of bacterial and viral pathogens as well as leukocytes in platelet and plasma components, which protects the blood supply from transfusion-transmitted infections.14-16
Because of the complexity in photochemical reaction between psoralen and DNA, fundamental studies on the adduct distribution during irradiation process are necessary. To estimate the yields of photoadducts induced by psoralens, researchers have developed a number of direct or indirect methods including alkaline agarose electrophoresis,17 alkaline elution,18 alkaline comet assay19 and chromatographic techniques.20 Most methods require radio-labeling with 32P, 14C, or 3H, and most of them cannot well separate and hence quantify the various ICLs and MAs. We recently reported a sensitive and convenient method, which was based on the digestion of genomic DNA with a single enzyme (i.e., nuclease P1) and LC-MS/MS analysis of the resulting nucleotide mixture with the isotope dilution technique.21 This method allowed us to analyze directly the ICL formation in DNA extracted from human cells treated with 8-MOP and UVA irradiation. Here, we extended the quantification studies to compare the relative frequencies for the induction of ICLs by 8-MOP and S-59. Moreover, we assessed quantitatively the formation of MAs induced by these two psoralens.
Experimental Section
Reagents
All chemicals and enzymes, unless otherwise specified, were from Sigma-Aldrich (St. Louis, MO). All oligodeoxynucleotides (ODNs) used in this study were purchased from Integrated DNA Technologies (Coralville, IA). WM-266-4 cells and culture media were obtained from the National Cell Culture Center (Minneapolis, MN). D3-8-MOP was synthesized previously.21
Preparation of standard ICL-containing ODN
The synthesis of ODNs containing 8-MOP, D3-8-MOP and S59 interstrand DNA cross-link was carried out following the previously reported procedures.21 Briefly, 50 nmol self-complementary ODN d(CGCGCTAGCGCG) was annealed in a 200-μL reaction buffer, which contained 5 mM Tris (pH 7.6), 50 mM NaCl and 0.2 mM EDTA. The ODN solution was diluted in 5 mL reaction buffer and dispersed in a 3.5-cm-i.d. Petri dish. 8-MOP, D3-8-MOP or S59 was added to make the final concentration 20 μg/mL. In this respect, stock solutions were prepared by dissolving 8-MOP (D3-8-MOP) and S59 in ethanol and doubly distilled water, respectively. The reaction mixture was incubated in dark for 1 hr and irradiated on ice for 45 min using two 15-W Spectroline light tubes with emitting wavelength centered at 365 nm (Spectronics Corp. Westbury. NY). The reaction mixture was subsequently extracted twice with chloroform to remove the unreacted psoralens, and the ODNs were recovered by ethanol precipitation. ODN pellet was redissolved in water for HPLC separation.
Preparation of standard MA-containing ODN
ODNs containing psoralen mono-adducts were prepared by photo-reversal reaction of ICL-containing ODNs.22 The 365-nm irradiation mixture, which contained both ICL and unreacted starting material, was immediately irradiated on ice with short-wavelength UV light centered at 254 nm (Spectronics Corp., Westbury, NY). The distance between the light source and reaction solution was about 4 cm. To obtain the best yield of MA-containing ODNs, the time intervals for the exposure to 254 nm light were optimized to be 30 sec and 5 min, respectively, for the photo-reversal of 8-MOP- (D3-8-MOP-) and S59-ICL. After irradiation, the solutions were dried by using a Speed-vac and re-dissolved in water for HPLC separation.
HPLC conditions
The purification of ICL- and MA-containing ODNs was performed on a Beckman HPLC system (pump module 125, Karat 32 software version 3.0, Fullerton, CA) with a UV detector (module 126) monitoring at 260 nm. A solution of 50 mM triethylammonium acetate (TEAA, pH 6.8) and a solution of 30% (v/v) acetonitrile in 50 mM TEAA were used as mobile phases A and B, respectively. A gradient of 5 min of 0-25% B followed by 40 min of 25-50% B was employed for the isolation of ICL, and the flow rate was 0.8 mL/min. Another gradient of 0-15% B in 5 min followed by 15-50% B in 65 min was used for the separation of MAs, and the flow rate was 0.6 mL/min. A 4.6×250 mm YMC™ ODS-AQ column (5 μm in particle size and 120 Å in pore size, Waters Corporation, Milford, MA) was used, and the column was heated to 50 °C by using a Spectra-Physics SP8790 column heater (Spectra Physics, San Jose, CA). The purities of the ICL- and MA-containing oligomers were verified by LC-MS/MS analysis.
Cell culture and drug treatment
The experimental procedures for cell culture and psoralen treatment were described in detail in our previous report.21 Briefly, the WM-266-4 human melanoma cells were cultured at 37 °C in 5% CO2 atmosphere and in Eagle’s minimum essential medium containing 10% fetal bovine serum (Invitrogen, Carlsbad, CA), 100 IU/mL penicillin and 100 μg/mL streptomycin (ATCC). After growing to 95% confluence, cells were detached by trypsin-EDTA and harvested by centrifugation to remove the medium. The cell pellets were subsequently washed twice with phosphate-buffered saline (PBS) and resuspended in 20 mL PBS (106 cells/mL) in 10.4-cm-i.d. Petri dishes. Stock solution of psoralen was added to make the final concentration 500 ng/mL. The mixture was incubated in dark for 45 min prior to UVA irradiation.
UVA irradiation
The same light tubes used for the synthesis of standard ICL-containing ODNs were applied for cell irradiation, which was carried out on ice. The irradiation doses were 0, 0.5, 2.5, 5.0 and 10.0 J/cm2, which were measured using a Mannix UV-340 light meter (Mannix Instrument Inc., New York, NY). Immediately after irradiation, the cell viability was assessed to be approximately 85% by trypan blue staining. Cells were then harvested and washed with PBS and TE buffer (10 mM Tris-HCl, 1.0 mM EDTA) to remove the residual psoralen. A 5-mL lysis buffer, which contained 10 mM Tris-HCl, 0.1 M EDTA and 0.5% (w/v) SDS, was added to the cell pellet. To the resulting cell lysate was then added 150 μg Ribonuclease A and the solution was incubated at 37 °C for 1 hr, followed by the addition of 600 μg Proteinase K, and the resulting solution was incubated at 50 °C for another 3 hrs. The genomic DNA was then isolated from the mixture by phenol extraction and desalted by ethanol precipitation.
Enzymatic digestion
Genomic DNA (15 μg in 100 μL ddH2O) from the 8-MOP-treated cells was incubated with 0.5 pmol of authentic D3-8-MOP-ICL-carrying duplex ODN and 0.5 pmol of D3-8-MOP-MA-containing ODN. Nuclease P1 (0.3 unit) was added to the DNA mixture to perform the digestion. Similarly, the genomic DNA from the S59-treated cells (5 μg in 50 μL ddH2O) was digested together with 2.5 pmol of D3-8-MOP-ICL-containing duplex ODN by adding 0.1 unit of nuclease P1. No additional buffer was added except that present in the commercial preparation of the enzyme. The digestion mixture was incubated at 37 °C for 5 hrs and then extracted twice with chloroform to remove the enzyme. The aqueous layer was dried in a Speed-vac concentrator and reconstituted in water (15 μL for the 8-MOP sample and 10 μL for the S59 sample). A portion of the digestion mixture (5 μL for the 8-MOP sample and 2.5 μL for the S59 sample) was injected for each LC-MS analysis.
In order to construct calibration curves, different amounts of authentic ICL- and MA-containing ODNs along with 0.5 pmol each of D3-8-MOP-ICL- and D3-8-MOP-MA-containing ODNs were mixed with calf thymus DNA at the same amount as the genomic DNA described above (i.e., 5 μg), and the resulting mixture was digested with 0.1 unit of nuclease P1. The addition of calf thymus DNA to the calibration mixture serves to mimic the digestion conditions for the genomic DNA. This, together with the analysis of digestion mixtures of the standards and analytes under the same LC-MS/MS conditions, facilitated the reliable quantification of DNA lesions induced in cells.
LC-MS/MS analysis
Quantification of lesions in the above DNA digestion mixture was performed by online capillary HPLC-ESI-MS/MS using an Agilent 1100 capillary HPLC pump (Agilent Technologies) interfaced with an LTQ linear ion-trap mass spectrometer (Thermo Fisher Scientific, San Jose, CA). The system was set up for monitoring the fragmentation of the [M-2H]2- ions of tetranucleotides harboring the ICL induced by 8-MOP, D3-8-MOP or S59, and the [M-H]- ions of dinucleotides containing MAs formed from 8-MOP, D3-8-MOP or S59. A 0.5×150 mm Zorbax SB-C18 column (5 μm in particle size, Agilent Technologies) was employed for the separation and the flow rate was 6.0 μL/min. 1,1,1,3,3,3-hexafluoro-isopropanol (HFIP, pH was adjusted to 7.0 by addition of triethylamine) (Solution A) and methanol (Solution B) were used as mobile phases, and a gradient of 5 min at 0% B, 5 min of 0-20% B followed by 35 min of 20-50% B was employed for the separation. The capillary temperature for the electrospray source was kept at 300 °C to minimize the non-covalent adduct formed between HFIP and ODNs.
Results
Synthesis of MA-containing ODNs
We recently reported the use of nuclease P1 digestion combined with LC-negative-ion ESI-MS/MS for the sensitive quantification of ICL formed in cultured human cells treated with 8-MOP and UVA irradiation.21 We wish to extend the study to the quantification of both MAs and ICLs induced by 8-MOP and another psoralen derivative, S-59.
To quantify the psoralen MAs induced in cells, we first generated the MA-containing ODNs from the photo-reversal reaction of the respective ICL-containing duplex ODNs. We treated a self-complementary duplex ODN with 8-MOP (or S-59) and UVA light to obtain the ICL-bearing ODN, which was subsequently irradiated with short-wavelength UV light centered at 254 nm to generate the MAs.22 Under the optimized irradiation conditions, the percentages of the total MA-containing ODN were 15% and 14% for 8-MOP and S59, respectively, which were calculated by using the peak areas observed in selected-ion chromatograms obtained from LC-MS analysis or from the peak areas found in HPLC trace monitored by UV absorbance at 260 nm (Figure S1). During the HPLC separation, high column temperature (50 °C) and low flow rate (0.6 mL/min) were employed to resolve the isomeric MA-containing ODNs from each other and from the unreacted parent ODN. It is of note that the photo-reversal reaction of [2+2] cycloaddition was highly efficient, and the ICL-containing ODN was barely detectable in the photoreversal reaction. For both 8-MOP- and S59-treated ODNs, three main peaks eluting after the starting material were collected for further mass spectrometric characterization (Figure S1). The tandem mass spectra for the three 8-MOP-MA- (or S59-MA-) containing ODNs were identical (Example spectra for ODNs containing a 8-MOP-MA or S59-MA are shown in Figure 1). The observed fragment ions validated that psoralen was conjugated exclusively to the single thymine residue in the ODN. Taking the 8-MOP-MA-containing ODN as an example, the product-ion spectrum of the [M-3H]3- ion (m/z 1072.6, Figure 1a) yielded typical [an-base] and wn series ions 23. Compared with the spectrum of unmodified ODN, the observed m/z values for the [a7-A]2- (m/z 1071) and [a5-C] ions (m/z 1333) showed that 8-MOP was modified on either the cytosine at the 5th position or the thymine at the 6th position counting from the 5’ terminus of the ODN (Figure 1a). The observed m/z values for the w72- (m/z 1207) and w5 (m/z 1582) ions (Figure 1a), on the other hand, supported that the modification occurs on either the 6th thymine or 7th adenine. Together, these results demonstrated that 8-MOP was covalently bonded with the 6th thymine. Similarly, the product-ion spectrum illustrated in Figure 1b supports that the S-59 is conjugated with the 6th thymine in the ODN.
Figure 1.

Product-ion spectra of the [M-3H]3- ion of 8-MOP-MA-containing ODN (a) and S59-MA-containing ODN (b).
UV absorption measurements for 8-MOP-MA-containing ODNs showed that the first fraction exhibits absorbance at 340 nm whereas the two later eluting fractions have no apparent absorbance at this wavelength (Figure S2a). Since only 8-MOP-MAf has appreciable absorption at around 340 nm 7, we assign the early-eluting MA-containing ODN as the furan-side adduct (MAf) and the two later-eluting MA-containing ODN fractions as the pyrone-side adducts (MAp). Analogous results were found for the S59-MA-containing ODNs (Figure S2b).
Each MA-containing ODN fraction was digested with nuclease P1 to release the dinucleotide 5’-pTpA-3’ with the thymine being conjugated with psoralen, which was then separated by HPLC using HFIP buffer and analyzed by MS/MS. Again, the product-ion spectra of the [M-H]- ions of the three 8-MOP-MA- (or S59-MA)-carrying dinucleotides were identical. After digestion, the dinucleotides arising from the first fraction of 8-MOP-MA-containing ODN exhibited a retention time of ~28 min, whereas the dinucleotides liberated from the later two MA-containing ODN fractions shared the same retention time (i.e., ~32 min) on the capillary column with the HFIP elution buffer.
The above data revealed that the dinucleotides produced from nuclease P1 digestion of two MA-carrying ODNs, which were retained differently on the ODS-AQ column, exhibited the same retention time under the LC-MS conditions. Several factors may contribute to this phenomenon, which include the different mobile phases used for the HPLC separation (i.e., TEAA vs. HFIP), different types of analytes (12-mer ODN vs. dinucleotide), and/or the complex rearrangement(s) among different psoralen-DNA monoadducts. In the latter respect, studies on the chemical structure of 8-MOP-DNA photoadducts revealed that the 8-MOP-MAf was predominantly in the cis-syn configuration and it contained two diastereomers.24 However, six of the eight possible cyclobutyl adducts of 8-MOP-MAp could form.25 Moreover, 8-MOP-MAp was found to be unstable in aqueous solution, which can give rise to the starting nucleoside through the splitting of the cyclobutane ring.25
Identifications of ICL and MAs induced by 8-MOP and S59 in vivo
Nuclease P1 digestion could facilitate the release of ICL from genomic DNA as a tetranucleotide, where the thymine residues in the two dinucleotides (pdTpdA) are linked with the psoralen component, and the MA as a dinucleotide pdTpdA in which the thymine is coupled with the psoralen (Scheme 1). In this respect, nuclease P1 is considered a single strand-specific endonuclease. However, the genomic DNA becomes denatured during chloroform extraction and ethanol precipitation; thus, it can be cleaved by nuclease P1. SIC for monitoring the m/z 742.1→ 1154.1 transition of the 8-MOP-ICL showed one peak at 28.8 min (Figure 2a). The product-ion spectrum of the doubly deprotonated tetranucleotide (m/z 742.1) gave several diagnostic fragment ions that were consistent with the previous report,21, 26 i.e., the ions of m/z 330, 921, 1019, 1154, 1252 and 1387 (Figure 2c). SIC for the m/z 784.9 → 1239.4 transition of the S59-ICL also yielded one peak at 27.0 min (Figure 3a). The product-ion spectrum of the [M-2H]2- ion of the S59-ICL fraction revealed several fragment ions supporting again that the two thymines in this tetranucleotide were bridged by S59 (Figure 3c).
Figure 2.
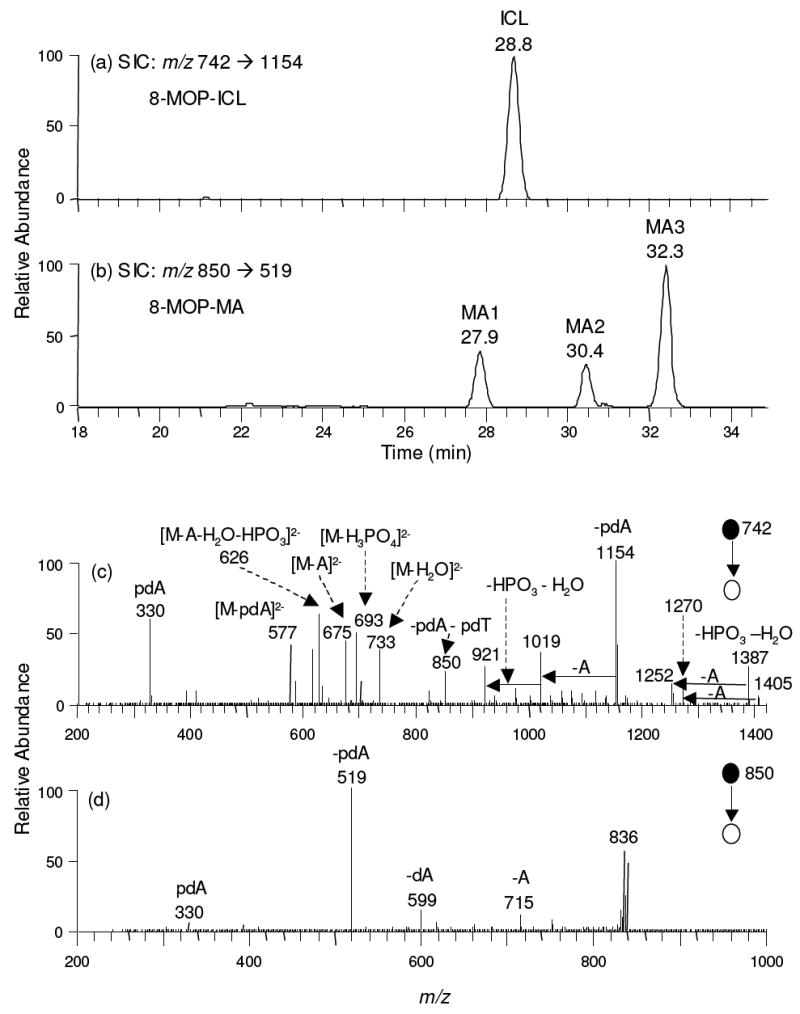
Selected-ion chromatograms (SICs) for monitoring the m/z 742 → 1154 transition (for 8-MOP-ICL-containing tetranucleotide, panel a) and the m/z 850 → 519 transition (for 8-MOP-MA-containing dinucleotide, panel b) of the digestion mixtures of the cellular DNA samples, which were extracted from WM-266-4 cells treated with 500 ng/mL 8-MOP and 0.5 J/cm2 UVA light. Lower panel showed the product-ion spectra of the [M-2H]2- ion of 8-MOP-ICL (c) and the [M-H]- ion of 8-MOP-MA (d).
Figure 3.

Selected-ion chromatograms (SICs) for monitoring the m/z 785 → 1239 transition (for S59-ICL-containing tetranucleotide), (a) and the m/z 935 → 604 transition (for S59-MA-containing dinucleotide), (b) of the digestion mixtures of the cellular DNA samples, which were extracted from WM-266-4 cells treated with 500 ng/mL S59 and 0.5 J/cm2 UVA light. Lower panel showed the product-ion spectra of the [M-2H]2- ion of S59-ICL (c) and the [M-H]- ion of an S59-MA (d).
LC-MS/MS results revealed three peaks at 27.9, 30.4, and 32.3 min in SIC for the m/z 850 → 519 transition, monitoring the loss of a pdA from the [M-H]- ions of 8-MOP-MA-bearing dinucleotide pdTpdA, and, according to their elution orders, these three MAs were designated as 8-MOP-MA1, -MA2 and -MA3, respectively (Figure 2b, and Figure S3 depicts the SICs for the MAs formed upon exposure to different doses of UVA light). The MS/MS averaged from these three peaks were identical (Figure 2d). The most abundant fragment ion (m/z 519) arises from the loss of a pdA, whose complementary ion of m/z 330 is also found. In addition, an adenine or a 2’-deoxyadenosine can be eliminated from the [M-H]- ion to give the product ions of m/z 715 and m/z 599, respectively. Therefore, the same tandem mass spectra of the three MA-containing dinucleotides as those of the authentic MAs support that MAs were formed in vivo. Moreover, MA1 and MA3 exhibit the same retention time as the standard MAf and MAp, respectively, supporting that MA1 and MA3 are furan- and pyrone-side monoadducts, respectively.
LC-MS/MS also allowed for the identification of several MAs induced by S59. The SIC for the m/z 935 → 604 transition, which monitors the elimination of a pdA from the monoadduct-bearing dinucleotide, reveals five peaks (Figure 3b, and Figure S4 gives the SICs for monitoring the MAs formed upon exposure to different doses of UVA light), and we designate these five fractions as S59-MA1, -MA2, -MA3, -MA4 and -MA5. The product-ion spectra of the [M-H]- ions of these five fractions were again identical (Figure 3d depicts one example spectrum). The most abundant ion in the product-ion spectrum is attributed to the familiar loss of a pdA (m/z 604), and again the complementary ion of m/z 330 is present. Product ions of m/z 917, 800 and 684 are due to the losses of H2O, adenine and 2’-deoxyadenosine, respectively, lending support that thymidine in the dinucleotide was covalently bonded with one molecule of S59. LC-MS/MS analysis of the authentic S59-MA-containing dinucleotide showed the identical product-ion spectrum (data not shown), revealing that MAs can be induced by S59 in vivo. In addition, MA2 and MA4 share the same retention time as the authentic furan- and pyrone-side monoadducts, supporting that MA2 and MA4 are MAf and MAp, respectively.
Quantifications of ICLs and MAs induced by 8-MOP and S59 in vivo
Previous studies demonstrated that 8-MOP could induce effectively the formation of ICL in human cells, which increased with the rise of the UVA dose.21 Analysis of DNA from 8-MOP-treated cells gave the similar result of ICL formation and further demonstrated the MA formation. In our study, we employed D3-8-MOP-induced ICL-bearing duplex ODN and MA-containing single-stranded ODN as internal standards for the quantification. In the LC-MS/MS experiments, we monitored specifically the fragmentation of four ions, i.e., the [M-2H]2- ions of tetranucleotides containing a 8-MOP-ICL or D3-8-MOP-ICL and the [M-H]- ions of dinucleotides containing the two corresponding MAs. By using the calibration curves shown in Figure S5, we quantified the formation of 8-MOP-ICL and MAs. It turned out that the yields of 8-MOP-ICL increased from 38 to 162 lesions per 106 nucleotides when UVA doses changed from 0.5 to 10.0 J/cm2 (Figure 4a).
Figure 4.

The dose-dependent formation of 8-MOP-ICL (a) and S59-ICL (b) in WM-266-4 cells. The data represent the means and standard deviations of the results from three independent cell culture and drug treatments.
While quantifying the yields of the three 8-MOP-MAs, we assumed that the ionization efficiencies for the different MAs are the same and we constructed a calibration curve by using one internal standard (D3-8-MOP-MA2) and the corresponding analyte (8-MOP-MA2). This calibration curve was used to quantify all the 8-MOP MAs. The quantification results showed that, as the UVA doses increased from 0.5 to 10.0 J/cm2, 8-MOP-MA1 decreased from 7.6 to 2.2 adducts per 106 nucleotides, and 8-MOP-MA2 and -MA3 increased from 1.9 to 9.9 and from 7.2 to 50.8 lesions per 106 nucleotides, respectively. For cells incubated with 8-MOP but without UVA light irradiation, little ICL or MA could be detected by LC-MS/MS analysis (Figure 5a).
Figure 5.
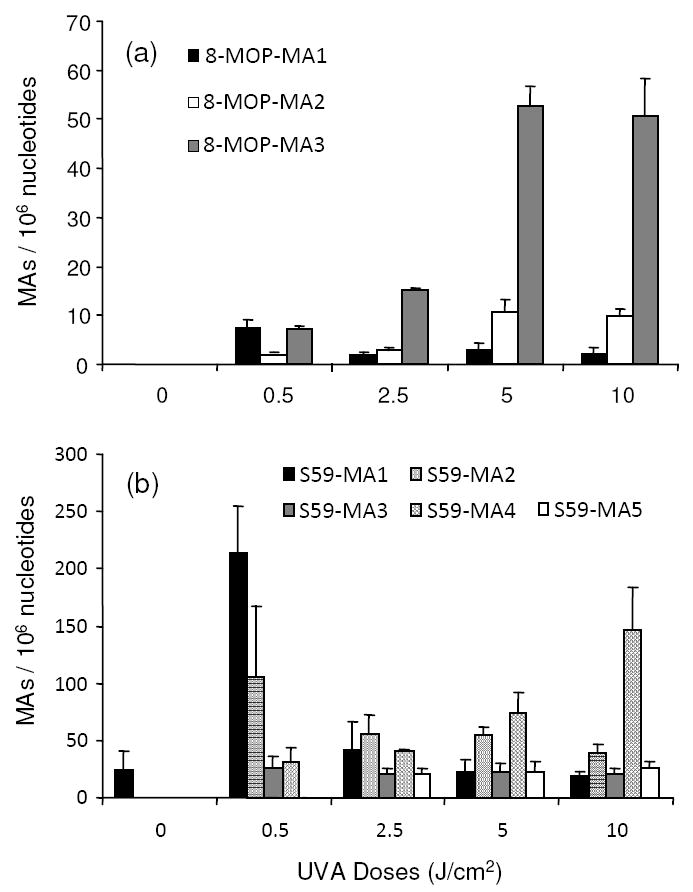
The dose-dependent formation of 8-MOP-MAs (a) and S59-MAs (b) in WM-266-4 cells. The data represent the means and standard deviations of the results from three independent cell culture and drug treatments.
A similar coupled nuclease P1 digestion/LC-MS/MS method was employed for the quantification of ICL and MAs induced by S59 in cultured WM-266-4 cells, and we employed the D3-8-MOP-ICL-containing duplex DNA as the surrogate internal standard. For calibration, authentic S59-ICL- or -MA-containing ODNs were digested together with D3-8-MOP-ICL-bearing ODNs, where the MAp-containing standard was chosen to quantify all the five S59-MAs. (The calibration curves are depicted in Figure S5).
The results showed that the yield for S59-ICL increased from 3.9 to 12.8 per 103 nucleotides as the dose of UVA light increased from 0.5 to 10.0 J/cm2 (Figure 4b), which is approximately 100 times greater than the yield of the 8-MOP-ICL under the same irradiation conditions. In addition, S59-MA1, -MA2, and -MA3 decreased from 214.7 to 18.9, from 105.7 to 39.5, and from 25.0 to 21.0 lesions per 106 nucleotides, respectively, with the dose of the UVA light being increased from 0.5 to 10.0 J/cm2, however, S59-MA4 and -MA5 increased from 32.3 to 146.2 and from 21.6 to 26.1 lesions per 106 nucleotides, respectively (Figure 5b). It is worth noting that S59-MA1 was also found, at a level of 23.9 adducts per 106 nucleotides, in the DNA sample isolated from cells that were incubated with the drug but without exposure to UVA light, suggesting that the brief exposure of cells to S59 and white light can also lead to the formation of MA-1.
Discussion
Psoralen derivatives have been widely used for treating human diseases and for inactivating pathogens in blood supplies and the basis of these applications lies in the formation of psoralen-DNA adducts. In this regard, psoralen can lead to the formation of both ICLs and MAs in DNA upon exposure to UVA light. However, there is a lack of sensitive and structurally informative method for assessing these DNA adducts. We recently demonstrated that the digestion of genomic DNA isolated from cells treated with 8-methoxypsoralen and UVA light with a single enzyme, i.e., nuclease P1, could result in the liberation of the psoralen-induced ICL as a tetranucleotide, and LC-MS/MS analysis of the nuclease P1-produced nucleotide mixture can allow for the quantitative assessment of the ICL formed in cells exposed with 8-MOP and UVA light.21 In the present study, we extended the application of the same analytical platform to the simultaneous assessment of the formation of MAs and ICL induced by two psoralen derivatives, i.e., 8-MOP and S-59. In this context, the MAs were liberated from DNA as dinucleotides upon nuclease P1 digestion.
Our results revealed that the combination of nuclease P1 digestion with LC-MS/MS afforded sensitive detection of both MAs and ICLs. In our study, quantification of 3 fmol 8-MOP-MA2 in 0.5 μg digested DNA sample was achieved. Under the same experimental conditions, the detection limit of the method for ICL is approximately 8 fmol. It can be envisaged that this sensitivity can be further enhanced by off-line HPLC enrichment to remove unmodified nucleotides and buffer salts. Furthermore, all the ICL and MA modifications can be assessed in a single LC-MS/MS run, which affords high analytical efficiency.
Our LC-MS/MS results revealed interesting in-vivo photochemistry of the two psoralens. First, we observed that different MAs exhibit distinct formation profile as the dose of UVA light increases. The LC-MS/MS results revealed that three and five MAs could be induced by 8-MOP and S-59, respectively. In this context, furan- and pyrone-side monoadducts induced by 8-MOP were previously reported. For instance, one MAp and three MAf were detected in mastocytoma cells 4, and two MAp and two MAf were observed in lymphocytes isolated from normal human blood 6. These monoadducts were induced by visible light with wavelength centered around 420 nm, whereas cells were exposed to UVA light in our experimental system.
The dose-dependent change in MA formation, as revealed by LC-MS/MS, allowed for the differentiation of furan-side MA from the pyrone-side counterpart. The transformation of 8-MOP-MAf to -MAp has been well elucidated by Tessman and co-workers 7. In this context, MAf can undergo in-helix photoreversal, and the released 8-MOP can conjugate again with the initial thymine or within the thymine residue in the opposing DNA strand to give MAf and MAp, respectively. The MAp, however, has no appreciable absorbance of UVA light, and it remains stable upon exposure to UVA light. The dynamic formation of 8-MOP-MAs, therefore, allowed us to assign the MA1 as MAf, and MA2 and MA3 as MAp.
The dynamic formation of the S59-MAs, along with the analysis of the nuclease P1 digestion mixture of authentic MA-bearing ODNs, also facilitated us to assign MA2 and MA4 as furan- and pyrone-side monoadducts, respectively. Meanwhile, the yield of S59-MA1 decreased even faster than that of S59-MA2 with the increase of the UVA dose (Figure 5b), supporting that S59-MA1 is also a furan-side adduct. Because of the subtle changes in the yields of the other two MAs, i.e., MA3 and MA5 (Figure 5b), the types of these MAs cannot be assigned unambiguously. In this context, it is worth noting that the number of MAs induced by the two psoralen derivatives might be underestimated. As revealed by the LC-MS/MS analysis of the nuclease P1 digestion mixture of authentic MA-containing ODNs, ODNs bearing different MAs may give dinucleotides with the same retention time on the LC-MS column. Thus, some peaks found in the SICs for the analysis of the genomic DNA digestion mixture may contain more than one isomer.
Second, we found that the yield of ICL induced by S59 in vivo is approximately two orders of magnitude greater than that induced by 8-MOP at each dose of UVA light exposure. Our observation is consistent with the previous finding by Grass and co-workers 27. In their study, ICL induced in genomic DNA of leukocytes by 8-MOP and S59 were quantified, by using liquid scintillation counting, to be 0.7 and 12.0 ± 3.0 per 1000 bp DNA, respectively. Two factors may account for the marked differences in efficiencies for inducing the formation of ICLs by the two psoralens: S59 may be intercalated into duplex DNA and/or absorb photon more effectively than 8-MOP. In addition, the 4’-2-amino-ethoxymethyl side chain on S59 may render it assuming better solubility and mobility in cellular environment than 8-MOP, thereby making S-59 more available for binding to DNA than 8-MOP.
Third, both S-59 and 8-MOP induce the formation of more ICL than MAs. We found that the total amounts of 8-MOP MAs increased from 20.2 to 66.6 lesions per 106 nucleotides, whereas the combined amounts of S59-MAs dropped from 319 to 194 adducts per 106 nucleotides as the dose of UVA light increased from 0.5 to 10.0 J/cm2 (Figure S6). Compared with the yields of ICLs, these results clearly showed that both types of psoralens induced greater levels of ICLs than MAs. It has been documented that DNA interstrand cross-links are more difficult to be repaired than monoadducts,28 which could contribute partially to the greater yield for the formation of ICL than for the MAs. On the other hand, the furan-side MA can be converted to ICL upon exposure to UVA light, and the quantum yield for this conversion was approximately 4 times higher than that for the initial formation of 8-MOP-DNA adduct,7 indicating that the efficient conversion could be the major factor leading to the formation of larger amount of ICL than MA.
Taken together, the analytical method presented here, which involves the combination of nuclease P1 digestion with LC-MS/MS, allowed for the quantitative assessment of both ICLs and MAs induced in cultured human cells by two common psoralen derivatives. The results from this study provided important knowledge for understanding the cytotoxic and mutagenic properties of these DNA adducts.
Supplementary Material
HPLC traces for the separation of MA-containing ODNs, UV absorption spectra, calibration curves for the quantifications, MS and LC-MS results. This material is available free of charge via the Internet at http://pubs.acs.org.
Acknowledgments
This work was supported in part by the National Institutes of Health (R01 CA101864) and Cerus Corporation. Congfang Lai was supported by the Chinese Scholarship Council.
References
- 1.BioDrugs. 2003;17:66–68. doi: 10.2165/00063030-200317010-00006. [DOI] [PubMed] [Google Scholar]
- 2.Hearst JE. Annu Rev Biophys Bioeng. 1981;10:69–86. doi: 10.1146/annurev.bb.10.060181.000441. [DOI] [PubMed] [Google Scholar]
- 3.Spielmann HP, Sastry SS, Hearst JE. Proc Natl Acad Sci USA. 1992;89:4514–4518. doi: 10.1073/pnas.89.10.4514. [DOI] [PMC free article] [PubMed] [Google Scholar]
- 4.Schmitt IM, Maxwell VM, Olack GA, Edelson RL, Chimenti S, Gasparro FP. J Photochem Photobiol B. 1994;22:17–21. doi: 10.1016/1011-1344(93)06946-z. [DOI] [PubMed] [Google Scholar]
- 5.Gasparro FP, Gattolin P, Olack GA, Deckelbaum LI, Sumpio BE. Photochem Photobiol. 1993;57:1007–1010. doi: 10.1111/j.1751-1097.1993.tb02963.x. [DOI] [PubMed] [Google Scholar]
- 6.Olack G, Gattolin P, Gasparro FP. Photochem Photobiol. 1993;57:941–949. doi: 10.1111/j.1751-1097.1993.tb02953.x. [DOI] [PubMed] [Google Scholar]
- 7.Tessman JW, Isaacs ST, Hearst JE. Biochemistry. 1985;24:1669–1676. doi: 10.1021/bi00328a015. [DOI] [PubMed] [Google Scholar]
- 8.Cimino GD, Gamper HB, Isaacs ST, Hearst JE. Annu Rev Biochem. 1985;54:1151–1193. doi: 10.1146/annurev.bi.54.070185.005443. [DOI] [PubMed] [Google Scholar]
- 9.Parrish JA, Fitzpatrick TB, Tanenbaum L, Pathak MA. N Engl J Med. 1974;291:1207–1211. doi: 10.1056/NEJM197412052912301. [DOI] [PubMed] [Google Scholar]
- 10.Knobler R, Jantschitsch C. Transfus Apher Sci. 2003;28:81–89. doi: 10.1016/S1473-0502(02)00103-9. [DOI] [PubMed] [Google Scholar]
- 11.Bredberg A, Nachmansson N. Carcinogenesis. 1987;8:1923–1927. doi: 10.1093/carcin/8.12.1923. [DOI] [PubMed] [Google Scholar]
- 12.Sage E, Bredberg A. Mutat Res. 1991;263:217–222. doi: 10.1016/0165-7992(91)90004-n. [DOI] [PubMed] [Google Scholar]
- 13.Babudri N, Pani B, Venturini S, Tamaro M, Monti-Bragadin C, Bordin F. Mutat Res. 1981;91:391–394. doi: 10.1016/0165-7992(81)90020-8. [DOI] [PubMed] [Google Scholar]
- 14.Nussbaumer W, Allersdorfer D, Grabmer C, Rheinschmidt M, Lin L, Schonitzer D, Lass-Florl C. Transfusion. 2007;47:1125–1133. doi: 10.1111/j.1537-2995.2007.01247.x. [DOI] [PubMed] [Google Scholar]
- 15.Hossain MS, Roback JD, Wang F, Waller EK. J Immunol. 2008;180:6892–6902. doi: 10.4049/jimmunol.180.10.6892. [DOI] [PubMed] [Google Scholar]
- 16.Osselaer JC, Cazenave JP, Lambermont M, Garraud O, Hidajat M, Barbolla L, Tardivel R, Defoin L, Waller C, Mendel I, Raidot JP, Kandel G, De Meuter R, Fabrigli P, Dehenau D, Arroyo JL, Padron F, Gouezec H, Corral M, Jacquet M, Sundin D, Lin L, Corash L. Vox Sang. 2008;94:315–323. doi: 10.1111/j.1423-0410.2007.01035.x. [DOI] [PubMed] [Google Scholar]
- 17.Fujiwara Y. Measurement of interstrand cross-links produced by mitomycin C. Marcel Dekker; New York: 1983. [Google Scholar]
- 18.Kohn KW, Ewtg RGA, Ere LC, Zwelling LA. DNA Repair. 1981:379–401. [Google Scholar]
- 19.McKenna DJ, Gallus M, McKeown SR, Downes CS, McKelvey-Martin VJ. DNA Repair. 2003;2:879–890. doi: 10.1016/s1568-7864(03)00086-7. [DOI] [PubMed] [Google Scholar]
- 20.Hartley JA, Souhami RL, Berardini MD. J Chromatogr. 1993;618:277–288. doi: 10.1016/0378-4347(93)80038-6. [DOI] [PubMed] [Google Scholar]
- 21.Cao H, Hearst JE, Corash L, Wang Y. Anal Chem. 2008;80:2932–2938. doi: 10.1021/ac7023969. [DOI] [PMC free article] [PubMed] [Google Scholar]
- 22.Ping YH, Rana TM. Biochemistry. 2005;44:2501–2509. doi: 10.1021/bi0488707. [DOI] [PubMed] [Google Scholar]
- 23.McLuckey SA, Berkel GJV, Glish GL. J Am Soc Mass Spectr. 1992;3:60–70. doi: 10.1016/1044-0305(92)85019-G. [DOI] [PubMed] [Google Scholar]
- 24.Vigny P, Gaboriau F, Voituriez L, Cadet J. Biochimie. 1985;67:317–325. doi: 10.1016/s0300-9084(85)80074-2. [DOI] [PubMed] [Google Scholar]
- 25.Cadet J, Voituriez L, Ulrich J, Joshi PC, Wang SY. Photobiochem Photobiophys. 1984;8:35–49. [Google Scholar]
- 26.Wang Y, Wang Y. Anal Chem. 2003;75:6306–6313. doi: 10.1021/ac034683n. [DOI] [PubMed] [Google Scholar]
- 27.Grass JA, Hei DJ, Metchette K, Cimino GD, Wiesehahn GP, Corash L, Lin L. Blood. 1998;91:2180–2188. [PubMed] [Google Scholar]
- 28.Dronkert ML, Kanaar R. Mutat Res. 2001;486:217–247. doi: 10.1016/s0921-8777(01)00092-1. [DOI] [PubMed] [Google Scholar]
Associated Data
This section collects any data citations, data availability statements, or supplementary materials included in this article.
Supplementary Materials
HPLC traces for the separation of MA-containing ODNs, UV absorption spectra, calibration curves for the quantifications, MS and LC-MS results. This material is available free of charge via the Internet at http://pubs.acs.org.