

Abstract
Complex natural polysaccharides, glycosaminoglycans (GAGs), are a class of ubiquitous macromolecules that exhibit a wide range of biological functions and participate and regulate multiple cellular events and (patho)physiological processes. They are generally present either as free chains (hyaluronic acid and bacterial acidic polysaccharides) or as side chains of proteoglycans (PGs; chondroitin/dermatan sulfate, heparin/heparan sulfate, and keratan sulfate) and are most often found in cell membranes and in the extracellular matrix. The recent emergence of modern analytical tools for their study has produced a virtual explosion in the field of glycomics. CE, due to its high resolving power and sensitivity, has been useful in the analysis of intact GAGs and GAG-derived oligosaccharides and disaccharides affording concentration and structural characterization data essential for understanding the biological functions of GAGs. In this review, novel off-line and on-line CE-MS and MS/MS methods for screening of GAG-derived oligosaccharides and disaccharides will be discussed.
Keywords: Capillary electrophoresis, Chondroitin sulfate, Dermatan sulfate, Glycosaminoglycans, Heparin
1 Introduction
Glycosaminoglycans (GAGs) are linear, complex, polydisperse polysaccharides formed from disaccharide repeating units of glucuronic acid (GlcA) or iduronic acid (IdoA) residue (in keratan sulfate (KS) the uronic acid residue is replaced by galactose) linked to a glucosamine (GlcN) or galactosamine (GalN) residue (see Fig. 1) [1-5]. With the exception of hyaluronic acid (HA), GAGs are sulfated macromolecules with different degrees of charge density due to varying numbers sulfo groups linked to the polysaccharide backbone at different positions. Sulfated GAGs are often heterogeneous polysaccharides in terms of relative molecular mass, charge density, chemical properties, biological and pharmacological activities [1-5]. There are four classes of GAGs based on carbohydrate backbone structure: (i) HA, (ii) KS, (iii) chondroitin sulfate (CS)/dermatan sulfate (DS), and (iv) heparan sulfate (HS)/heparin (Hep). With the exception of HA, which contains an unmodified N-acetylglucosamine (GlcNAc)-GlcA repeating unit, all other classes can be modified through (i) the addition of O-sulfo groups on various hydroxyl groups (KS, CS, DS, HS, Hep), (ii) C5-epimerization of selected GlcA residues to form IdoA residues (DS, HS, Hep), and (iii) de-N-acetylation of selected GlcNAc to form GlcN residues that can be then substituted with N-sulfo groups (HS and Hep). These modifications introduce microheterogeneity within GAG chains and often play a major role in a wide variety of biological and pharmacological processes [1-5].
Figure 1.
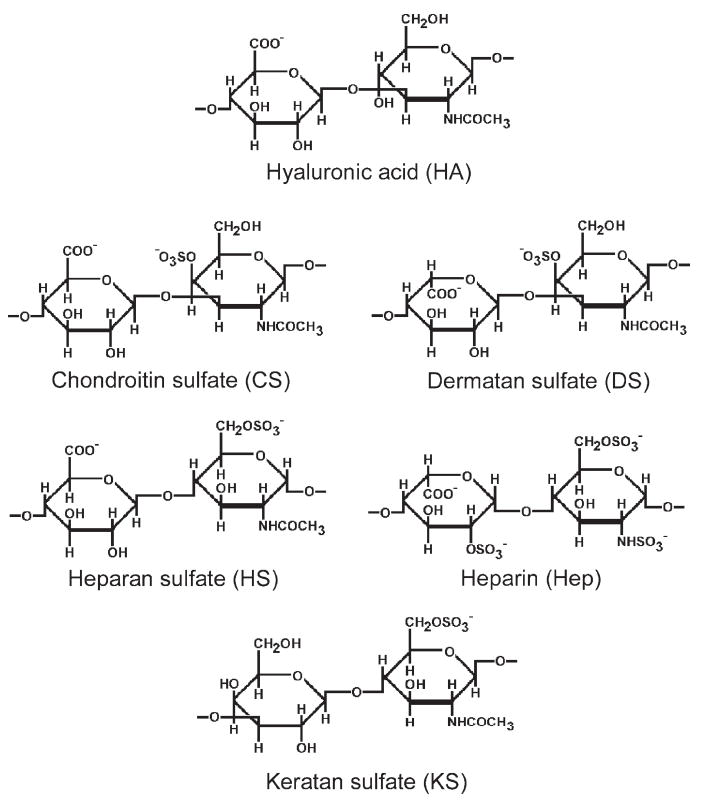
Structures of disaccharides forming GAGs. Major modifications for each structure are illustrated but minor variations are possible.
With the exception of HA, GAG chains from animal sources are covalently attached at their reducing end through an O-glycosidic linkage to a serine residue or N-linked to asparagine (in some forms of KS) in a core protein to generate macromolecules termed proteoglycans (PGs) [6-10]. They are localized at cellular (intracellular granula and membrane-associated PGs) and extracellular levels where they play structural and regulatory roles due to their interaction with several proteins [11].
Evidence obtained from recent glycobiology studies in the fields of biochemistry, cell and developmental biology suggests that PGs are not only structural components, but they participate in many cellular events and physiological processes, such as cell proliferation and differentiation, cell–cell and cell–matrix interactions [5, 12-14] and are implicated in regulatory functions of development, angiogenesis, axonal growth, cancer progression, microbial pathogenesis, and anticoagulation [1, 2, 5, 12-15]. An emerging paradigm in the modulation of biological function is the specific interactions between GAGs and numerous proteins [1, 13-16] and their capacity to be interactive at molecular and cellular level is due to their great structural diversity. This structural diversity is encompassed by GAG type, size, composition and charge density, degree of substitution, domain arrangement, and sequence. As a consequence, these heteropolyacids are macromolecules of great importance in the fields of biochemistry, pathology, and pharmacology.
Most GAGs are derived from animal sources by extraction processes to produce purified drugs and active macromolecules for use in multiple therapeutic applications [17-22]. Furthermore, these natural substances have been chemically and enzymatically modified, and synthetic analogues have been developed [13, 14]. Currently, GAG-based drugs include natural or partially depolymerized HA, Hep, DS, and CS, and mixtures of these polysaccharides. Hep and Hep derivatives are primarily utilized as clinical anticoagulants [23]. In addition, these GAGs have been incorporated into medical devices to enhance their hemocompatibility [24]. Hep derivatives nearly devoid of anticoagulant action, with a reduced number of N-sulfo and larger numbers of N-acetyl groups that more closely resemble the structure of HS, are also utilized for pharmaceutical purposes. Source material, manufacturing processes, derivatization procedures, the presence of contaminants, and many other factors can contribute to the overall biological and pharmacological profiles of these agents.
Several analytical approaches (for reviews see [25-33]) have been developed to evaluate the source species, quantity, and structure of GAGs purified from various organs, tissues and cells, and biological fluids, and to identify modifications due to pathological conditions. Furthermore, sensitive, specific, and routine quality control analytical approaches are essential considering the application of these natural polysaccharides as biomarkers for predicting disease severity and in monitoring therapies and drug treatment. Analytical techniques are also of paramount importance for evaluating the purity of a single GAG species (or in mixtures) used in therapy (Hep and DS as anticoagulant and antithrombotic drugs, CS as a chondroprotective agent, and HA as an adjunct in eye surgery) and carefully to determine their structural properties responsible for biological and pharmacological effects.
Determining the structural properties of GAGs and GAG-derived oligosaccharides represents a major methodological challenge because of sample complexity. In the case of polysaccharides or oligosaccharides isolated from biological samples, structural analysis must often be performed with limited amounts of heterogenous analyte in the presence of a background of complex biological contaminants. As a consequence, many efforts have been made to develop improved methods for GAG analysis. CE has proved to be a very attractive alternative separation technique for GAGs and GAG-derived oligosaccharides as their high negative charge assures excellent resolving power even in the presence of other contaminating biological molecules. CE also offers many advantages over a variety of other analytical methods, including an extremely high separation efficiency, simple operation, short analysis time, automated and reproducible analysis, very low consumption of samples and buffers, and on-line direct coupling with ESI-MS for specific structural evaluation [34, 35]. This review is intended to provide an overview of various separation approaches and detection methods relying on CE to evaluate several aspects of research in GAGs and GAG-derived oligosaccharides, such as their importance in biological and pharmaceutical samples, in disease diagnosis, glycobiology and carbohydrate biochemistry, and chemical synthesis.
2 General considerations of GAG analysis
Isolation and purification of GAGs from biological samples can be achieved by many different approaches. These include solubilizing the tissue with proteolytic enzymes, fractionating the mixture by either ion-exchange chromatography and/ or gel-filtration columns and/or sequential precipitation by organic solvents [28-31]. Currently, GAGs may be isolated from a number of biological sources, tissues, cells, fluids either from PGs extracted with solutions containing chaotropic reagents and detergents or from direct protease digests of sample. These isolated macromolecules are generally quantified by using dye binding assays or colorimetric reactions and further characterized by chemical analysis, and analytical and semipreparative approaches.
Based on the information desired, CE analysis is performed by using either intact or GAGs that are chemically or enzymatically degraded into oligosaccharides. Analysis of intact polysaccharides may give information on the amount, charge density, molecular mass, and polydispersity of GAG chains [36, 37]. This approach has also been applied to evaluate the purity of isolated GAG species and in pharmaceutical preparations. However, GAG structure is traditionally studied by controlled degradation of the chains using specific enzymes and/or chemical treatments and analysis of the produced disaccharides or oligosaccharides [38-41]. After treatment with specific enzymes, the products are subsequently either directly separated using CE or derivatized and separated using CE and then subjected to detection and quantification (Figs. 2A–D). The enzymes that are mainly used for the degradation of the GAGs belong to the family of polysaccharide lyases acting on the β(1→4) glycosidic linkage between hexosamine and uronic acid residues producing disaccharides and oligosaccharides possessing a double bond between C-4 and C-5 of the uronic acid [38-41]. This unsaturated uronic acid strongly absorbs UV light at 232 nm (ε = 5500 M−1 cm−1) and this wavelength is used for the quantification of the products. A combination of polysaccharide lyases having different specificities can also be used for the characterization of GAGs from biological samples. If correctly chosen, such a combination of polysaccharide lyases can ensure the nearly complete breakdown of GAGs to disaccharide products for subsequent disaccharide compositional analysis (Figs. 2A and B). Exhaustive digestion of Hep can leave intact tetrasaccharides that on CE analysis reveals the presence of 3-O-sulfo groups arising form Hep’s antithrombin III binding site [42]. Apart from the various lyases, some hydrolases, such as hyaluronidase can be used for the controlled degradation of GAGs [43, 44] and further purification and/or characterization of oligosaccharides. Finally, CE has been extensively applied in immunoassays for the evaluation of binding parameters in molecular reactions involving polysaccharides, oligosaccharides, and derivatives [45].
Figure 2.
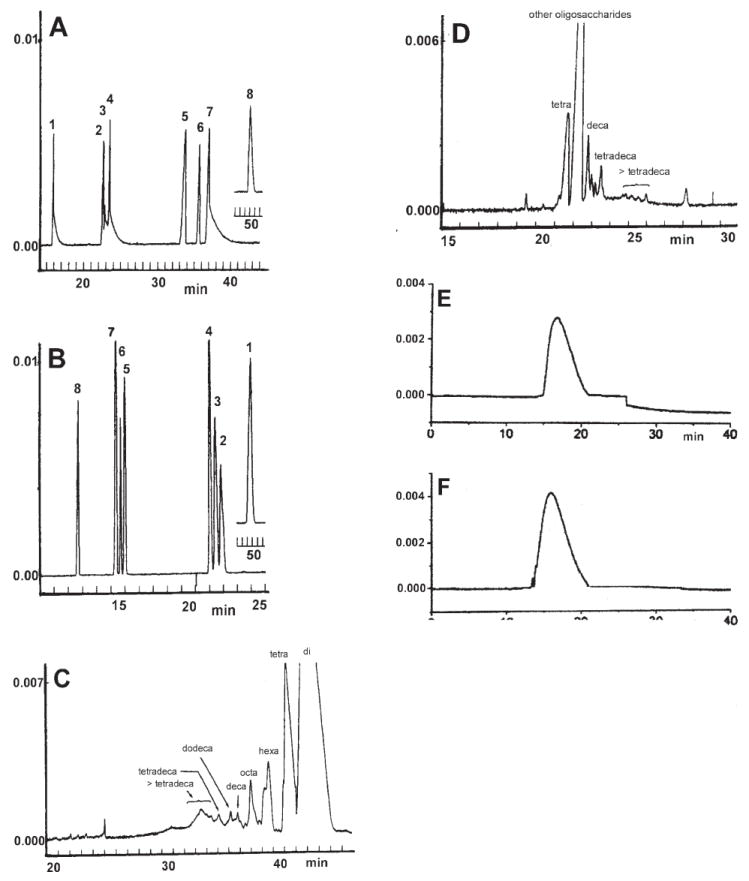
Electropherograms of (A) eight heparin-disaccharides 1–8 (1 is unsulfated and 8 is trisulfated, see ref. [76] for structures) using normal polarity in 10 mM sodium borate buffer and 50 mM SDS (SB-SDSB), pH 8.8, 12 kV. (B) Eight Hep-disaccharides 1–8 using reversed polarity in 20 mM sodium phosphate buffer pH 3.48 (SPB) at 12 kV. (C) Hep-oligosaccharides prepared by partial Hep lyase I digest (30% complete) of Hep using normal polarity at 12 kV. (D) Hep-oligosaccharides prepared by partial Hep lyase I digest (30% complete) of Hep using reversed polarity at 12 kV. (E) Hep using reversed polarity at 20 kV. (F) Low-molecular-weight Hep (MW 4800, RD heparin, Wyeth) using reversed polarity at 20 kV. (A) and (C) were in 10 mM sodium borate buffer and 50 mM SDS, (B) and (D) were in 20 mM sodium phosphate buffer pH 3.48, (E) and (F) were in 5 mM copper(II) sulfate. (A–D) were detected at 232 nm [76] and (E) and (F) were detected at 240 nm [55] (modified from ref. [76, 55]).
3 General considerations of CE GAG analysis
The success of CE is largely attributable to the overall miniaturization involved and the ability to use small amount of samples [34] for sensitive detection. GAGs, like most glycans and glycoconjugates [26], do not possess strong chromophores on their structures and have low extinction coefficients, making them difficult to measure by direct UV detection [34]. However, as previously indicated, the GAG-derived disaccharides and oligosaccharides produced by the action of polysaccharide lyases show characteristic absorbance at micromolar concentrations due to the unsaturated uronic acid introduced into the nonreducing termini of these molecules [24, 25]. A disadvantage of using this unsaturated uronic acid for detection is that the sensitivity of detection depends on the oligosaccharide molecular mass. This limits the detection of GAG-derived oligosaccharides to the femtomole range when using commercially available absorbance detectors. Furthermore, these UV wavelengths limit the selection of buffer and additives and trace impurities can often interfere with the analysis [26, 29].
CE with indirect UV detection has also been applied to overcome the difficulty related to the analysis of oligosaccharides and polysaccharides lacking of chromophores in their structures [26, 29]. The detection is based on the displacement of the chromophore in the BGE by the analyte molecule, resulting in negative peaks. A carrier electrolyte anion, possessing a high molar absorptivity and an effective electrophoretic mobility close to those of the analyte, is necessary to assure adequate detection limits. Indirect UV detection has been applied to GAGs using buffers with pH optimization for baseline resolution of peaks giving effective increase in sensitivity in comparison with direct UV method [26].
Derivatization of oligosaccharides and polysaccharides provides a useful method for sensitive detection by fluorescence and/or UV, and can also improve resolution of separation through the introduction of additional charge [29, 46]. The most frequent method for the derivatization of carbohydrates is reductive amination of the aldehyde group at the reducing end of sugar by the amino group of labeling reagent, employing sodium cyanoborohydride as reducing agent. Labeling reagents include 2-aminopyridine (2-AP), 2-aminoacridone (AMAC), biotin aminopyridine (BAP), p-aminobenzoic acid, 2-aminobenzamide, 4-aminobenzonitrile, 8-amino-naphthalene-l,3,6-trisulfonic acid (ANTS), l-phenyl-3-methyl-5-pyrazolone (PMP), 1-(4-methoxy)phenyl-3-methyl-5-pyrazolone (PMPMP), 6-aminoquino-line (6-AQ), l-maltohepaosyl-l,5-diaminonaphthalene, and 8-aminopyrene-1,3,6-trisulfonate (APTS) [29]. UV, conventional fluorescence and/or LIF may be used for detection depending on the properties of the derivatives obtained.
The highly complex nature of GAGs and GAG-derived oligosaccharide mixtures, obtained by enzymatic digestion (Figs. 2C and D), can make specific analysis a challenge. For the rapid determination of complex mixtures of GAG-oligosaccharides from digests, without the further derivatization step, analytical separation is usually required with specific detection by means of MS. UV/fluorescence detection provide only limited structural information when there are oligosaccharide standards available to enable a proper assignment based on CE migration times. As a consequence, CE interfaced with detection systems such as MS, capable of providing structural information, represents key tools in GAG analysis. CE-ESI-MS began with the development of new volatile buffer systems for CE separation of GAGs and GAG-derived oligosaccharides [47]. On-line CE-MS has been performed using ESI-MS, continuous-low fast atom bombardment (FAB)-MS, and TOF-MS [48]. Negative ion ESI appears to be an ideal source for CE due to its mild desolvation process that produces mainly molecular ion species of compounds having low molecular mass, thus facilitating the MS analysis of GAG-derived disaccharides and oligosaccharides [49-53]. TOF-MS has been applied as a detector for fast CE providing excellent detection in the very low femtomole/ attomole range [48]. MS detection offers improved sensitivity compared to CE utilizing UV or fluorescence detection and also provides a second high-resolution dimension important for analyzing oligosaccharides that differ subtly in their structure. The additional structural data afforded using MS detection can confirm the structures of species in a complex mixture making the precise measurement migration time less essential than when CE relies on other detection methods. The presence of native ionizable groups makes GAGs and GAG-derived oligosaccharides particularly suitable for both separation by CE and analysis by MS, without the need for derivatization.
4 CE analysis of HA
The HA GAG can be separated by CE in a fused-silica capillary as a single peak under normal polarity in phosphate–borate buffer pH 9.0 in the presence of SDS [36] (Fig. 3A). HA samples having different molecular mass have been determined using reversed polarity in a fused-silica capillary using a slightly acidic buffer (pH 4.0) [54]. Determination of natural HA as well as other GAGs is also possible utilizing copper complexes by means of reversed-polarity CE [55] (Figs. 2E and F).
Figure 3.
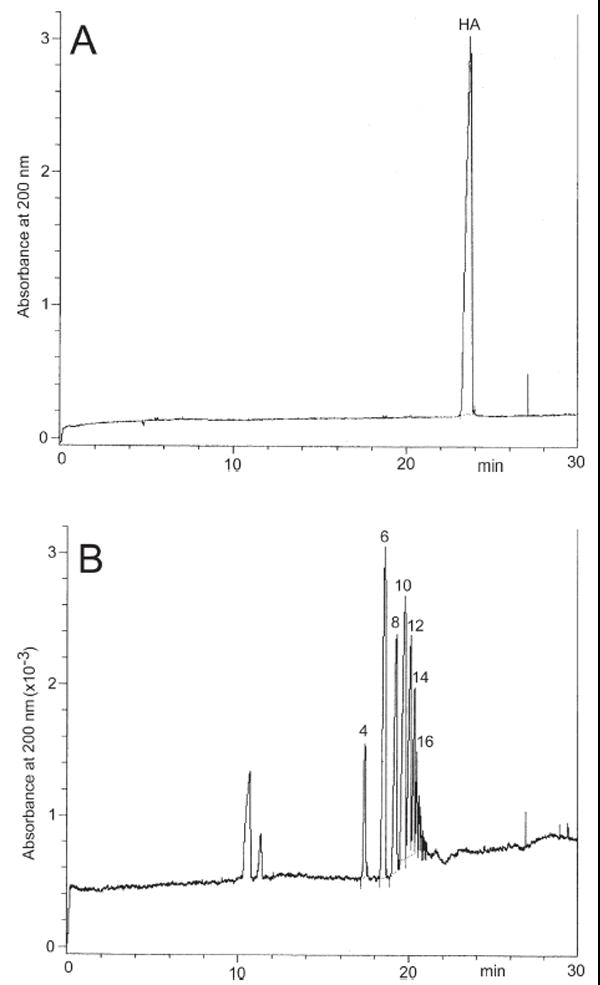
Electropherograms of (A) intact HA and (B) HA treated with hyaluronidase. CE was performed on a Beckman HPCE instrument (P/ACE system 5000) equipped with a UV detector set at 200 nm. Separation and analysis by EKC with SDS were carried out on an uncoated fused-silica capillary tube (50 μm id, 85 cm total length and 65 cm from the injection point to the detector) at 25°C. The operating buffer was constituted of disodium hydrogen phosphate (40 mM), sodium tetraborate (10 mM), and SDS (40 mM) buffered at pH 9.0. HA oligomers given above the peaks.
HA-derived oligosaccharides produced through the action of polysaccharide lyases can be separated in a sodium phosphate–borate buffer pH 9.0 with direct UV detection [36, 54] and also in sodium phosphate–borate buffer in the presence of SDS [56] (Fig. 3B).
HA samples of different molecular mass have been determined by CE in a fused-silica capillary using a slightly acidic buffer at pH 4.0 [54] and also in acidic phosphate buffer pH 3.0 under reversed-polarity using UV 232 nm with a detection limit at the attomole level [57]. HA-derived oligosaccharides have been separated by CE in borate buffer in the presence of tetrabutylammonium phosphate [58]. HA oligosaccharides have also been separated in a capillary filled with polyacrylamide gel at high [59, 60] and very high [61] voltages, and or by using a combination of a chemically modified capillary and a buffer containing PEG 70000 [62].
HA-derived oligosaccharides obtained by treatment with Streptomyces hyaluronate lyase have been labeled by reductive amination with AGA and separated using CE to determine the action pattern of the enzyme [63]. The unsaturated disaccharide produced by chondroitin ABC lyase has been separated by CE and quantified by UV without any derivatization [64] and HA plasma has been analyzed, following derivatization with AMAC, using LIF detection [65]. In addition to the above-mentioned applications of HA analysis, CE has been used for quantitative HA analysis in vitreous humor [66], in pharmaceutical formulations [67, 68], and to determine hyaluronate lyase activity in bee and snake venom [69].
On-line CE/ESI-MS was investigated by Kühn et al. [70] as a method for the mass characterization of HA oligosaccharides obtained following enzymatic digestion with bacterial hyaluronate lyase (E.C. 4.2.2.1 from Streptococcus agalactiae). A fused-silica capillary coated with polyacrylamide was used in this analysis. Separation was achieved for oligosaccharides containing 4–16 monomers and the migration behavior follows the chain length of the oligomers, regardless of charge state. However, no linear relationship was found between mobility and chain length. Using an IT mass analyzer, complementary structural information was obtained by MS/MS and MSn experiments.
5 CE analysis of CS/DS
CE separation of intact CS and DS has been performed by using reverse polarity with a buffer of pH 3.0 at 240 nm based on the formation of a copper(II) complex [55]. Long-chain CS-oligosaccharides have been separated based on their DP by Grimshaw [26] by using a capillary filled with polyacrylamide gel.
The first CE separations of CS/DS disaccharides were published in 1991 [56, 71] and performed using a normal polarity in a basic borate buffer with UV detection at 232 nm. The CS/DS unsaturated disaccharides separation was further improved using phosphate/borate buffer containing SDS [56, 72]. The addition of triethylamine [73] or tetrabutylammonium phosphate [58] to an alkaline buffer also was found to improve the separation of CS/DS disaccharides through an ion-pairing effect. Furthermore, the addition of CTAB to a phosphate/borate buffer was very effective for separation of variously sulfated disaccharides by means of micellar electrokinetic capillary chromatography (MECC) [74]. Finally, the determination of total amount of CS was performed by its conversion of sulfated CS-disaccharides to desulfated CS-disaccharide via an enzyme-catalyzed reaction using an in-capillary enzyme reaction [75].
CS/DS disaccharides can also be separated under reverse polarity by using an acidic phosphate buffer at pH 3.0–3.5 [75]. Furthermore, CS/DS oligosaccharides, tetra-, hexa-, and higher saccharides, have been well separated under reversed-polarity conditions [76]. Reverse polarity CE has also been used to analyze CS from purified PGs [77] and PGs extracted from connective tissues [78, 79].
CS/DS unsaturated disaccharides have also been derivatized at their reducing end with AMAC [80, 81] or at their carboxylic acid group with 7-aminonaphthalene-1,3-disulfonic acid (ANDSA) [82] and separated by using acidic buffer and LIF detection with a 100-fold increase in sensitivity compared to UV detection. Furthermore, CS-derived disaccharides may be labeled with PMP and separated in borate buffer under normal polarity [83].
CE performed in a capillary having the inner surface chemically modified with dimethylpolysiloxane and by using 100 mM Tris–borate buffer pH 8.0 containing 1–10% PEG (PEG70000, average molecular mass 70 000) was used to separate the CS unsaturated disaccharides produced by chondroitinase ABC and labeled with AMAC and CS-protein linkage region in PGs after labeling the reducing ends of the released oligosaccharides with 2-aminobenzoic acid [84]. Under these experimental conditions, CE was demonstrated to be a useful technique for the analysis of oligosaccharides in the PG linkage region.
A CE and negative ESI-quadrupole TOF-MS/MS (QTOF-MS/MS) analysis has been developed to obtain data about the domain structure of CS/DS [85, 86]. The CS/DS oligosaccharide mixtures from bovine aorta treated with chondroitin B lyase were analyzed in 50 mM ammonium acetate in aqueous methanol. Oligosaccharides differing in chain length and degree of sulfation were detected. Two CE collected fractions subjected to nano-ESI-QTOF-MS analysis in the negative-ion mode, produced data for 12 major GAG components appearing as multiply charged ions (Fig. 4). The first CE fraction contained hexasaccharide, octasaccharide, and decasaccharide bearing one sulfo group per disaccharide unit, an undersulfated octasaccharide with three sulfo groups as well as an oversulfated hexasaccharide species carrying five sulfo groups. The second fraction was characterized by oligosaccharides of lower molecular mass as well as oligomers having the same chain length as those in the first fraction but with a lower charge density. Furthermore, MS2 fragmentation allowed the production of low molecular mass ions useful for fine structural characterization. A subsequent study [53, 87], performed using offline CE in combination with nano-ESI-QTOF-MS/MS in the negative-ion mode, identified the biologically active sequence of CS/DS chains from decorin secreted by human skin fibroblasts able to interact with fibroblast growth factor-2 (FGF-2). A novel approach in CS/DS oligosaccharide characterization was developed by the same group [88] based on on-line CE/nano-ESI-QTOF-MS and MS/MS. This methodology required the development of a new sheathless CE/nano-ESI-QTOF-MS configuration for the high sensitivity analysis of CS/DS oligosaccharide mixtures. Under these new analytical conditions, single CS/DS oligosaccharide components of extended chain length and increased sulfation degree were identified. The optimized on-line conditions enabled the detection of molecular-ions assigned to oversulfated tetradecasaccharide, octadecasaccharide, and eicosasaccharide CS/DS molecules. Furthermore, the oversulfated species could be sequenced to determine the positions of the additional sulfo groups within the oligosaccharide chains.
Figure 4.
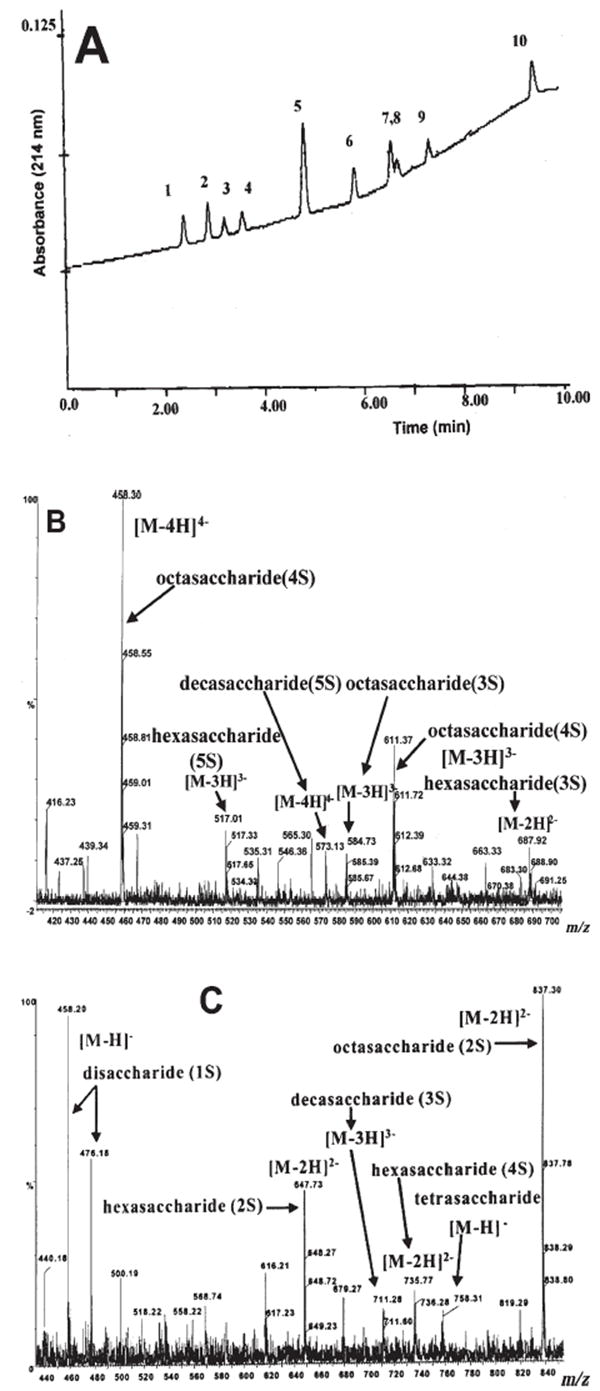
(A) CE/UV at 214 nm profile of the CS/DS oligosaccharide mixture from bovine aorta after treatment with chondroitinase B separated by means of 50 mM ammonium acetate/ ammonia, pH 12.0, at 25 kV. (B) Negative ion mode nano-ESI-QTOF-MS of the CE fraction collected within the first 5 min after injection (see (A)). (C) Negative-ion mode nano-ESI-QTOF-MS of the CE fraction collected between 6 and 10 min after sample injection (see (A)) (modified from ref. [85, 86]).
6 CE analysis of HS/Hep and derivatives
Hep has been separated by reversed polarity CE in a migration buffer of pH 6.0 using a capillary coated with polyacrylamide to produce a broad peak [89]. As demonstrated for intact CS/DS [55], reversed-polarity CE in the presence of copper(II) was effective in the separation of the native Hep, low-molecular-mass (LMW)-Hep and HS in a pH 3.0 buffer. Intact Hep was also analyzed by using acidic buffer and short end injection configuration [90] or CZE separation [91]. The CE analyses of various synthetic Heps and Hep-oligosaccharides have been achieved in low-pH buffer with direct [92] or indirect [93-95] UV detection. CE separation of 17 defined Hep-derived oligosaccharides has been obtained by using 10 mM sodium borate and 50 mM SDS under normal polarity [96].
LMW-Hep has also been separated by CE after labeling with l-maltoheptaosyl-l,5-diaminonaphthalene [97] and LIF detection. Hep/HS disaccharides have also been separated by normal polarity CE in a pH 8.8 borate buffer in the absence [72] and presence of triethylamine [73], and by reversed-polarity using acidic buffer and direct [76, 92, 98, 99] or indirect [94] UV detection. Fluorescence labeling of saturated [90] and unsaturated [90, 100] Hep/ HS disaccharides was performed with AMAC enabling their CE separation and high-sensitivity detection with LIF.
A novel analytical methodology based on MALDI-MS and CE was developed to follow the time course of the enzymatic degradation of Hep-like GAGs through the intermediate stages to the end products [101, 102]. MS allowed the determination of the molecular weights of the sulfated carbohydrate intermediates and their approximate relative abundances at different time points of the experiment. CE subsequently was used to follow more accurately the abundance of the components and to measure sulfated disaccharides. The methodology described was useful to sequence complex GAGs and to evaluate enzyme activity.
Hep disaccharides and oligosaccharides were analyzed by CE coupled on-line with MS by Duteil et al. [103] both in positive and negative ionization modes as well as by normal and reversed polarity. Normal polarity CE allowed shorter analysis times producing low resolution between isomeric disaccharides but these could be identified by using MS as detector. As a consequence, on-line CE coupled with negative MS ionization was applied for the analysis of complex Hep oligomers mixtures. A pressure-assisted CE-IT MS method was developed for the analysis of eight Hep-derived disaccharides [104] and MS/MS fragmentation allowed qualitative and quantitative identification of the co-eluting disaccharides. This analytical approach was applied to the characterization of enzymatically depolymerized Heps and the characteristic relative molar percentages of major and minor disaccharides were calculated.
A methodology able to incorporate distinct linkage information between adjacent Hep monosaccharides obtained from NMR and CE data using a property encoded nomenclature (PEN) computational framework facilitating a rapid and unbiased procedure for sequencing oligosaccharides was developed by Guerrini et al. [105]. The integration of NMR and CE data set with the help of the PEN framework was demonstrated to dramatically reduce the number of experimental constraints required to arrive to an Hep/HS oligosaccharide sequence.
A method for the separation of Hep oligosaccharides to study the interactions with granulocyte-colony stimulating factor (G-CSF) has been developed by using CE and MS [106]. Hep was degraded to oligosaccharides by an endolytic heparinase and the resulting smaller oligosaccharides (Mr<1000) and larger oligosaccharides (1000<Mr<8000) were all separated by CE. The oligosaccharides were also identified and molecular mass was deduced by ESI-MS. Under the above separation conditions, interactions between G-CSF and the oligosaccharides were studied by using CZE.
Finally, CE has been applied to the fine characterization of the structure of acharan sulfate, an unusual GAG isolated from Achatina fulica that is structurally related to both Hep/HS [107]. Oligosaccharides from decasaccharide to hexadecasaccharide were enzymatically prepared and CE was used to confirm the purity of these oligosaccharides [108].
7 Capillary affinity chromatography to study GAG–protein interactions
The interaction of Hep and other GAGs with Hep-binding proteins can also be studied using CE. In early studies, GAGs such as Hep were immobilized to the inner wall of a fused-silica capillary to separate Hep-binding peptides [109, 110]. Heegaard and co-workers [111, 112] used solution-phase Hep in affinity CE experiments to assess the binding of amyloid P protein to Hep (Fig. 5). Dubin and co-workers [113] have recently applied affinity CE to evaluate the role of electrostatic binding in the interaction of antithrombin with Hep. CE of Hep yielded electropherograms revealing the enormous heterogeneity but the distribution was somewhat reduced after antithrombin affinity chromatography, which demonstrated that the high-affinity fraction was generally depleted of the lower-charge species, results that were confirmed by ESI-MS analysis.
Figure 5.
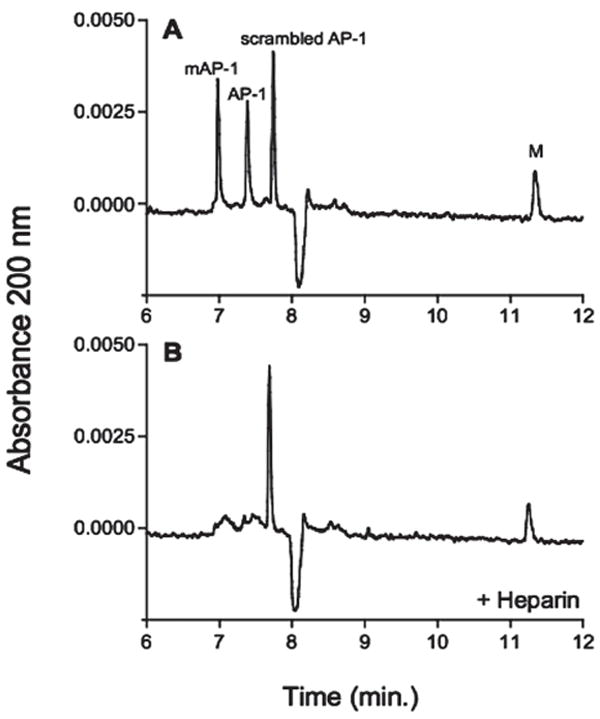
Hep-binding specificity of synthetic amyloid P component (AP)-1 peptides in CE. A 1:1 mixture of AP-1 peptide (peptide representing residues 27–38 of AP) and the scrambled AP-1 peptide (both 0.5 mg/mL in water) were analyzed by CE in the absence (A) Hep-binding specificity of synthetic amyloid P component (AP)-1 peptides in CE. A 1:1 mixture of AP-1 peptide (peptide representing residues 27–38 of AP) and the scrambled AP-1 peptide (both 0.5 mg/mL in water) were analyzed by CE in the absence (A) or presence (B) of 1 mg/mL LMW-Hep in the electrophoresis buffer. The AP-1 peptide preparation contained both the expected peptide and a variant (mAP-1), which was found by MS to be modified with respect to the two N-terminal amino acid residues. The peak labeled as M corresponds to the marker peptide (modified from ref. [111]).
8 CE analysis of bacterial polysaccharides
The uropathogenic Escherichia coli K4 bacteria synthesizes a capsular polysaccharide with a carbohydrate backbone identical to chondroitin, consisting of [GlcA (β1→3) N-acetylgalactosamine (GalNAc) (β1→4)]n backbone, to which β-fructofuranose units are linked to C-3 of GlcA residues. A rapid, highly sensitive and reproducible CE method (MECC with SDS) has been developed for the determination of disaccharides present in this polysaccharide and its defructosylated product [114]. Following chondroitin ABC lyase digestion of K4 polysaccharide and its derivative, the two products ΔHexA(Frc)-GalNAc and ΔHexA-GalNAc, were separated and determined within 20 min using normal polarity and detection at 230 nm (Fig. 6A). However, this analytical approach first requires treatment of the bacterial polysaccharide with polysaccharide lyases to produce unsaturated oligosaccharide products. A direct CE separation using normal polarity of native K4 and K4d polysaccharides has also been developed [115]. The two polyanions, separated and determined within 30 min at 200 nm (Fig. 6B), showed a linear concentration response over a wide range, from approximately 30 to 210 ng.
Figure 6.
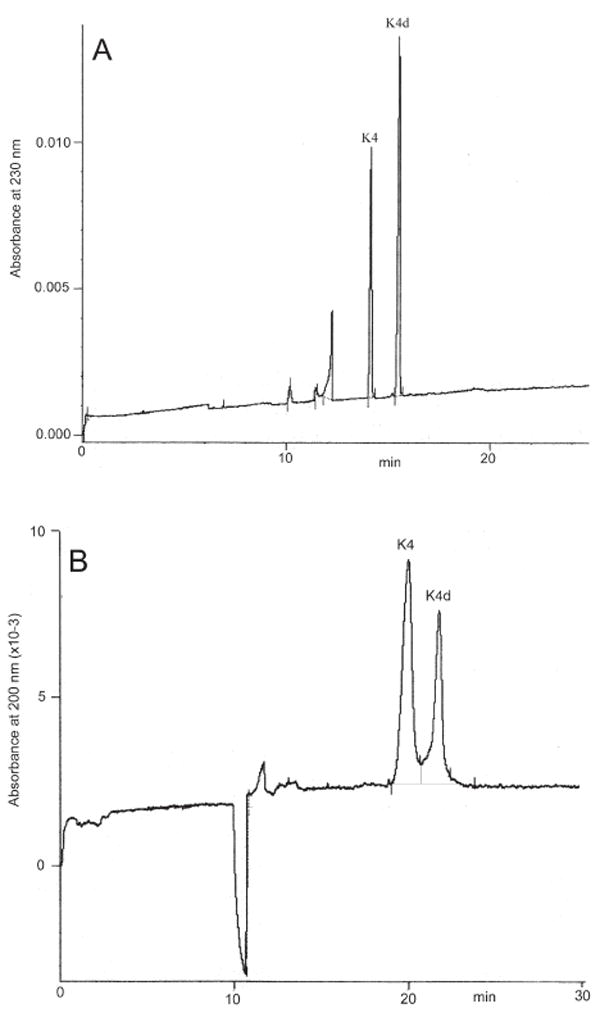
(A) Electropherogram of unsaturated disaccharides ΔHexAFrc-GalNAc from the polysaccharide K4 (K4) and ΔHexA-GalNAc of defructosylated K4 product (K4d) (reprinted with permission from ref. [114]). (B) Electropherogram of the polysaccharide K4 (K4) and of the defructosylated K4 polysaccharide (K4d) (reprinted with permission from ref. [115]).
CE was also applied for the determination of another bacteria polysaccharide produced by the uropathogenic E. coli K5 [116]. This natural polysaccharide having the structure of a desulfo-HS composed of [GlcA(β1→4)GlcNAc α1→4)]n was separated and qualitatively and quantitatively determined within 20 min using normal polarity and detection at 200 nm (Fig. 7A). CE was also able to separate several molecular species mainly due to the presence of polysaccharides of distinct and increasing mean chain lengths (Fig. 7B). A linear relationship was found between migration time and log molecular mass for different K5 polysaccharide species, and this relationship was used to calculate the molecular mass of the main K5 species.
Figure 7.
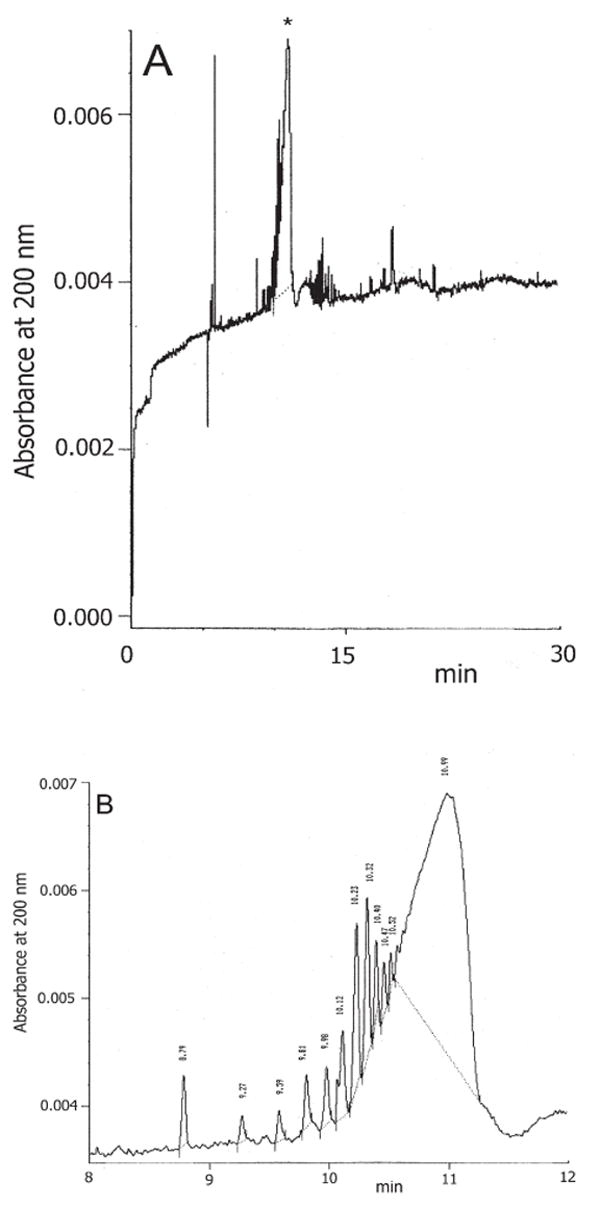
(A) CE electropherogram of the purified E. coli K5 polysaccharide. The asterisk indicates the K5 species at a migration time of approx. 11.00 min. (B) Electropherogram of the K5 polymer as in Fig. 4A expanded in the region from 8.00 to 12.00 min. The K5 polysaccharide species with a migration time of 8.79 min corresponds to a decasaccharide (reprinted with permission from ref. [116]).
9 Conclusions
This review has presented an overview of selected CE applications for the analysis of complex natural polysaccharides and their derivatives. The majority of the reported CE applications involve underivatized GAGs and GAG-derived disaccharides and oligosaccharides. The separative power of CE reduces pretreatment steps making it useful for a variety of applications; in quality control in pharmaceutical industry, in disease diagnosis, in glycobiology, in carbohydrate biochemistry, and in the chemical synthesis of oligosaccharides. The informative capacity of on-line and off-line CE-MS (and MSn), allows the assessment of the identity of partially unresolved peaks, making this mode of detection particularly advantageous.
Improvements in CE separation and sensitivity have been achieved by derivatization with suitable charged tags having fluorescence properties. Furthermore, derivatization can aid peak assignment during MSn experiments, providing additional information on the structure of the saccharides under investigation. However, CE-MS has some limitations in analysis of complex natural polysaccharides. First, CE, while generally requiring small amounts of samples, requires sample in high concentrations that are often difficult to obtain from biological samples. Second, CE-MS interfaces are not as well developed as the LC-MS interface, and they are available from a limited number of commercial equipment suppliers and often offering poor sensitivity. Third, MS often offers some limitations in the analysis of charged carbohydrates compared to other biopolymers. In fact, sulfate esters in GAGs are particularly labile resulting in extensive fragmentation making the detection of molecular ions difficult and the presents of adducts often also complicate analyses.
The small injection volumes required by CE allow the development and optimization of analytical methods tailored for each specific sample. This feature allows the maximum exploitation of the CE-MS informative capacity for samples having microheterogeneities and available in small amounts. As a consequence, the most promising applications of online but also off-line CE-MS concern the structural characterization of the oligosaccharides generated from biomacromolecules, like complex polysaccharides and PGs.
In the near future, automation and miniaturization is expected for high-throughput structural elucidation of carbohydrates in glycomics, in which the implementation of microfluidic devices and chip-based CE-MS technology will play a central role generally applicable to any biological system under well-designed conditions [30].
Abbreviations
- AMAC
2-aminoacridone
- CS
chondroitin sulfate
- DS
dermatan sulfate
- GAG(s)
glycosaminoglycan(s)
- GalNAc
N-acetylgalactosamine
- GlcA
glucuronic acid
- GlcNAc
N-acetylglucosamine
- HA
hyaluronic acid
- Hep
heparin
- HS
heparan sulfate
- KS
keratan sulfate
- PG(s)
proteoglycan(s)
Footnotes
The authors have declared no conflict of interest.
References
- 1.Sasisekharan R, Raman R, Prabhakar V. Annu Rev Biomed Eng. 2006;8:181–231. doi: 10.1146/annurev.bioeng.8.061505.095745. [DOI] [PubMed] [Google Scholar]
- 2.Sugahara K, Mikami T, Uyama T, Mizuguchi S, et al. Curr Opin Struct Biol. 2003;13:612–620. doi: 10.1016/j.sbi.2003.09.011. [DOI] [PubMed] [Google Scholar]
- 3.Vynios DH, Karamanos NK, Tsiganos CP. J Chromatogr B. 2002;781:21–38. doi: 10.1016/s1570-0232(02)00498-1. [DOI] [PubMed] [Google Scholar]
- 4.Hileman RE, Fromm JR, Weiler JM, Linhardt RJ. Bioessays. 1998;20:156–167. doi: 10.1002/(SICI)1521-1878(199802)20:2<156::AID-BIES8>3.0.CO;2-R. [DOI] [PubMed] [Google Scholar]
- 5.Jackson RL, Busch SJ, Cardin AD. Physiol Rev. 1991;71:481–539. doi: 10.1152/physrev.1991.71.2.481. [DOI] [PubMed] [Google Scholar]
- 6.Wight TN, Mecham RP, editors. Biology of Proteoglycans. Academic Press; New York: 1987. [Google Scholar]
- 7.Kjellen L, Lindahl U. Annu Rev Biochem. 1991;60:443–475. doi: 10.1146/annurev.bi.60.070191.002303. [DOI] [PubMed] [Google Scholar]
- 8.Ruoslahti E. Annu Rev Cell Biol. 1988;4:229–255. doi: 10.1146/annurev.cb.04.110188.001305. [DOI] [PubMed] [Google Scholar]
- 9.Heinegard D, Oldberg A. FASEB J. 1989;3:2042–2051. doi: 10.1096/fasebj.3.9.2663581. [DOI] [PubMed] [Google Scholar]
- 10.Salmivirta M, Jalkanen M. Experientia. 1995;51:863–872. doi: 10.1007/BF01921737. [DOI] [PubMed] [Google Scholar]
- 11.Iozzo RV. J Biol Chem. 1999;274:18843–18846. doi: 10.1074/jbc.274.27.18843. [DOI] [PubMed] [Google Scholar]
- 12.Ruoslahti E. J Biol Chem. 1989;264:13369–13372. [PubMed] [Google Scholar]
- 13.Sasisekharan R, Shriver Z, Venkataraman G, Narayanasami U. Nat Rev Cancer. 2002;2:521–528. doi: 10.1038/nrc842. [DOI] [PubMed] [Google Scholar]
- 14.Capila I, Linhardt RJ. Angew Chem Int Ed Engl. 2002;41:391–412. doi: 10.1002/1521-3773(20020201)41:3<390::aid-anie390>3.0.co;2-b. [DOI] [PubMed] [Google Scholar]
- 15.Linhardt RJ. Chem Biol. 2004;11:420–422. doi: 10.1016/j.chembiol.2004.04.001. [DOI] [PubMed] [Google Scholar]
- 16.Mulloy B, Linhardt RJ. Curr Opin Struct Biol. 2001;11:623–628. doi: 10.1016/s0959-440x(00)00257-8. [DOI] [PubMed] [Google Scholar]
- 17.Ofosu FA, Danishefsky I, Hirsh J, editors. Heparin and Related Polysaccharides Structure and Activities. Vol. 556. N. Y. Acad Sci.; New York: 1989. [PubMed] [Google Scholar]
- 18.Mammen EF, editor. Semin Thromb Hemost. Supp 1–2 Vol. 17. Theme Medical Pub Inc.; New York: 1991. Development of Nonheparin Glycosaminoglycans as Therapeutic agents. [Google Scholar]
- 19.Crescenzi V, Dea ICM, Paoletti S, Stivala SS, Sutherland IW, editors. Biomedical and Biotechnological Advances in Industrial Polysaccharides. Gordon and Breach Sci Pub; New York: 1989. [Google Scholar]
- 20.Volpi N, editor. Chondroitin Sulfate: Structure, Role and Pharmacological Activity. Academic Press; San Diego, CA: 2006. [Google Scholar]
- 21.Linhardt RJ, Hileman RE. Gen Pharmacol. 1995;26:443–451. doi: 10.1016/0306-3623(94)00231-b. [DOI] [PubMed] [Google Scholar]
- 22.Volpi N. Curr Med Chem. 2006;13:1799–1810. doi: 10.2174/092986706777452470. [DOI] [PubMed] [Google Scholar]
- 23.Linhardt RJ. J Med Chem. 2003;46:2551–2554. doi: 10.1021/jm030176m. [DOI] [PubMed] [Google Scholar]
- 24.Murugesan S, Mousa S, Vijayaraghavan A, Ajayan PM, Linhardt RJ. J Biomed Mater Res B. 2006;79B:298–304. doi: 10.1002/jbm.b.30542. [DOI] [PMC free article] [PubMed] [Google Scholar]
- 25.Imanari T, Toida T, Koshiishi I, Toyoda H. J Chromatogr A. 1996;720:275–293. doi: 10.1016/0021-9673(95)00338-x. [DOI] [PubMed] [Google Scholar]
- 26.Grimshaw J. Electrophoresis. 1997;18:2408–2414. doi: 10.1002/elps.1150181231. [DOI] [PubMed] [Google Scholar]
- 27.Koketsu M, Linhardt RJ. Anal Biochem. 2000;283:136–145. doi: 10.1006/abio.2000.4649. [DOI] [PubMed] [Google Scholar]
- 28.Karamanos NK, Hjerpe A. Electrophoresis. 1998;19:2561–2571. doi: 10.1002/elps.1150191504. [DOI] [PubMed] [Google Scholar]
- 29.Mao W, Thanawiroon C, Linhardt RJ. Biomed Chromatogr. 2002;16:77–94. doi: 10.1002/bmc.153. [DOI] [PubMed] [Google Scholar]
- 30.Volpi N, Maccari F. J Chromatogr B. 2006;834:1–13. doi: 10.1016/j.jchromb.2006.02.049. [DOI] [PubMed] [Google Scholar]
- 31.Volpi N. Curr Pharm Des. 2006;12:639–658. doi: 10.2174/138161206775474350. [DOI] [PubMed] [Google Scholar]
- 32.Linhardt RJ. In: Methods in Enzymology, Guide to Techniques in Glycobiology. Chapter 16. Lennarz WJ, Hart GW, editors. Vol. 230. Academic Press; San Diego, CA: 1994. pp. 265–280. [Google Scholar]
- 33.Linhardt RJ, Toida T. In: Capillary Electrophoresis of Oligosaccharides and Complex Carbohydrates. Honda S, Thibault P, editors. Vol. 2003. Humana Press; Totawa, NJ: pp. 133–146. [Google Scholar]
- 34.Linhardt RJ, Toida T. Science. 2002;298:1441–1442. doi: 10.1126/science.298.5597.1441. [DOI] [PubMed] [Google Scholar]
- 35.Simonet BM, Ríos A, Grases F, Valcárcel M. Electrophoresis. 2003;24:2092–2098. doi: 10.1002/elps.200305404. [DOI] [PubMed] [Google Scholar]
- 36.Grimshaw J, Rice A, Trocha-Grimshaw J. J Capil Electrophor. 1996;3:249–253. [PubMed] [Google Scholar]
- 37.Stefansson M, Novotny M. Anal Chem. 1994;66:1134–1140. doi: 10.1021/ac00079a031. [DOI] [PubMed] [Google Scholar]
- 38.Linhardt RJ, Avci FY, Toida T, Kim YS, Cygler M. Adv Pharmacol. 2006;53:187–215. doi: 10.1016/S1054-3589(05)53009-6. [DOI] [PMC free article] [PubMed] [Google Scholar]
- 39.Ernst S, Langer R, Cooney CL, Sasisekharan R. Crit Rev Biochem Mol Biol. 1995;30:387–444. doi: 10.3109/10409239509083490. [DOI] [PubMed] [Google Scholar]
- 40.Petit E, Delattre C, Papy-Garcia D, Michaud P. Adv Pharmacol. 2006;53:167–186. doi: 10.1016/S1054-3589(05)53008-4. [DOI] [PubMed] [Google Scholar]
- 41.Michaud P, Da Costa A, Courtois B, Courtois J. Crit Rev Biotechnol. 2003;23:233–266. doi: 10.1080/07388550390447043. [DOI] [PubMed] [Google Scholar]
- 42.Sundaram M, Qi Y, Shriver Z, Liu D, et al. Proc Natl Acad Sci USA. 2003;100:651–656. doi: 10.1073/pnas.252643299. [DOI] [PMC free article] [PubMed] [Google Scholar]
- 43.Volpi N. Anal Chem. 2007;79:6390–6397. doi: 10.1021/ac070837d. [DOI] [PubMed] [Google Scholar]
- 44.Volpi N. Glycobiology. 2003;13:635–640. doi: 10.1093/glycob/cwg074. [DOI] [PubMed] [Google Scholar]
- 45.Lin S, Hsu SM. Anal Biochem. 2005;341:1–15. doi: 10.1016/j.ab.2005.02.023. [DOI] [PubMed] [Google Scholar]
- 46.Oefner PJ, Chiesa C. Glycobiology. 1994;4:397–412. doi: 10.1093/glycob/4.4.397. [DOI] [PubMed] [Google Scholar]
- 47.Gunay NS, Linhardt RJ. J Chromatogr A. 2003;1014:225–233. doi: 10.1016/s0021-9673(03)01288-3. [DOI] [PubMed] [Google Scholar]
- 48.Lazar IM, Xin B, Lee ML, Lee ED, et al. Anal Chem. 1997;69:3205–3211. [Google Scholar]
- 49.Zaia J. Mass Spectrom Rev. 2004;23:161–227. doi: 10.1002/mas.10073. [DOI] [PubMed] [Google Scholar]
- 50.Zaia J, Costello CE. Anal Chem. 2001;73:233–239. doi: 10.1021/ac000777a. [DOI] [PubMed] [Google Scholar]
- 51.Saad OM, Leary JA. Anal Chem. 2003;75:2985–2995. doi: 10.1021/ac0340455. [DOI] [PubMed] [Google Scholar]
- 52.Chai W, Luo J, Lim CK, Lawson AM. Anal Chem. 1998;70:2060–2066. doi: 10.1021/ac9712761. [DOI] [PubMed] [Google Scholar]
- 53.Zamfir A, Seidler DG, Kresse H, Peter-Katalini J. Glycobiology. 2003;13:733–742. doi: 10.1093/glycob/cwg086. [DOI] [PubMed] [Google Scholar]
- 54.Hayase S, Oda Y, Honda S, Kakehi K. J Chromatogr A. 1997;768:295–305. doi: 10.1016/s0021-9673(96)01095-3. [DOI] [PubMed] [Google Scholar]
- 55.Toida T, Linhardt RJ. Electrophoresis. 1996;17:341–346. doi: 10.1002/elps.1150170209. [DOI] [PubMed] [Google Scholar]
- 56.Carney SL, Osborne DJ. Anal Biochem. 1991;195:132–140. doi: 10.1016/0003-2697(91)90308-g. [DOI] [PubMed] [Google Scholar]
- 57.Karamanos NK, Axelsson S, Vanky P, Tzanakakis GN, Hjerpe A. J Chromatogr A. 1995;696:295–305. doi: 10.1016/0021-9673(94)01294-o. [DOI] [PubMed] [Google Scholar]
- 58.Payan E, Presle N, Lapicque F, Jouzeau JY, et al. Anal Chem. 1998;70:4780–4786. doi: 10.1021/ac9800558. [DOI] [PubMed] [Google Scholar]
- 59.Novotny MV, Sudor J. Electrophoresis. 1993;14:373–389. doi: 10.1002/elps.1150140163. [DOI] [PubMed] [Google Scholar]
- 60.Hong M, Sudor J, Stefansson M, Novotny MV. Anal Chem. 1998;70:568–573. doi: 10.1021/ac970768a. [DOI] [PubMed] [Google Scholar]
- 61.Hutterer KM, Jorgenson JW. Electrophoresis. 2005;26:2027–2033. doi: 10.1002/elps.200500089. [DOI] [PubMed] [Google Scholar]
- 62.Kakehi K, Kinoshita M, Hayase S, Oda Y. Anal Chem. 1999;71:1592–1596. doi: 10.1021/ac981248y. [DOI] [PubMed] [Google Scholar]
- 63.Park Y, Cho S, Linhardt RJ. Biochim Biophys Acta. 1997;1337:217–226. doi: 10.1016/s0167-4838(96)00167-7. [DOI] [PubMed] [Google Scholar]
- 64.Yang Y, Breadmore MC, Thormann W. J Sep Sci. 2005;28:2381–2389. doi: 10.1002/jssc.200500181. [DOI] [PubMed] [Google Scholar]
- 65.Zinellu A, Pisanu S, Zinellu E, Lepedda AJ, et al. Electrophoresis. 2007;28:2439–2447. doi: 10.1002/elps.200600668. [DOI] [PubMed] [Google Scholar]
- 66.Grimshaw J, Kane A, Trocha-Grimshaw J, Douglas A, et al. Electrophoresis. 1994;15:936–940. doi: 10.1002/elps.11501501137. [DOI] [PubMed] [Google Scholar]
- 67.Plätzer M, Ozegowski JH, Neubert RH. J Pharm Biomed Anal. 1999;21:491–496. doi: 10.1016/s0731-7085(99)00120-x. [DOI] [PubMed] [Google Scholar]
- 68.Alkrad JA, Merstani Y, Neubert RH. J Pharm Biomed Anal. 2002;30:913–919. doi: 10.1016/s0731-7085(02)00329-1. [DOI] [PubMed] [Google Scholar]
- 69.Pattanaargson S, Roboz J. Toxicon. 1996;34:1107–1117. doi: 10.1016/0041-0101(96)00083-9. [DOI] [PubMed] [Google Scholar]
- 70.Kühn AV, Rüttinger HH, Neubert RH, Raith K. Rapid Commun Mass Spectrom. 2003;17:576–582. doi: 10.1002/rcm.950. [DOI] [PubMed] [Google Scholar]
- 71.Al-Hakim A, Linhardt RJ. Anal Biochem. 1991;195:68–73. doi: 10.1016/0003-2697(91)90296-6. [DOI] [PubMed] [Google Scholar]
- 72.Ampofo SA, Wang HM, Linhardt RJ. Anal Biochem. 1991;199:249–255. doi: 10.1016/0003-2697(91)90098-e. [DOI] [PubMed] [Google Scholar]
- 73.Scapol L, Marchi E, Viscomi GC. J Chromatogr A. 1996;735:367–374. doi: 10.1016/0021-9673(95)00813-6. [DOI] [PubMed] [Google Scholar]
- 74.Michaelsen S, Schrøder MB, Sørensen H. J Chromatogr. 1993;652:503–515. doi: 10.1016/0021-9673(93)83272-T. [DOI] [PubMed] [Google Scholar]
- 75.Okamoto H, Nakajima T, Ito Y, Shimada K, Yamato S. J Chromatogr A. 2004;1035:137–144. doi: 10.1016/j.chroma.2004.02.051. [DOI] [PubMed] [Google Scholar]
- 76.Pervin A, Al-Hakim A, Linhardt RJ. Anal Biochem. 1994;221:182–188. doi: 10.1006/abio.1994.1395. [DOI] [PubMed] [Google Scholar]
- 77.Miller MJC, Costello CE, Malmström A, Zaia J. Glycobiology. 2006;16:502–513. doi: 10.1093/glycob/cwj093. [DOI] [PMC free article] [PubMed] [Google Scholar]
- 78.Hitchcock AM, Yates KE, Shortkroff S, Costello CE, Zaia J. Glycobiology. 2006;17:25–35. doi: 10.1093/glycob/cwl046. [DOI] [PMC free article] [PubMed] [Google Scholar]
- 79.Hitchcock A, Costello C, Zaia J. Proteomics. 2008;8:1384–1397. doi: 10.1002/pmic.200700787. [DOI] [PMC free article] [PubMed] [Google Scholar]
- 80.Lamari F, Theocharis A, Hjerpe A, Karamanos NK. J Chromatogr B. 1999;730:129–133. doi: 10.1016/s0378-4347(99)00184-x. [DOI] [PubMed] [Google Scholar]
- 81.Kitagawa H, Kinoshita A, Sugahara K. Anal Biochem. 1995;232:114–121. doi: 10.1006/abio.1995.9952. [DOI] [PubMed] [Google Scholar]
- 82.El Rassi Z, Postlewait J, Mechref Y, Ostrander GK. Anal Biochem. 1997;244:283–290. doi: 10.1006/abio.1996.9905. [DOI] [PubMed] [Google Scholar]
- 83.Honda S, Ueno T, Kakehi K. J Chromatogr. 1992;608:289–295. doi: 10.1016/0021-9673(92)87135-u. [DOI] [PubMed] [Google Scholar]
- 84.Matsuno YK, Yamada K, Tanabe A, Kinoshita M, et al. Anal Biochem. 2007;362:245–257. doi: 10.1016/j.ab.2006.12.027. [DOI] [PubMed] [Google Scholar]
- 85.Zamfir A, Seidler DG, Kresse H, Peter-Katalinić J. Rapid Commun Mass Spectrom. 2002;16:2015–2024. doi: 10.1002/rcm.820. [DOI] [PubMed] [Google Scholar]
- 86.Zamfir A, Peter-Katalinić J. Electrophoresis. 2004;25:1949–1963. doi: 10.1002/elps.200405825. [DOI] [PubMed] [Google Scholar]
- 87.Seidler DG, Peter-Katalinić J, Zamfir AD. Scientific World Journal. 2007;7:233–241. doi: 10.1100/tsw.2007.63. [DOI] [PMC free article] [PubMed] [Google Scholar]
- 88.Zamfir A, Seidler DG, Schönherr E, Kresse H, Peter-Katalinić J. Electrophoresis. 2004;25:2010–2016. doi: 10.1002/elps.200405925. [DOI] [PubMed] [Google Scholar]
- 89.Stefansson M, Novotny M. Anal Chem. 1994;66:3466–3411. doi: 10.1021/ac00092a026. [DOI] [PubMed] [Google Scholar]
- 90.Duchemin V, Le Potier I, Troubat C, Ferrier D, Taverna M. Biomed Chromatogr. 2002;16:127–133. doi: 10.1002/bmc.151. [DOI] [PubMed] [Google Scholar]
- 91.Mikus P, Valásková I, Havránek E. J Pharm Biomed Anal. 2004;36:441–446. doi: 10.1016/j.jpba.2004.07.017. [DOI] [PubMed] [Google Scholar]
- 92.Damm JB, Overklift GT, Vermeulen BW, Fluitsma CF, van Dedem GW. J Chromatogr. 1992;608:297–309. doi: 10.1016/0021-9673(92)87136-v. [DOI] [PubMed] [Google Scholar]
- 93.Malsch R, Harenberg J, Dieter L, Heene DL. J Chromatogr A. 1995;716:259–268. [Google Scholar]
- 94.Damm JB, Overklift GT. J Chromatogr A. 1994;678:151–165. doi: 10.1016/0021-9673(94)87085-3. [DOI] [PubMed] [Google Scholar]
- 95.Kim MY, Varenna A, Daniel R, Garell P. J Sep Sci. 2003;26:1154–1162. [Google Scholar]
- 96.Desai UR, Wang H, Ampofo SA, Linhardt RJ. Anal Biochem. 1993;213:120–127. doi: 10.1006/abio.1993.1394. [DOI] [PubMed] [Google Scholar]
- 97.Sudor J, Novotny MV. Anal Chem. 1997;69:3199–3204. doi: 10.1021/ac961297f. [DOI] [PubMed] [Google Scholar]
- 98.Karamanos NK, Vanky P, Tzanakakis GN, Hjerpe A. Electrophoresis. 1996;17:391–395. doi: 10.1002/elps.1150170217. [DOI] [PubMed] [Google Scholar]
- 99.Ruiz-Calero V, Puignou L, Galceran MT. J Chromatogr A. 1998;828:497–508. doi: 10.1016/s0021-9673(98)00662-1. [DOI] [PubMed] [Google Scholar]
- 100.Militsopoulou M, Lamari FN, Hjerpe A, Karamanos NK. Electrophoresis. 2002;23:1104–1109. doi: 10.1002/1522-2683(200204)23:7/8<1104::AID-ELPS1104>3.0.CO;2-1. [DOI] [PubMed] [Google Scholar]
- 101.Rhomberg AJ, Ernst S, Sasisekharan R, Biemann K. Proc Natl Acad Sci USA. 1998;95:4176–4181. doi: 10.1073/pnas.95.8.4176. [DOI] [PMC free article] [PubMed] [Google Scholar]
- 102.Ernst S, Rhomberg AJ, Biemann K, Sasisekharan R. Proc Natl Acad Sci USA. 1998;95:4182–4187. doi: 10.1073/pnas.95.8.4182. [DOI] [PMC free article] [PubMed] [Google Scholar]
- 103.Duteil S, Gareil P, Girault S, Mallet A, et al. Rapid Commun Mass Spectrom. 1999;13:1889–1898. doi: 10.1002/(SICI)1097-0231(19991015)13:19<1889::AID-RCM719>3.0.CO;2-#. [DOI] [PubMed] [Google Scholar]
- 104.Ruiz-Calero V, Moyano E, Puignou L, Galceran MT. J Chromatogr A. 2001;914:277–291. doi: 10.1016/s0021-9673(00)01181-x. [DOI] [PubMed] [Google Scholar]
- 105.Guerrini M, Raman R, Venkataraman G, Torri G, et al. Glycobiology. 2002;12:713–719. doi: 10.1093/glycob/cwf084. [DOI] [PubMed] [Google Scholar]
- 106.Liang A, Chao Y, Liu X, Du Y, et al. Electrophoresis. 2005;26:3460–3467. doi: 10.1002/elps.200500115. [DOI] [PubMed] [Google Scholar]
- 107.Kim YS, Ahn MY, Wu SJ, Kim DH, et al. Glycobiology. 1998;8:869–877. doi: 10.1093/glycob/8.9.869. [DOI] [PubMed] [Google Scholar]
- 108.Chi L, Munoz EM, Choi HS, Ha YW, et al. Carbohydr Res. 2006;341:864–869. doi: 10.1016/j.carres.2006.02.030. [DOI] [PMC free article] [PubMed] [Google Scholar]
- 109.Vander Noot VA, Hileman RE, Dordick JS, Linhardt RJ. Electrophoresis. 1998;19:437–441. doi: 10.1002/elps.1150190313. [DOI] [PubMed] [Google Scholar]
- 110.Wu X, Linhardt RJ. Electrophoresis. 1998;19:2650–2653. doi: 10.1002/elps.1150191514. [DOI] [PubMed] [Google Scholar]
- 111.Hernáiz MJ, LeBrun LA, Wu Y, Sen JW, et al. Eur J Biochem. 2002;269:2860–2867. doi: 10.1046/j.1432-1033.2002.02964.x. [DOI] [PubMed] [Google Scholar]
- 112.Heegaard NH, He X, Blomberg LG. Electrophoresis. 2006;13:2609–2615. doi: 10.1002/elps.200600005. [DOI] [PubMed] [Google Scholar]
- 113.Seyrek E, Dubin PL, Henriksen J. Biopolymers. 2007;86:249–259. doi: 10.1002/bip.20731. [DOI] [PubMed] [Google Scholar]
- 114.Volpi N. Electrophoresis. 2003;24:1063–1068. doi: 10.1002/elps.200390123. [DOI] [PubMed] [Google Scholar]
- 115.Volpi N. Electrophoresis. 2004;25:692–696. doi: 10.1002/elps.200305563. [DOI] [PubMed] [Google Scholar]
- 116.Volpi N. Electrophoresis. 2004;25:3307–3312. doi: 10.1002/elps.200305856. [DOI] [PubMed] [Google Scholar]