Abstract
 Molecular recognition of sugars and a practical method to detect and discriminate among a large number of such similar analytes remain substantial scientific challenges. We report here a low-cost, simple colorimetric sensor array capable of identification and quantification of sugars and related compounds. Fifteen different monosaccharides, disaccharides, and artificial sweeteners were differentiated without error in 80 trials. Limits of detection at pH 7.4 for glucose were <1mM, which is below physiologically important levels.
Array-based sensing has emerged as a powerful tool for the detection of chemically diverse analytes. Based on cross-responsive sensor elements, these systems mimic the mammalian gustatory and olfactory systems by producing specificity, not from any single sensor, but as a unique composite response for each analyte.1,2 For example, electronic tongue technology for the detection of aqueous analytes has generally employed arrays of sensors based on polymer absorption, electrochemical reactions, or oxidations of analytes on metal oxides.3 We have previously reported on the development of a rather different, but quite simple, optoelectronic approach using a colorimetric sensor array of chemically responsive dyes for identification and quantification of a wide range of analytes both in gas phase and in aqueous solutions.4-6 The colors of the dyes are affected by a wide range of analyte-dye interactions (e.g., pH, Lewis acid-base, dipolar, π-π, etc.), and the arrays made by simply printing hydrophobic dyes on a hydrophobic membrane. Although this approach is very effective for the detection of volatile organics in the gas phase5 and more hydrophobic organics in water,6 hydrophilic analytes (including carbohydrates) have proved challenging. Here we report a new liquid sensing array methodology based on the immobilization of indicators within a nanoporous sol-gel matrix and its successful application to the molecular recognition of sugars and artificial sweeteners. Visual identification of 15 sugars is easily made at millimolar concentrations at pH 7.4 with extremely low error rates.
The conversion of soluble dyes into insoluble (but still analyte-accessible) nanoporous pigments by immobilizing pH indicators in sol-gel matrices7 offers advantages of improved durability and stability. Furthermore, the final properties of the nanoporous pigments (e.g., hydrophobicity, porosity) can be easily modified by controlling the physical and chemical parameters of the sol-gel process. While monoliths, films, and fibers of individual nanoporous pigments are known,7,8 we report here for the first time chemically responsive nanoporous pigment arrays suitable for aqueous sensing and a method for printing such arrays directly onto hydrophilic membranes. The sol-gel-colorant solutions were prepared by hydrolysis of Si(OCH3)4 and Si(CH3)(OCH3)3 with a variety of indicators (cf. Supporting Information). The resulting arrays show fast response (<30 s) and high sensitivities with no detectable colorant leaching in aqueous media.
Molecular recognition of carbohydrates (which differ primarily in the conformation of multiple hydroxyl groups) poses a particularly difficult challenge and generally requires the use of preexisting protein-saccharide interactions.9 The approach used here for the identification of carbohydrates is nonenzymatic and relies in part on the differences in association constants of boronic acids with diols (e.g., sugars), leading to changes in solution pH.10-13 Arylboronic acids specifically show discrimination among saccharides. For example, Chang and co-workers recently reported discrimination among sugars using pH indicators and boric and arylboronic acids.12 This approach is cumbersome, however, requiring the addition of individual analytes to multiple separate liquid solutions of each pH indicator/boronic mixture. In contrast, we report here that the single addition of analyte to a printed array of immobilized pH indicators in a sol-gel matrix offers advantages in ease of use, sensitivity, expense, and reusability.
Even more importantly, we find that the presumption11h,12 that this discrimination is due exclusively to changes in pH is incorrect: even for the class of closely related sugars, the colorimetric array data proves to be highly multidimensional, with six independent dimensions necessary for optimal classification. This high level of dispersion shows that the array is sensing more than simply changes in pH of the weakly buffered boronic acid solution, including more direct Lewis acid-base interactions and hydrogen bonding between the sugars and their adducts with the indicator pigments: pH indicators indicate much more than just pH.
The association of a boronic acid and a diol is related to the equilibrium between the trigonal and tetrahedral boronate ester formed13 and is dependent on the electronic nature of the boronic acid.11c Formation of the tetrahedral ester produces hydronium ion as a byproduct, thereby lowering the solution pH (Scheme 1). which contributes to the discrimination among analytes.14 To optimize array response, we examined several commercially available boronic acids (Figure 1), including phenylboronic acid (pKa 8.8), o-hydroxymethylphenylboronic acid (pKa 7.2), 3-nitrophenylboronic acid (pKa 7.1), 2,5-difluorophenylboronic acid (pKa 7.0), and 2,4,5-trifluorophenylboronic acid (pKa 6.7); for our studies, 3-nitrophenylboronic acid was selected due to its superior binding affinity for 1,2-diols at physiological pH.
Scheme 1.
Diol Adducts of Phenylboronic Acid
Figure 1.
Average color difference maps for five trials of 25 mM D-glucose in 1 mM phosphate buffer at initial pH 7.4 with five different aryl boronic acids at 5 mM. For each experiment, a printed array was digitally imaged with an ordinary flatbed scanner before and after exposure to analyte in weakly buffered arylboronic acid solutions. and the change in RGB values for each colorant spot was calculated (cf. Supporting Information for the digital database). For display, the color range is expanded from 4 to 8 bits per color (RGB range of 4-19 expanded to 0-255).
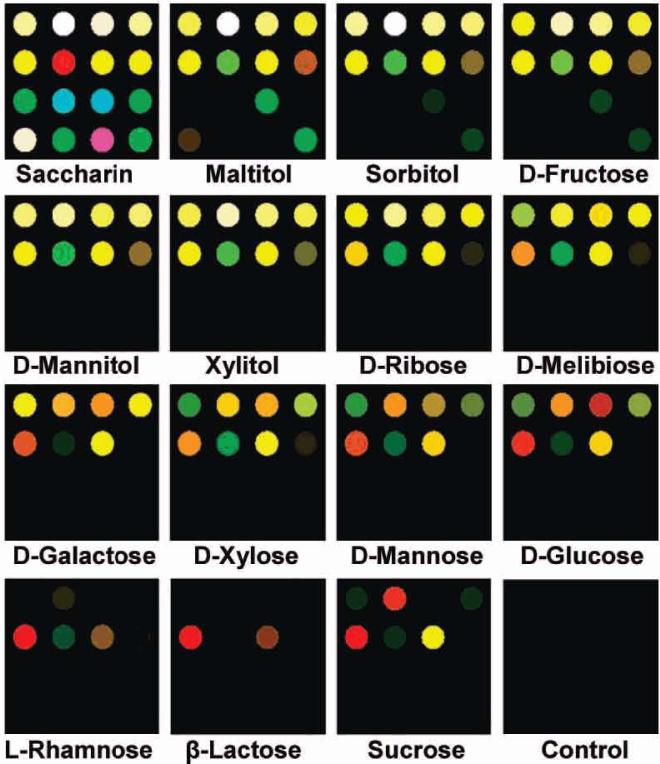
The array was tested against 15 different sugars (including both mono- and disaccharides), artificial sweeteners and sugar alcohols in 1 mM phosphate buffer at pH 7.4 with 5 mM 3-nitrophenylboronic acid. Complete equilibration was ensured (exposure time 5 min, which is well beyond ~1 min response time demonstrated in Figure 2). A database was assembled from quintuplicate runs of the sugar analytes at 25 mM concentrations, except for sucrose, which required higher concentrations. Upon exposure to the analyte solution, the array undergoes reversible reactions that result in well-defined color changes. Color change profiles, which prove to be unique to each sugar, are shown in Figure 3.
Figure 2.
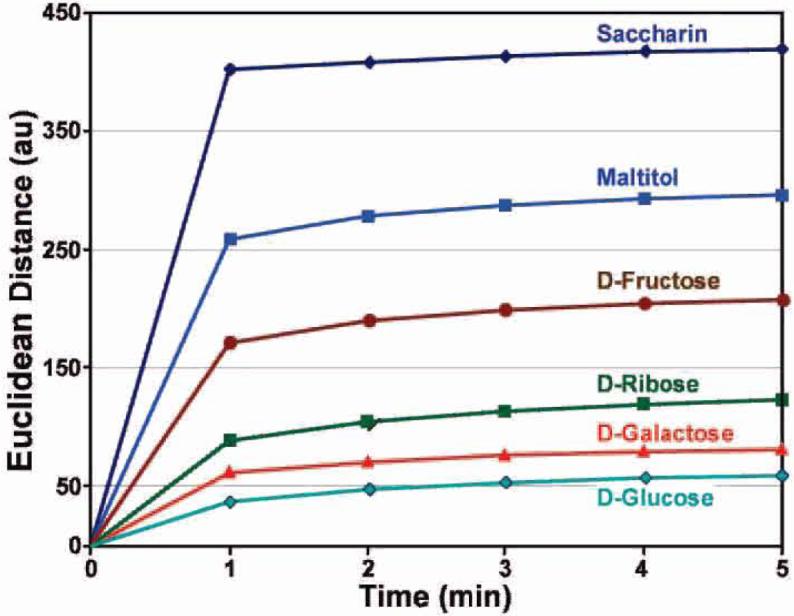
Total Euclidean distance versus tlme for six representative sugars at 25 mM concentration; as shown, >90% equilibration occurs in 1 min.
Figure 3.
Color difference maps of 15 sugars and sweeteners after equilibration at 25 mM concentration, except for sucrose (150 mM). For visualization, the color range is expanded from 4 to 8 bits per color (RGB range of 4-19 expanded to 0-255), except for β-lactose, sucrose, and the control (4-7 to 0-255) due to low response. For all statistical analysis, the complete raw digital data (Supporting Information Table S3) were used.
It has been quite generally assumed (incorrectly as we shall see) that the discrimination among saccharides with boronic acids using pH indicators is due only to pH changes. If this were the case, then a single dimension (i.e., pH) would lead to optimum classification of the data from the colorimetric array. When we examined the classification by principal component analysis (PCA) or linear discriminant analysis (LDA)15 of our color change profile database, however, we were surprised to find a much higher dimensionality for the colorimetric array discrimination. For example, the classification error rate using LDA (leave-one-out cross validation) for the sugar and sweetener analytes requires a minimum of six dimensions for optimum discrimination (cf. Figures S1-S3, Supporting Information), whereas control solutions with changed pH require at most two dimensions (with only one dimension needed for 92% accuracy). The array is therefore discriminating between analytes through more interactions than pH alone: more direct Lewis acid-base interactions and hydrogen bonding between the sugars and their adducts with the indicator pigments must also play a role.16
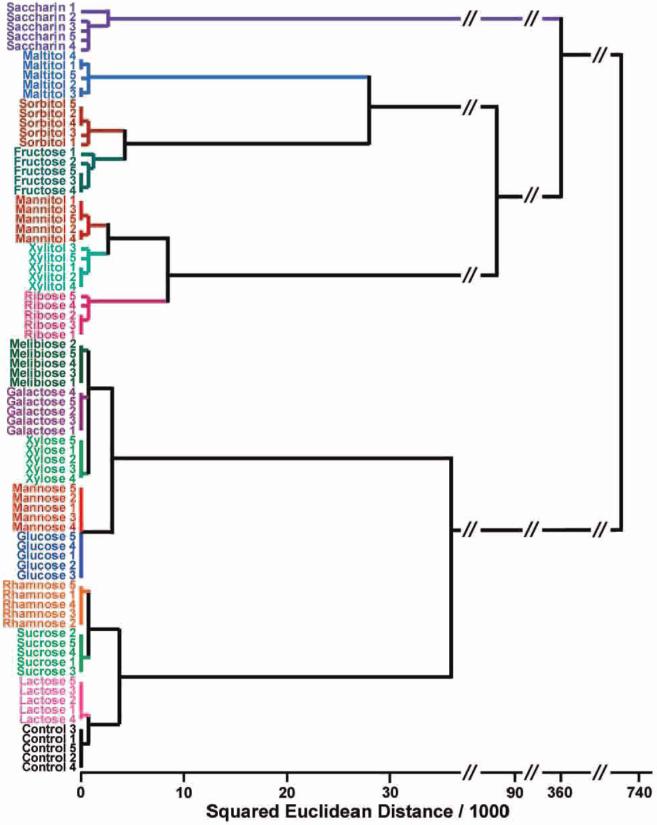
The high dispersion of the colorimetric sensor array data requires a classification algorithm that uses the full dimensionality of the data. The simplest approach (and one that assumes no statistical model) is hierarchical cluster analysis (HCA).15 The HCA forms dendrograms based on clustering of our array response data in the 48 dimensional ΔRGB color space (i.e., 16 nanoporous pigment array), as shown in Figure 4. Remarkably, in quintuplicate trials, all 15 sugars and sweeteners were accurately identified against one another with no errors or misclassifications out of 80 cases. Confirming the LDA discussed earlier, a minimum of nine dimensions are required for error-free classification of our data by HCA (cf. Figure S4, Supporting Information), albeit that pKa of the sugar-boronic acid aduct is the single largest discriminant.
Figure 4.
Hierarchcal cluster analyws for 15 sugars and one control. All experiments were run in quintuphcate; no confusions or errors in classification were observed in 80 trials, as shown. After the sugar name, the trial number is given.
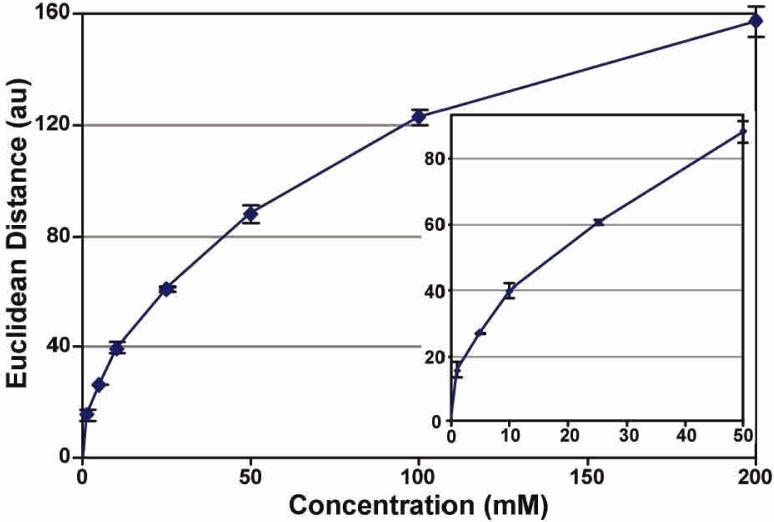
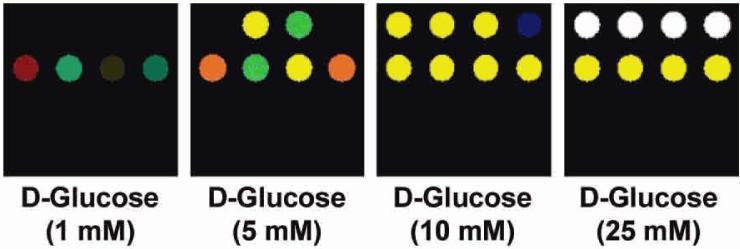
In addition to high discrimination, high sensitivity to carbohydrates is essential for most practical applications. For example, the physiological range of glucose concentration17 is ~2-50 mM; normal fasting plasma glucose (FPG) is ~5 mM, and the threshold of diabetes is >7.0 mM; and diabetic glucose concentrations 2 h after an oral glucose tolerance test are >11.1 mM. The limit of detection of the array was determined by titration with various concentrations of D-glucose. The overall response of the array (as measured by the total Euclidean difference, i.e., the square root of the sum of the squares of each color change of 16 pigments) vs D-glucose concentration is shown in Figure 5. The array's lower limit of detection (LOD), defined as 3*S/N, is < 1 mM. The limit of recognition (LOR) for an array is system and interferent dependent and therefore not as well defined. A color difference map detailing the color change profiles of the array versus vasying D-glucose concentrations is shown in Figure 6.
Figure 5.
Total Euclidean dlstance of the array color change versus D-glucose concentration. Inset expands the biologically Important region.
Figure 6.
Color difference maps of varying D-glucose concentrations. Color range is expanded from 2 to 8 bits per color (2-5 to 0-255).
While the may is inexpensive, disposable, and intended for single use, many of the reactions taking place are, in fact, reversible. We therefore examined the reusability of the arrays via cycling experiments in which an array is exposed to blank buffer solution using a 20 mL/min flow system (obtaining a “before” image) and then subjected to the same buffer infused with analyte (sugars) followed by plain buffer again for three complete cycles. Surprisingly good reusabihty was observed (cf. Figure S5, Supporting Information).
In summary, we have created a simple disposable colorimetric sensor may of nanoporous pigments that is capable of facile discrimination among a wide range of mono- and disaccharides as well as artificial sweeteners. Sensitivities below 1 mM have been observed for D-glucose at physiological pH. Classification analysis reveals that the colorimetric sensor array has an extremely high dimensionality, even for this family of very closely related analytes, with six dimensions necessary for optimum classification, The pH change created by the boronic acid adducts of the sugars, therefore, is only one (albeit substantial) component in the overall discrimination among these analytes.
Supplementary Material
Acknowledgment
This work was supported by the NIH and in past by the DOD (TSWG),
Supporting Information Available: Experimental details, list of indicators, structures of sugars, full sets of digital data, and PCA data.
References
- (1).Gardner JW, Bartlett PN. Electronic Noses: Principles and Applications. Oxford University Press; New York: 1999. [Google Scholar]
- (2).(a) Albert KJ, Lewis NS, Schauer CL, Sotzing GA, Stitzel SE, Vaid TP, Walt DR. Chem. Rev. 2000;100:2595. doi: 10.1021/cr980102w. [DOI] [PubMed] [Google Scholar]; (b) Lewis NS. Ace. Chem. Res. 2004;37:663. doi: 10.1021/ar030120m. [DOI] [PubMed] [Google Scholar]; (c) Anslyn EV. J. Org. Chem. 2007;72:687. doi: 10.1021/jo0617971. [DOI] [PubMed] [Google Scholar]; (d) Röck F, Barsan N, Weimar U. Chem. Rev. 2008;108:705–725. doi: 10.1021/cr068121q. [DOI] [PubMed] [Google Scholar]; (e) Hierlemann A, Gutierrez-Osuna R. Chem. Rev. 2008;108:563–613. doi: 10.1021/cr068116m. [DOI] [PubMed] [Google Scholar]
- (3).(a) Anand V, Kataria M, Kukkar V, Saharan V, Choudhury PK. Drug Discovery Today. 2007;12:257. doi: 10.1016/j.drudis.2007.01.010. [DOI] [PubMed] [Google Scholar]; (b) Toko K. Biomimetic Sensor Technology. Cambridge University Press; Cambridge, UK: p. 2000. [Google Scholar]
- (4).(a) Suslick KS, Bailey DP, Ingison CK, Janzen M, Kosal MA, McNamara WB, III, Rakow NA, Sen A, Weaver JJ, Wilson JB, Zhang C, Nakagaki S. Quim. Nova. 2007;30:677. [Google Scholar]; (b) Suslick KS. MRS Bull. 2004;29:720. doi: 10.1557/mrs2004.209. [DOI] [PubMed] [Google Scholar]
- (5).(a) Rakow NA, Suslick KS. Nature. 2000;406:710. doi: 10.1038/35021028. [DOI] [PubMed] [Google Scholar]; (b) Rakow NA, Sen A, Janzen MC, Ponder JB, Suslick KS. Angew. Chem., Int. Ed. 2005;44:4528. doi: 10.1002/anie.200500939. [DOI] [PubMed] [Google Scholar]; (c) Janzen MC, Ponder JB, Bailey DP, Ingison CK, Suslick KS. Anal. Chem. 2006;78:3591. doi: 10.1021/ac052111s. [DOI] [PubMed] [Google Scholar]
- (6).(a) Zhang C, Suslick KS. J. Am. Chem. Soc. 2005;127:11548. doi: 10.1021/ja052606z. [DOI] [PubMed] [Google Scholar]; (b) Zhang C, Bailey DP, Suslick KS. J. Agric. Food Chem. 2006;54:4925. doi: 10.1021/jf060110a. [DOI] [PubMed] [Google Scholar]; (c) Zhang C, Suslick KS. J. Agric. Food Chem. 2007;55:237. doi: 10.1021/jf0624695. [DOI] [PubMed] [Google Scholar]
- (7).(a) Rottman C, Grader G, De Hazan Y, Melchior S, Avnir D. J. Am. Chem. Soc. 1999;121:8533. [Google Scholar]; (b) Kowada Y, Ozeki T, Minami T. J. Sol-Gel Sci. Tech. 2005;33:175. [Google Scholar]; (c) Makote R, Collinson MM. Anal. Chim. Acta. 1999;394:195. [Google Scholar]
- (8).(a) Podbielska H, Ulatowska-Jarza A, Muller G, Eichler HJ. Sol-Gels for Optical Sensors. In: Baldini F, Chester AN, Homola J, Martellucci S, editors. Optical Chemical Sensors. Springer: Erice; Italy: 2006. pp. 353–385. [Google Scholar]; (b) Jeronimo PCA, Araujo AN, Montenegro M.Talanta 2007721319071577 [Google Scholar]
- (9).(a) Jelinek R, Kolusheva S. Chem. Rev. 2004;104:5987. doi: 10.1021/cr0300284. [DOI] [PubMed] [Google Scholar]; (b) Newman JD, Turner APF. Biosen. Bioelectron. 2005;20:2435. doi: 10.1016/j.bios.2004.11.012. [DOI] [PubMed] [Google Scholar]
- (10).James TD, Phillips MD, Shinkai S. Boronic Acids in Saccharide Recognition. Royal Society of Chemistry; Cambridge, U.K.: 2006. [Google Scholar]
- (11).(a) Schiller A, Wessling RA, Singaram B. Angew. Chem., Int. Ed. 2007;46:6457. doi: 10.1002/anie.200701888. [DOI] [PubMed] [Google Scholar]; (b) James TD, Sandanayake KRAS, Shinkai S. Angew. Chem., Int. Ed. 1996;35:1911. [Google Scholar]; (c) Yan J, Springsteen G, Deeter S, Wang B. Tetrahedron. 2004;60:11205. [Google Scholar]; (d) Springsteen G, Wang B. Tetrahedron. 2002;58:5291. [Google Scholar]; (e) Dowlut M, Hall DG. J. Am. Chem. Soc. 2006;128:4226. doi: 10.1021/ja057798c. [DOI] [PubMed] [Google Scholar]; (f) Zhang T, Anslyn EV. Org. Lett. 2006;8:1649. doi: 10.1021/ol060279+. [DOI] [PubMed] [Google Scholar]; (g) Edwards NY, Sager TW, McDevitt JT, Anslyn EV. J. Am. Chem. Soc. 2007;129:13575. doi: 10.1021/ja073939u. [DOI] [PubMed] [Google Scholar]; (h) Kim Y, Hilderbrand SA, Weissleder R, Tung C-H. Chem. Commun. 2007:2299. doi: 10.1039/b700741h. [DOI] [PubMed] [Google Scholar]; (i) Mulla HR, Agard NJ, Basu A. Bioorg. Med. Chem. Lett. 2004;14:25. doi: 10.1016/j.bmcl.2003.10.017. [DOI] [PubMed] [Google Scholar]
- (12).Lee JW, Lee J-S, Chang Y-T. Angew. Chem., Int. Ed. 2006;45:6485. doi: 10.1002/anie.200602055. [DOI] [PubMed] [Google Scholar]
- (13).(a) Boduroglu S, El Khoury JM, Reddy DV, Rinaldi PL, Hu J. Bioorg. Med. Chem. Lett. 2005;15:3974. doi: 10.1016/j.bmcl.2005.05.075. [DOI] [PubMed] [Google Scholar]; (b) Ni W, Fang H, Springsteen G, Wang B. J. Org. Chem. 2004;69:1999. doi: 10.1021/jo0350357. [DOI] [PubMed] [Google Scholar]
- (14).With the exception of saccharin, all the sugar derivatives in this study have diol moieties which are known to interact with boronic acid to generate boron-sugar complexes. Response to saccharin, however, is primarily due to its low pKa (1.6) which induces easily detected changes in pH
- (15).(a) Hasswell S. Practical Guide To Chemometrics. Dekker; New York: 1992. [Google Scholar]; (b) Scott SM, James D, Ali Z. Microchim. Acta. 2007;156:183. [Google Scholar]; (c) Johnson RA, Wichern DW. Applied Multivariate Statistical Analysis. 6th ed. Prentice Hall; New York: 2007. [Google Scholar]; (d) Hair JF, Black B, Babin B, Anderson RE, Tatham RL. Multivariate Data Analysis. 6th ed. Prentice Hall; New York: 2005. [Google Scholar]
- (16).(a) Nagai Y, Kobayashi K, Toi H, Aoyama Y. Bull. Chem. Soc. Jpn. 1993;66:2965. [Google Scholar]; (b) Jiang S, Escobedo JO, Kim KK, Alpturk O, Samoei GK, Fakayode SO, Warner IM, Rusin O, Strongin RM. J. Am. Chem. Soc. 2006;128:12221. doi: 10.1021/ja063651p. [DOI] [PMC free article] [PubMed] [Google Scholar]
- (17).Larson PR, Kronenberg HM, Melmed S, Polonsky KS, Wilson JD, Foster DW. Williams Textbook of Endocrinology. 10th ed. Saunders; Philadelphia: 2003. [Google Scholar]
Associated Data
This section collects any data citations, data availability statements, or supplementary materials included in this article.


