As part of a training set for automated image analysis, ∼150 000 images of crystallization experiments from 96 diverse macromolecules have been visually classified within seven categories. Outcomes and trends are analyzed.
Keywords: crystallization, image classification
Abstract
Structural crystallography aims to provide a three-dimensional representation of macromolecules. Many parts of the multistep process to produce the three-dimensional structural model have been automated, especially through various structural genomics projects. A key step is the production of crystals for diffraction. The target macromolecule is combined with a large and chemically diverse set of cocktails with some leading ideally, but infrequently, to crystallization. A variety of outcomes will be observed during these screening experiments that typically require human interpretation for classification. Human interpretation is neither scalable nor objective, highlighting the need to develop an automatic computer-based image classification. As a first step towards automated image classification, 147 456 images representing crystallization experiments from 96 different macromolecular samples were manually classified. Each image was classified by three experts into seven predefined categories or their combinations. The resulting data where all three observers are in agreement provides one component of a truth set for the development and rigorous testing of automated image-classification systems and provides information about the chemical cocktails used for crystallization. In this paper, the details of this study are presented.
1. Introduction
One of the major bottlenecks in the process of going from target to structure is crystallization. The Hauptman–Woodward Medical Research Institute (HWI) provides a high-throughput crystallization screening (HTS) service for the structural genomics and biological crystallography community. Macromolecular samples are screened against 1536 chemically diverse cocktails (Luft et al., 2003 ▶) using the microbatch-under-oil technique (Chayen et al., 1992 ▶). Each of the 1536 experiments are imaged before the macromolecular sample is added, immediately after the sample is added and then in weekly intervals for four weeks. Since its inception in 2000, the HWI HTS facility has screened >10 000 macromolecular samples, generating over 90 million images.
Currently, the interpretation of images is carried out manually. This is a necessary but time-consuming process that causes a major ‘bottleneck’ in the crystallization-screening pipeline. There have been a number of efforts to automate the image analysis of crystallization outcomes. Many of these efforts emphasize the identification of several specific categories of outcomes related to crystallization leads (Zuk & Ward, 1991 ▶; Cumbaa et al., 2003 ▶; Miyatake et al., 2005 ▶; Bern et al., 2004 ▶; Mayo et al., 2005 ▶; Berry et al., 2006 ▶; Walker et al., 2007 ▶; Cumbaa & Jurisica, 2005 ▶; Wilson & Main, 2000 ▶; Wilson, 2002 ▶; Kawabata et al., 2006 ▶).
We are also developing image-analysis software but taking a complementary approach. The majority of crystallization-screening experiments in our laboratory have an outcome that can be classified as either clear or precipitate. If the clear and precipitate conditions could automatically be identified then they could be eliminated from the set of images that require classification. Eliminating these outcomes would significantly reduce the number of images and would reduce the bottleneck in the crystallization-screening pipeline, making the human or machine image-analysis problem more manageable. As a result, more truth data can be generated, which will lead to better automated classifiers. This culling of clear and precipitate outcomes provides a subset of images for which more focused classification software could be developed. Adding credence to this approach is the ability of previous studies to assign images to these two classes with high accuracy (Cumbaa & Jurisica, 2005 ▶). As an initial step in the development of fully automated image analysis, we have established a training set of 147 456 manually classified images of crystallization experiments. These images depict the outcomes from a group of 96 macromolecules with a wide range of physical properties.
The cocktails used to screen these macromolecules can be divided into three groups: concentrated salts, polyethylene glycols (PEGs) and commercial screens. The salts and PEGs (groups 1 and 2) were constructed using an incomplete factorial design (Audic et al., 1997 ▶) and are buffered with 100 mM concentrations of CAPS (pH 10.0), TAPS (pH 9.0), Tris (pH 8.0), HEPES (pH 7.5), MOPS (pH 7.0), MES (pH 6.0), sodium acetate (pH 5.0) and sodium citrate (pH 4.0). Group 1, highly soluble salts (262 cocktails), includes 36 different salts (11 cations and 14 anions) at ∼30%, ∼60% and ∼90% saturation, buffered as described. Group 2, PEG/salt (722 cocktails), includes five different molecular-weight PEGs, 20, 8, 4, 1 kDa and 400 Da, combined with 35 salts at 100 mM concentration, also buffered as described. Group 3 consists of commercial screens (552 cocktails). This comprises Hampton Research Natrix, Quik Screen, PEG/Ion, PEG Grid, Ammonium Sulfate Grid, Sodium Chloride Grid, Crystal Screen HT, Index and SaltRx screens. For historical reasons, the first 22 cocktails from Hampton Research Crystal Screen Cryo are distributed within groups 1 and 2. These and other occurrences of Hampton Research cryocondition cocktails serve as a control during the experimental process.
By using images from a screen that encompasses most of the typical conditions used for crystallization, a comprehensive set of outcomes is obtained. The classified training set provides broad and large-scale truth data for training and testing of computer-based crystallization image-analysis algorithms. In this paper, we describe the process used to create this unique training set, evaluate the accuracy of the classifications and present a rudimentary analysis of the classified experimental outcomes.
2. Experimental
2.1. Samples
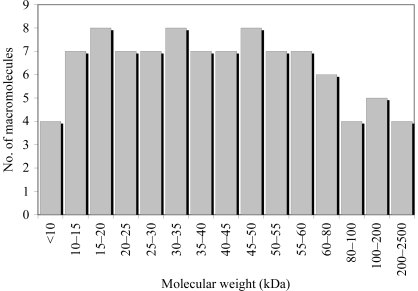
A group of 96 macromolecular samples representing a distribution of molecular weights were randomly selected for this study (Fig. 1 ▶). The samples were provided by 89 independent laboratories and represent a diverse population of macromolecular crystallization targets.
Figure 1.
Graph showing the number of macromolecules used in the study as a function of molecular weight.
2.2. Instrumentation
The high-throughput crystallization screening laboratory, which has been operational for a number of years, has been described in detail elsewhere (Luft et al., 2003 ▶). Each of the 96 macromolecular samples was submitted to the screening-laboratory pipeline. Crystallization experiments were set up in 1536-well experiment plates (Greiner BioOne, Frickenhausen, Germany) using the microbatch-under-oil method (Chayen et al., 1992 ▶). Each experiment plate contained a single macromolecule solution arrayed with an equal volume of 1536 different crystallization cocktails (400 nl total drop volume) under mineral oil. Images were recorded using a custom-built plate reader. The reader was constructed from a Parker Daedal 300000 AT series 30-inch xy translation stage with ZETA57-83 motors and a QImaging Microimager 12-bit cooled FireWire camera (Kodak KAI-2020 sensor, 1600 × 1200 pixels), with a Nikon 12× telecentric zoom lens and 1× coupler, controlled using software developed in-house. Images were recorded 1 d after the addition of the protein solution and weekly thereafter for four weeks. Images were archived in uncompressed TIFF format, but to ease the data-handling and computer-hardware requirements images used for the visual classification study were converted to JPEG format. The images were randomly assigned into four groups sampling the weekly reads, each group being comprised of 24 macromolecules.
2.3. Image distribution
The 96 macromolecules chosen for the classification generated 147 456 images, i.e. 96 samples with 1536 images per sample. These images were randomized into six subsets of 16 × 1536 images and distributed amongst eight viewers. Each viewer received three of these six subsets such that they classified one half of all images. The distribution was designed so that each image was scored by three viewers with an equal distribution of images among the three viewers for cross-validation. Each scorer scored images over a period of ∼4 months.
2.4. Image-scoring software
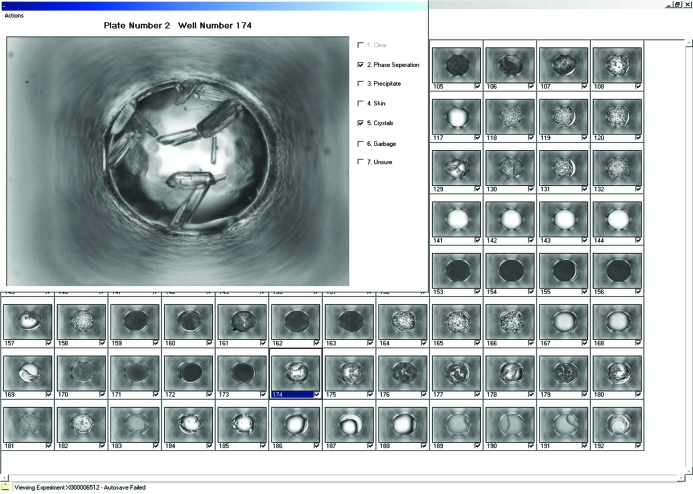
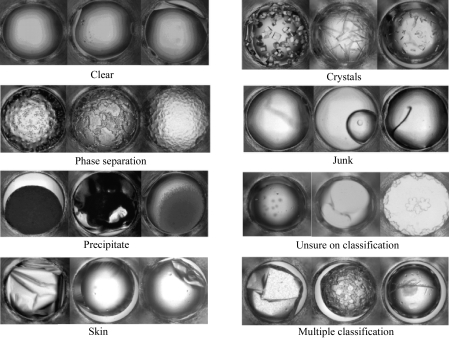
The software (MacroScope) used to view and classify the 632 × 504 pixel images was developed in-house. Images (632 × 504 pixels) were displayed in 16 groups of 96 thumbnail images. A full-sized view of a thumbnail was selected for closer inspection (Fig. 2 ▶). The images were presented to the viewers with no chemical information or other distinguishing features (as opposed to the default mode for the program). Each image was visually classified into seven categories: clear, phase separation, precipitate, skin, crystals, junk and unsure (Fig. 3 ▶). With the exception of clear, combinations (two or more) of all other categories were allowed. The classifications were based upon an initial analysis of a subset of images by the scorers. They represent a balance between having too few categories to accurately describe the outcomes and having too many categories, which makes the scoring effort more time-consuming, cumbersome and less accurate. A pre-defined reference table of classified images (see supplementary material1) was available to the scorers throughout the classification study, providing a reference set for visual comparison.
Figure 2.
Screenshot of the MacroScope visualization software, displaying 96 crystallization images at a time, overlaid with a magnified scoring window.
Figure 3.
Examples illustrating multiple forms of the seven classifications used in the study: clear, phase separation, precipitate, skin, crystals, junk and unsure. Junk is used for cases with suspected contamination in the well or liquid-handling malfunctions etc.
2.5. Controls
It was anticipated that visual classification of >55 000 images would take some time. As the image classification progressed and the viewers gained experience, there was a concern that consistency would be affected. To monitor and address this concern, a control was established. One set of 1536 randomized images from two macromolecules that had crystals was used to monitor both individual and collective agreement among the viewers. All eight viewers classified this set prior to starting the image-classification study, halfway through the study and after the last non-control image set had been classified.
3. Results
3.1. Consistency in classification
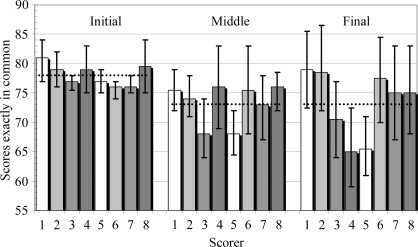
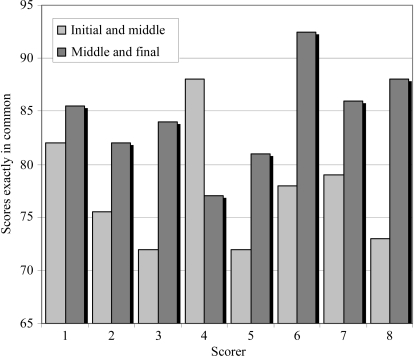
An analysis of the classifications from the control set of images at the start, middle and end of the study showed that 78% of the images had classifications exactly the same at the start, decreasing to 73% for the middle and final classification of the control set (Fig. 4 ▶). Breaking this data down by scorer (Fig. 5 ▶), the average agreement between scores in the first and middle scoring of the control set is 77%, rising to 84% for the agreement in scores between the middle and final scoring. This change in classification over time is probably extenuated by the ability to give images multiple classifications. For example, an image classified as a crystal in the first viewing may be classified as a crystal with precipitate in the second analysis. This would be counted as a different result given our deliberately strict definition of common classifications.
Figure 4.
Graph showing the percentage of scores in common between the scorers for the control data set at the beginning, middle and end of the image-analysis study. The average values are indicated by dashed lines. The error bars indicate the standard deviation of the average agreement between other scorers.
Figure 5.
Graph showing the percentage of scores in common between the initial and middle scoring of the control data set and the scores in common between the middle and final scoring of the control data set as a function of the scorer.
3.2. Outcomes of classification
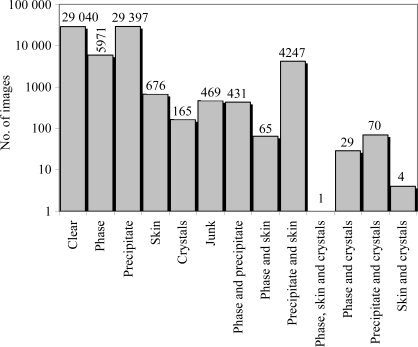
Approximately 48% (∼70 000) of the 147 456 images were unanimously classified by three separate viewers. The outcomes from these classifications are shown in Fig. 6 ▶. Of these images, 42% were classified as precipitate only, 41% as clear and 8% as phase separation only. When a majority classification was considered, i.e. agreement between two out of three viewers, 54% of the 147 456 images were classified as precipitate and 30% as clear. In the minority case, one out of three viewers, 8.3% were classified as precipitate versus 5.7% as clear. In the unanimously classified images used to establish the training set, a fraction (0.4%) were classified as containing a crystal, i.e. a likely lead condition. Lead-condition hits were identified by two or more viewers for 49 of the 96 different macromolecules in the study, a success rate of ∼51%. For unanimous agreement between all three viewers, the success rate fell to ∼37%, i.e. 36 of 96 macromolecules were classified as containing a crystal. Finally, for 92 of the macromolecules at least one hit was identified by a single viewer. Approximately 45 000 images are associated with cocktails in groups 1 and 2. These cocktails constitute the incomplete factorial portion of the HWI 1536-cocktail screen and were the focus of biochemical analysis of crystallization trends. Out of the total set of images attributed to cocktails in groups 1 and 2, 46% were classified as precipitate only, 36% as clear, 9% as phase separation only and 0.2% as containing crystals. Group 3, the commercial screens, do not as a collective have a true incomplete factorial sampling of chemical space, so only limited information about trends can be extracted from these data.
Figure 6.
Graph of the distribution of 70 565 images where there was complete agreement in the classification between three scorers. In the case of the multiple classification phase, skin and crystal, the number of images is too small to show on the logarithmic scale.
3.3. Analysis of the results
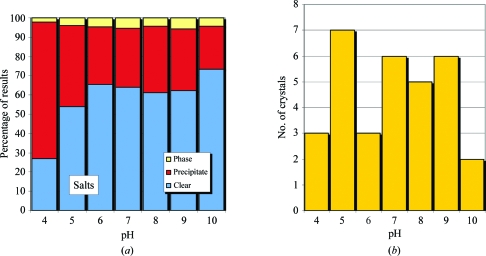
In Fig. 7 ▶(a), the relative distribution of phase separation, precipitate and clear is shown as a function of pH for the group 1 highly soluble salts. As the pH increases, the ratio of clear to precipitate also increases. Phase separation appears to have little or no correlation with pH. Crystals are distributed throughout the conditions sampled (Fig. 7 ▶ b), with no clear pH effect. The salts have been analyzed as a function of phase separation, precipitate and clear for pH and salt concentration (Figs. 7 ▶ c, 7 ▶ d and 7 ▶ e).
Figure 7.
(a) Relative distribution of phase separation, precipitate and clear results for salt conditions; (b) the number of crystal hits observed.
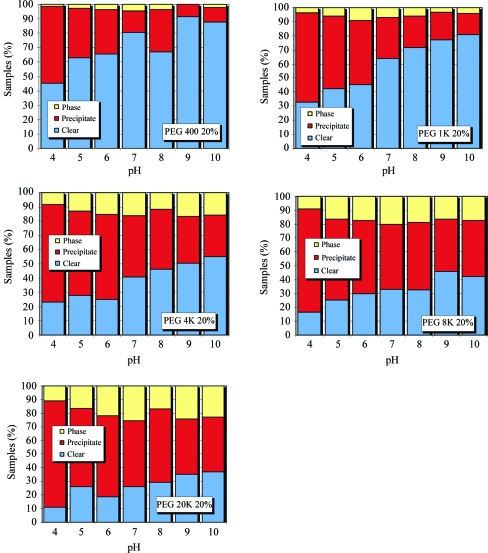
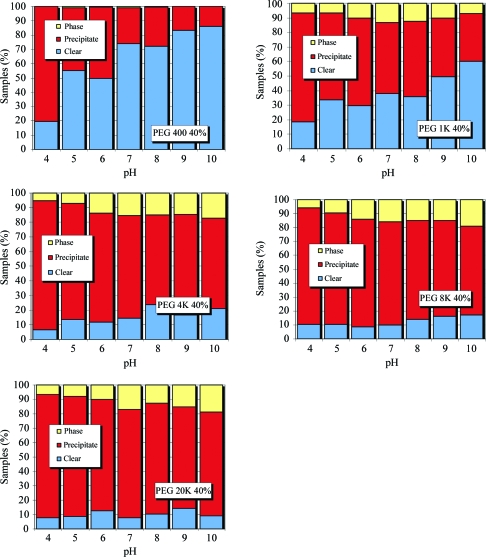
In Figs. 8 ▶ and 9 ▶, the group 2 PEGs have been subdivided into 20% and 40% concentrations, respectively. For the 20% PEG cases (Fig. 8 ▶) as the pH increases the proportion of clear to precipitate again increases. More phase separation is observed than in the group 1 cases, but again this phase separation does not seem to be dependent on pH. As the molecular weight of the PEG increases, the chance of precipitation also increases. This is particularly dramatic in the case of the 40% PEGs (Fig. 9 ▶). As the molecular weight of the PEG increases, the ratio of clear to precipitate decreases significantly.
Figure 8.
Relative distribution of phase separation, precipitate and clear results for various molecular-weight PEGs at 20% concentration as a function of pH.
Figure 9.
Relative distribution of phase separation, precipitate and clear results for various molecular-weight PEGs at 40% concentration as a function of pH.
3.4. Crystals
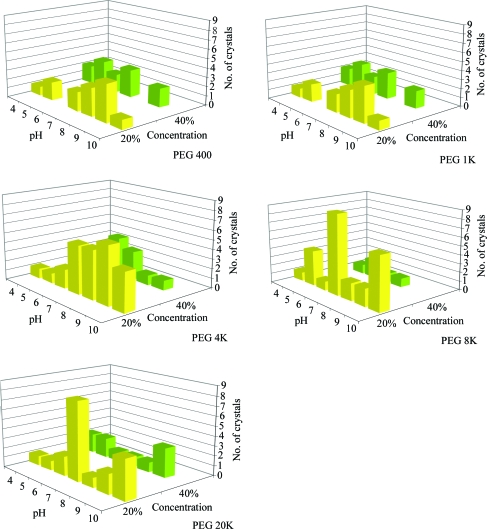
The group 1 conditions that produced crystals are shown in Fig. 7 ▶(b). The group 2 conditions that produced crystals for the 20% and 40% PEG conditions are shown in Fig. 10 ▶. This group comprises 136 crystals seen in over 70 000 images, representing 0.2% of the images. These results suggest that the lower concentration of PEG (20%) supports crystallization with a reduced dependence on pH. As will be addressed in §4, this observation is misleading and is likely to be caused by the limited number of crystals contained within the sample data.
Figure 10.
Relative distribution of crystal results for various molecular-weight PEGs at 20% and 40% concentration as a function of pH.
4. Discussion and concluding remarks
The classification of images showing the results of crystallization experiments can vary significantly between viewers and between samples. While it is easy to agree on cases where a large well defined crystal is seen or where the drop is completely clear, the task becomes more difficult where a precipitate has microcrystals within it, a phase separation produces small features that make it harder to distinguish from potential crystals or ‘something’ is seen within an otherwise clear drop. The task can also be affected when a macromolecule produces very few potential hits and standards can slip for the classification of a lead. Similarly, for a macromolecule that shows hits in many conditions, the criteria can subconsciously become stricter. Our control experiment enabled us to investigate this phenomenon. Over 48% of the full 147 456 images were classified identically by three viewers. Given that seven different categories were available and multiple classifications were allowed for every case except for clear, this represented a remarkable level of agreement. The viewers represented varied expertise in crystallization, with one trained as part of the experiment and others with many years of crystallization experience. There was no relationship between experience and agreement of classification in the control data set (data not shown). When the majority scores were considered, 30% of the 147 392 images were classified as clear and 54% as precipitate; in the minority case these values dropped to 5.7% and 8.3%, respectively. It seems that unanimous classification of a clear drop is easier than for a precipitate. The choice to allow multiple outcomes was taken at the outset of the study as previous images showed many cases where a single outcome inadequately described the result. This was true with the images viewed in this study; we do not know how the results would be influenced if only a single outcome was allowed or if the classifications could be weighted by the viewer.
A large number of images from the study were classified as either precipitate or clear (∼83%), with similar proportion for each of the two classes. This is not surprising given that the crystallization screen is designed to bracket potential crystallization conditions that lie in between precipitate and clear. Automated identification of just two categories, clear and precipitate, would eliminate ∼83% of the images, leaving only ∼17% to be categorized by further more intensive image-analysis techniques.
It was obvious that the ratio of clear to precipitate for the group 2 PEG results decreased as the pH increased. This was particularly apparent for the low-molecular-weight PEGs. With increasing PEG molecular weight, precipitate started to dominate the outcomes. At 40% PEG concentration, the predominant outcome of the PEG 4K–20K examples was precipitate. Analyzing the crystal results (Fig. 10 ▶), it would seem that this precipitation was an indication that the PEG concentration was too high and precipitation rather than crystallization was being promoted. The number of crystal samples in the data was small and in a companion analysis of crystals resulting from 269 macromolecules supplied by the structural genomics community (Snell et al., 2008 ▶) the data indicated exactly the opposite: regions showing increased precipitation were correlated with those where crystallization was more likely to occur.
The main aim of this study was to provide a large and broad training and test set of classified images for the development of image-analysis techniques. The data set provides a large number of labeled images representing typical crystallization outcomes for a biochemically diverse collection of macromolecules. The results are limited by the low frequency of crystal examples observed. The images that were classified identically by three viewers were used to form a training set and the images that had divergent classifications were used to form a set of problem images. As mentioned above, a companion study was performed in which crystal hits were identified from 269 macromolecules and the images were extracted (Snell et al., 2008 ▶). These crystal images have been combined with the images from the training set developed here to supplement the sparsely populated crystal category. These data are now being used to develop software for image classification. The truth data set supplemented with crystal outcomes is available for other developers on request.
The HWI high-throughput crystallization laboratory is a unique resource. Since its inception, every macromolecule that has come through the laboratory has been consistently screened and the results have been imaged and archived together with biochemical information. Screening has taken place using an incomplete factorial sampling of chemical space combined with commercial screens that have evolved over the years. The laboratory has acted as a service to the general biological crystallization community in addition to screening samples from a number of structural genomics centers. To date, over 10 000 macromolecules have been screened by the laboratory using a consistent protocol. This has generated over 15 million crystallization experiments with 90 million associated images. The macromolecules screened in the laboratory are from a biochemically diverse population. The development of automated image analysis, combined with biochemical data from the macromolecules and the incomplete factorial approach used to design the cocktails from the outset, provides a rich source of data, the analysis of which will provide a unique insight into crystallization. The establishment of this training set represents an initial but major step in this direction.
Supplementary Material
Supplementary material file. DOI: 10.1107/S0907444908028047/bw5257sup1.pdf
Acknowledgments
We would like to acknowledge Dan Miller for discussions on image distribution between the observers. Jennifer Wolfley is thanked for her contributions. The John R. Oishei Foundation, the Cummings Foundation and NIH grants U54 GM074899-01, U54 GM07495-04 and GM-64655 are acknowledged for funding support.
Footnotes
Supplementary material has been deposited in the IUCr electronic archive (Reference: BW5257). Services for accessing this material are described at the back of the journal.
References
- Audic, S., Lopez, F., Claverie, J. M., Poirot, O. & Abergel, C. (1997). Proteins, 29, 252–257. [DOI] [PubMed]
- Bern, M., Goldberg, D., Stevens, R. C. & Kuhn, P. (2004). J. Appl. Cryst.37, 279–287.
- Berry, I. M., Dym, O., Esnouf, R. M., Harlos, K., Meged, R., Perrakis, A., Sussman, J. L., Walter, T. S., Wilson, J. & Messerschmidt, A. (2006). Acta Cryst. D62, 1137–1149. [DOI] [PubMed]
- Chayen, N. E., Shaw Stewart, P. D. & Blow, D. M. (1992). J. Cryst. Growth, 122, 176–180.
- Cumbaa, C. & Jurisica, I. (2005). J. Struct. Funct. Genomics, 6, 195–202. [DOI] [PubMed]
- Cumbaa, C. A., Lauricella, A., Fehrman, N., Veatch, C., Collins, R., Luft, J. R., DeTitta, G. & Jurisica, I. (2003). Acta Cryst. D59, 1619–1627. [DOI] [PubMed]
- Kawabata, K., Saitoh, K., Takahashi, M., Sugahara, M., Asama, H., Mishima, T. & Miyano, M. (2006). Acta Cryst. D62, 1066–1072. [DOI] [PubMed]
- Luft, J. R., Collins, R. J., Fehrman, N. A., Lauricella, A. M., Veatch, C. K. & DeTitta, G. T. (2003). J. Struct. Biol.142, 170–179. [DOI] [PubMed]
- Mayo, C. J., Diprose, J. M., Walter, T. S., Berry, I. M., Wilson, J., Owens, R. J., Jones, E. Y., Harlos, K., Stuart, D. I. & Esnouf, R. M. (2005). Structure, 13, 175–182. [DOI] [PubMed]
- Miyatake, H., Kim, S.-H., Motegi, I., Matsuzaki, H., Kitahara, H., Higuchi, A. & Miki, K. (2005). Acta Cryst. D61, 658–663. [DOI] [PubMed]
- Snell, E. H., Lauricella, A. M., Potter, S. A., Luft, J. R., Gulde, S. M., Collins, R. J., Franks, G., Malkowski, M. G., Cumbaa, C., Jurisica, I. & DeTitta, G. T. (2008). Acta Cryst. D64, 1131–1137. [DOI] [PMC free article] [PubMed] [Google Scholar]
- Walker, C. G., Foadi, J. & Wilson, J. (2007). J. Appl. Cryst.40, 418–426.
- Wilson, J. (2002). Acta Cryst. D58, 1907–1914. [DOI] [PubMed]
- Wilson, J. & Main, P. (2000). Acta Cryst. D56, 625–633. [DOI] [PubMed]
- Zuk, W. M. & Ward, K. B. (1991). J. Cryst. Growth, 110, 148–155.
Associated Data
This section collects any data citations, data availability statements, or supplementary materials included in this article.
Supplementary Materials
Supplementary material file. DOI: 10.1107/S0907444908028047/bw5257sup1.pdf


