Abstract
Galectin-1, a member of a family of evolutionarily conserved glycan-binding proteins, binds specifically to poly-N-acetyllactosamine-enriched glycoconjugates. Through interactions with these glycoconjugates, this protein modulates inflammatory responses and contributes to tumor progression and immune cell homeostasis. The carbohydrate recognition domain includes the single protein tryptophan (Trp68). UV Resonance Raman spectroscopy and molecular dynamic simulation were used to examine the change in the environment of the Trp on ligand binding. The UV Raman spectra and the calculated water radial distribution functions show that, while no large structural changes in the protein follows lactose binding, substantial solvent reorganization occurs. These new insights into the microscopic role of water molecules on Gal-1 binding to its specific carbohydrate ligands provides a better understanding of the physicochemical properties of Gal-1-saccharide interactions, which will be useful for the design of synthetic inhibitors for therapeutic purposes.
It is widely known that interactions and binding between biomolecules involves solvent redistribution. Water molecules which are tightly associated to the binding surface occupy specific positions and orientations, and must vacate their positions in order to allow a proper binding. During the past few years we focused our interest in studying the structural and dynamic properties of galectin-1 (Gal-1) involving binding to specific carbohydrates ligands.
Gal-1, a β-galactoside-binding protein, widely expressed in the animal kingdom, is a polypeptide containing 134 amino acids, which exist in a reversible monomer-dimer equilibrium.(1, 2) This glycan-binding protein has been shown to play an important role in cell growth regulation and differentiation, (3) and most recently it has been shown to be involved in the modulation of innate and adaptive immune responses.(4-7) Through specific interactions with glycoconjugate ligands, Gal-1 has emerged as a powerful regulator of inflammatory responses and tumor progression.(2, 5) In this context, elucidation of the molecular mechanisms leading to Gal-1-glycan interactions is highly relevant for the design of novel synthetic inhibitors to control in vivo activity. Figure 1 shows a ribbon model representation of Gal-1 in its homodimeric form.
Figure 1.
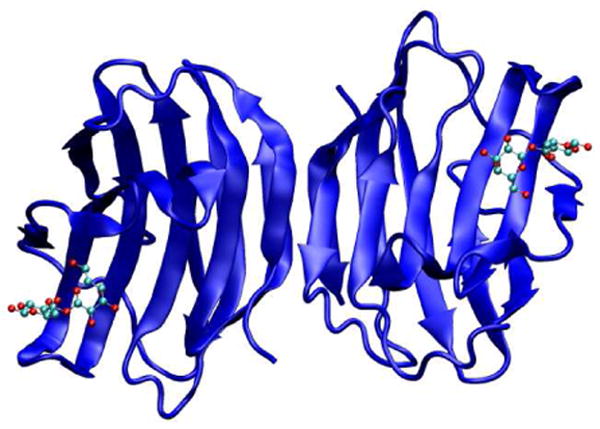
Representation of the homodimeric form of human Gal-1 with lactose bound to the carbohydrate recognition domains of each monomer. PDB code 1W6O.
The carbohydrate recognition domain (CRD) of Gal-1 consists of a deep channel, an antiparallel β-sandwich which includes mostly amino acids 44 to 71. This site is involved in the binding between Gal-1 and a large series of natural in vivo ligands, including glycoproteins with a terminal β-linked galactosyl residue, (1) such as laminin, fibronectin, CD45, αβ integrins, and glycolipids such as GM1.(8-12) The binding of the galactosyl terminal residues to the CRD of Gal-1 involves at least two major interactions(13): hydrophilic interactions, via an extensive complementary hydrogen bonding network; and hydrophobic interactions, between sugar rings and aromatic amino acid side chains in the CRD. In particular, Trp68 participates in stacking interactions with carbons C3, C4 and C5 on the β face of the galactose ring, as shown in Figure 2. This fragment appears to be crucial for distinguishing galactose from glucose through its strict preference for the axial C4−OH, allowing intimate C-H/π- cloud interactions.(13)
Figure 2.
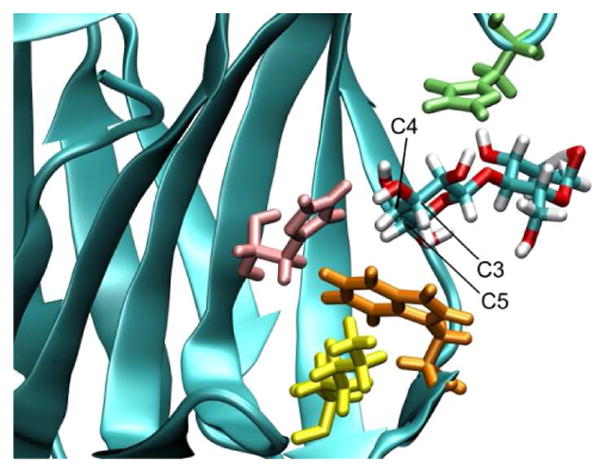
Representation of Gal-1 CRD showing the bound lactose and interacting amino acids: histidine 44 (pink), histidine 52 (green), tryptophan 68 (orange). Note that one face of the Trp 68 side chain stacks on the sugar ring, while the other interacts with lysine 63 (yellow).
The binding between lectins and their ligands has been studied by techniques, such as isothermal titration microcalorimetry, (14) NMR, (15) and molecular dynamic simulations.(16) Furthermore, galectins and galectin-oligosaccharide complexes have been subjects of diverse studies, (17, 18) some of which examined the molecular basis for ligand recognition.(13) The reported crystal structures of Gal-1 in free and ligand-bound states show at least three crucial water molecules participating in a hydrogen bond network in the CRD, two of them being displaced upon ligand binding.(19) Recently, by using MD simulations, we identified eight water sites (ws) in the CRD of Gal-1.(20) Water sites were defined as confined space regions close to the protein surface showing a high probability for finding a single water molecule inside them along the simulations. The positions of the ws were defined by the coordinates of the maximum probability point using as reference surface residues of the protein which are able to interact favorably with the water. Four of the eight ws described in the CRD of Gal-1 were shown to be replaced by −OH of the incoming ligand.(20)
It is well known that UV Resonance Raman spectroscopy is a powerful tool to monitor the conformations of proteins.(21-23) Excitation at 229 nm occurs within the electronic transition of tryptophan aromatic ring. Thus, indole ring vibrations are selectively enhanced and give rise to strong resonance Raman spectra.(24) When the indole ring of Trp is exposed to hydrophobic environments, the Trp absorption band red shifts the maximum towards the 229 nm excitation which increases the enhancement of the Trp Raman bands.(22-26) As will be further discussed, the Trp Raman spectra reveals not only its hydrophobic/hydrophilic environment but also its hydrogen-bonding state.(27)
In the work here, we present the first vibrational study of Gal-1, analyzing the UVRR spectra of Trp68 residue in solvated Gal-1 in the ligand-free and ligand-bound states. We compared the conformations, hydrogen-bonding states and the local environment of Trp68 in the presence and absence of the sugar and compared the spectroscopic results to those from MD simulations.
Materials and Methods
Preparation of recombinant Gal-1
Recombinant human Gal-1 was obtained as previously described.(28) Briefly, E. coli BL21 (DE3) cells were transformed with a plasmid containing the Lgals1 gene inserted in the expression vector pET (Novagen) and production of recombinant Gal-1 was induced at the log-phase by the addition of 1 mM isopropyl-beta-D-thiogalactoside. Cells were separated by centrifugation, washed and disrupted by sonication. Debris was separated by centrifugation at 10,000 × g and soluble fractions were obtained for subsequent purification by affinity chromatography on a lactosyl-Sepharose column (Sigma-Aldrich). The purification procedure was performed as described earlier.(29) The recombinant human Gal-1 was stored in a DTT buffer to preserve disulfide protein crosslinks that may affect the activity, as was previously described.(30)
229 UV resonance Raman experiments
The UV resonance Raman (UVRR) spectrometer has been described in detail elsewhere.(31) 229 nm excitation was produced by an intracavity frequency doubling of an Ar+ laser (Coherent, Innova FReD 300). This UV beam was then focused onto the interior surface of a rotating fused silica NMR tube (Wilmad) filled with ∼0.5 ml of the sample solution. In order to minimize photodegradation, the laser power was maintained at 100 μW. The solution was stirred extensively with a 0.5 mm length magnetic stirring bar. Additionally, a Teflon wire with a flat tip was placed inside the tube just above the area of incident light to induce turbulence. The lack of degradation of the sample under these conditions was ensured within the first 10 minutes of data collection. No differences were observed in the intensity of the data collected in the tenth minute with respect to those obtained in the first minute. A 180° backscattering geometry was used for the Raman measurements. In all experiments, we used 1 mg/ml concentration of Gal-1 in a phosphate buffered saline solution, which yields a 70 μM concentration of Trp. Samples of the Gal-1–lactose complex were prepared by adding lactose to a final concentration of 30 mM. As the value of the Gal-1 affinity constant reported for lactose at room temperature is Kb = 3.25 × 10³ M-1, (19) the lactose concentration used ensures that more than 97% of the protein is bound. The Raman spectra of Gal-1 and Gal-1–Lac in the presence of 0.2 M NaClO4 used as an internal standard were also measured.
Molecular dynamics simulations
Gal-1 coordinates were retrieved from the Protein Data Bank, code 1W6N for the unbound protein (X-ray, 1.65 Å resolution) and code 1W6O for the Gal-1–Lac complex. The C2S mutant (wild type cysteine in position 2 replaced by a serine) was used, due to the availability of crystallographic data for the mutant protein and the mutant bound to different ligands.(13, 20) Since the C2S mutation is located far away from the CRD, we assume that it will not affect binding.
In both cases, all crystallographic water molecules were deleted, and a single subunit was then solvated with three-site point charge modeled (TIP3P) water molecules in an octahedral box. The MD simulations were performed using the AMBER 8(32) package of programs, with the PARM99 set of parameters(33) and the GLYCAM-04 parameters for carbohydrates.(34)
The equilibration protocol consisted in performing 500-cycle runs of minimization in order to remove initial unfavorable contacts, followed by 100 ps simulations, during which systems were slowly heated up from 0 K to the desired temperature of 300 K. The pressure was then equilibrated at 1 atm over 200 ps.
All simulations used the periodic boundary conditions approximation and Ewald summation method, with an 8 Å cut-off. The SHAKE algorithm was applied to all hydrogen-containing bonds. The MD simulations were performed at 300 K, using a 2-fs time-step. All atoms in the simulated systems were allowed motional freedom.
Snapshots of the coordinates were saved every 2 ps, over a total 20 ns of trajectory. The resulting 10000 instantaneous configurations saved on disk for each system were then analyzed.
In addition, a 5 ns simulation was performed for an isolated and solvated Trp amino acid. The MD simulation was performed using the same computational setup described above.
Results and Discussion
Excitation of Trp at 229 nm changes upon binding
Figure 3 shows the 229 nm excited resonance Raman spectra of Gal-1 and Gal-1–Lac and the difference spectrum. The dominant bands in the spectra at 762, 877, 1011, 1356, 1557, 1622 cm-1 derive from Trp and Tyr residues of Gal-1 which are assigned to Trp W18, W17, W16, W7, W3 vibrations and Tyr Y8a vibration, respectively. Since lactose is not resonance enhanced for 229 nm excitation, it does not make any contribution to the Raman spectra.
Figure 3.
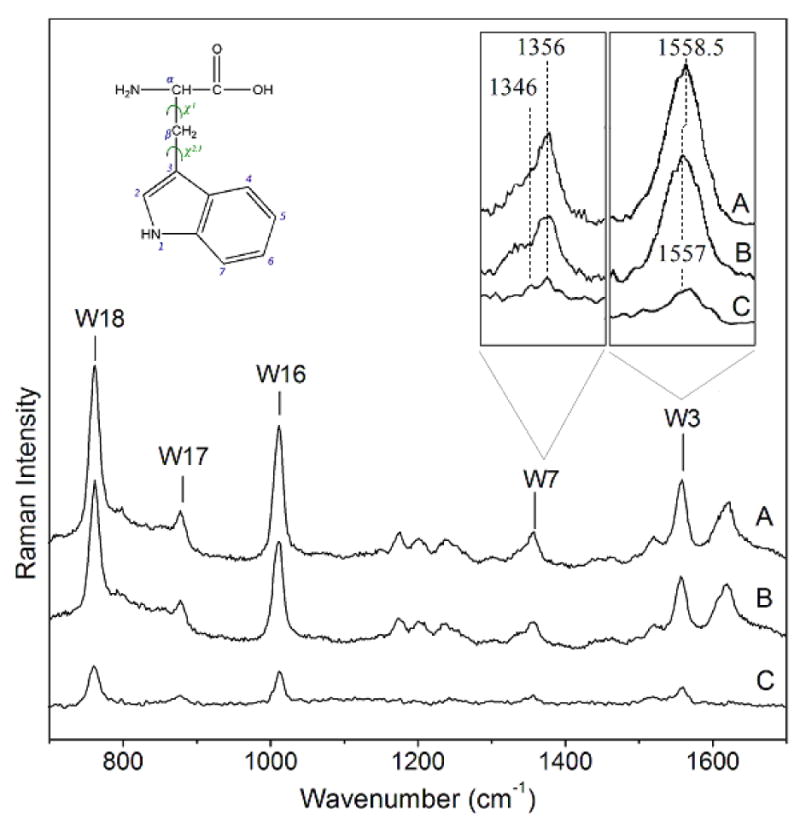
The 229 nm resonance Raman spectra of A) Gal-1–Lac, and B) Gal-1. The intensities were normalized with respect to the Tyr Y8a band. C) Difference spectrum obtained by A-B. Note that the difference spectrum shows only Trp signals. In insets, W3 band shift can be better visualized and it is clearly shown that the W7 I1356/I1346 ratio decreases from A to B (Gal-1 bound to unbound state, respectively).
Binding of lactose results in intensity increase of the Trp bands, as clearly evident in the difference spectrum (Figure 3C). No Tyr band features appear in the difference spectrum, as expected since Tyr residues in Gal-1 are not localized in the binding site and are not directly involved in binding.
The intensity increase of the Trp bands of the Gal-1–Lac complex supports the idea that the incoming ligand excludes water from the indole ring surroundings, giving rise to a more hydrophobic environment around the Trp.
In separate experiments, we evaluated the usage of a salt as an internal standard in order to quantitatively measure Raman intensities. While many salts were not considered due to interactions altering the protein function, (19) the commonly used(35) sodium perchlorate was then evaluated. We measured the UVRR spectra of Gal-1 and Gal-1–Lac in the presence and absence of perchlorate and found that perchlorate affects the binding of lactose to Gal-1, since a much lower Trp bands intensity increase occurs in the presence of perchlorate. We presume that perchlorate oxidizes the thiol groups of cysteines causing a decreased affinity to glycan ligands, as reported previously.(19)
Tryptophan side chain orientation
The 1557 cm-1 Raman peak derives from the Trp W3 indole in-plane ring vibration, which has a large component of C2=C3 stretching. The frequency of W3 depends on the torsion angle (X2,1) involving the C2=C3-Cβ-Cα linkage. Takeuchi found a quantitative relationship between X2,1 and the W3 frequency and from this relationship we can estimate a X2,1 angle for non lactose bound Trp68 in Gal-1 of 114.4°, which is in agreement with the value obtained from the crystal structure (120.3°). Upon binding lactose the W3 frequency upshifts ∼1.5 cm-1, resulting in an angle of 120°, which is close to the upper limit of the W3 frequency-X2,1 relationship.(36) Table 1 lists the X2,1 torsion angles for Gal-1 and the Gal-1–Lac complex obtained from the Raman data, the crystal structure and the MD simulations.
Table 1.
Trp C2=C3-Cβ-Cα X2,1 dihedral angle. Values are given in degrees. a: extracted from the crystal structures(19), b: average value over the snapshots from the MD simulations of each system, c: evaluated according to Takeuchi, et al.(36)
| Crystala | MDb | Ramanc | |
|---|---|---|---|
| X2,1 (Gal-1) | 120.3 | 96.8 | 114.4 |
| X2,1 (Gal-1–Lac) | 119.3 | 101.2 | ∼120.0 |
| ΔX2,1 | -1.0 | 4.4 | ∼5.6 |
MD simulations predict a lower X2,1 angle of ∼100º and a small increase of 4.4° for this angle in the Gal-1–Lac complex. The Raman, crystal and MD results all indicate a lack of significant conformational changes around the C3-Cβ bond for Gal-1 upon lactose binding.
Nitrogen hydrogen-bonding state
The Trp W17 vibration involves a benzene υ12-like vibration from the phenyl ring which couples to N-H bond motion.(27) The W17 frequency is sensitive to the hydrogen-bonding state of the indole NH.(37) In the absence of NH hydrogen bonding, the W17 band appears at 883 cm-1, while strong hydrogen bonding downshifts the band to 871 cm-1. In the spectrum of Gal-1 this vibrational mode is observed in the middle of the frequency range (877 cm-1), indicating that the indole NH group is moderately hydrogen bonded to a proton acceptor.(36) This is consistent with both the MD simulations results which indicate the presence of a ws interacting with the Trp NH group in the solvated protein, (20) and with the crystal structure of Gal-1 where the indole nitrogen appears oriented toward the protein surface and is close to a water molecule (N---O= 3.72 Å).(19) No W17 band frequency change is observed upon lactose binding, suggesting that the lactose does not directly interacts with the indole NH group. The moderate strength of the NH hydrogen bond in the lactose-bound state is consistent with the presence of surface water molecules; in the crystal structure of the complex, two surface water molecules are observed in the vicinity of Trp68 (N---O= 2.87 Å and 2.99 Å).(19)
Figure 4 shows the radial distribution function g(r) for water molecules about the indole nitrogen of the Trp in the three situations: as an isolated amino acid in water, as the Trp68 residue in Gal-1 and in the Gal-1–Lac complex. While the nitrogen of the isolated Trp does not show a structured solvation shell, the Trp68 of both Gal-1 and Gal-1–Lac complex show a peak in g(r) at 2.9 Å, corresponding to water molecules involved in hydrogen bonds to the nitrogen. The higher probability of finding localized water molecules around the indole nitrogen in the Gal-1–Lac complex observed in MD simulations is in agreement with the presence of water molecules close to that nitrogen observed in the crystallographic structure.
Figure 4.
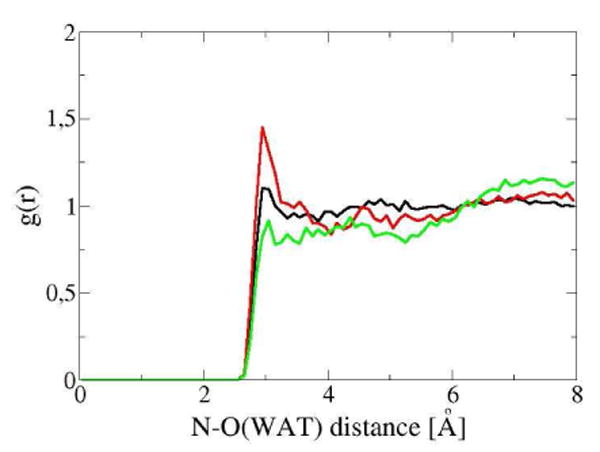
Water radial distribution function for the nitrogen of the side chain of: the Trp68 of Gal-1 (black), the Trp68 of the Gal-1–Lac complex (red), and the isolated Trp in water (green), obtained from MD simulations.
Hydration environment
The W7 band gives further insights into the dependence of Trp hydration upon lactose binding. The W7 band of Trp usually splits into a doublet at ∼1360 and 1340 cm-1 due to Fermi resonance between a fundamental band of an in-plane vibration and one or more combination out-of-plane vibrations. The intensity ratio of the doublet changes with the environmental hydrophobicity around the indole ring: the stronger the hydrophobicity, the higher the intensity ratio I1360/I1340.(37, 38) The frequency of the out-of-plane vibrations are affected by hydrophobic interactions of the indole ring, which alters the doublet relative intensity ratio. In the UVRR spectra of Gal-1 and Gal-1–Lac the main component of the W7 doublet is observed at 1356 cm-1 with a broad shoulder indicating the second component. In the difference spectrum both Fermi resonance components are clearly observed at 1356 and 1346 cm-1. The change to a more hydrophobic environment for the Trp in the binding site as a consequence of lactose addition is well supported by the extra intensity of the 1356 cm-1 W7 Fermi doublet component over the 1346 cm-1 component.
The spectral evidence observed for the hydration environment of the Trp68 may also be explained in terms of the water radial distribution functions for the side chain of the residue, shown in Figure 5. The g(r) was computed for water molecules around the center of mass determined by the heavy atoms of the six-membered ring.
Figure 5.
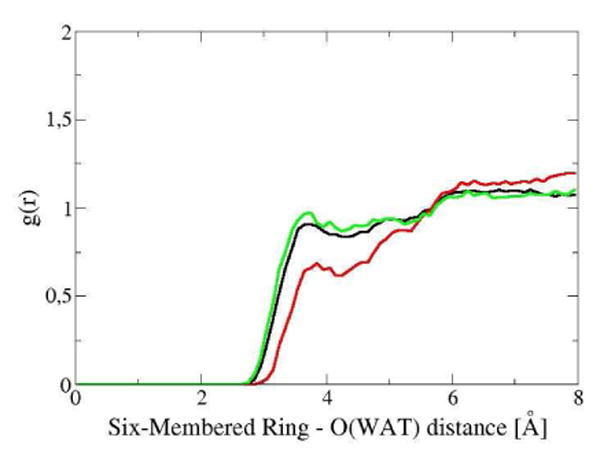
Water radial distribution function for the six-membered ring of the side chain of: the Trp68 of Gal-1 (black), the Trp68 of the Gal-1–Lac complex (red), and the isolated Trp in water (green), obtained from MD simulations.
The calculated g(r) for the side chain of Trp68 in unbound protein is similar to that for the Trp in water solution, while they show a significant difference with the g(r) calculated for the Trp68 in the Gal-1–Lac complex. It is evident from the functions that the six-membered ring undergoes a noticeable change in its hydration environment, decreasing its solvent exposure when the lactose accesses the CRD. Figure 6 shows that Trp68 side chain in Gal-1 is surrounded by lysine 63 with a significant solvent accessibility on one of its faces, while in Gal-1–Lac complex this residue is involved in the stacking interaction with the galactosyl terminus of the ligand.
Figure 6.
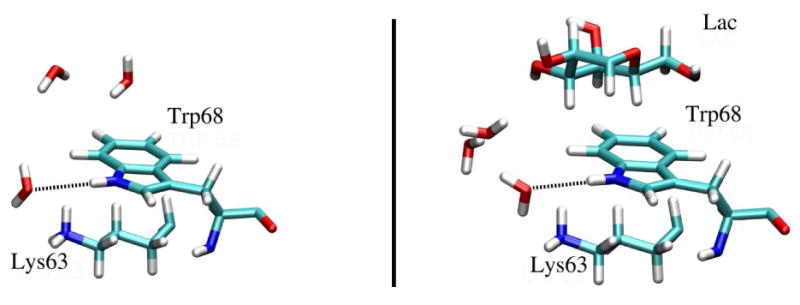
Instantaneous configurations showing interactions between the Trp 68 of Gal-1 and the Lys 63 and a) water molecules in the unbound state (left panel), b) the galactosyl moiety of lactose bound to the CRD (right panel).
Conclusions
Our results indicate that the addition of lactose to Gal-1 does not significantly affect the Trp residue conformation in the binding site since no significant frequency shifts occur for the conformation marker W3 and hydrogen-bonding marker W17 bands. These results are consistent with MD modeling studies. However, as confirmed by the MD simulations, lactose binding results in a more hydrophobic environment of the Trp residue. Subtle solvent reorganization was evaluated by the proposed methodologies. In this regard, both Raman signal intensities and water radial distribution functions confirm that the presence of ligand causes displacement of water molecules in the surroundings of the Trp side chain, while no substantial change was observed in the hydrogen-bond network of the nitrogen of the indolyl group upon binding.
Acknowledgments
SDL thanks Zeeshan Ahmed, Kan Xiong, Diego Croci and Germán Bianco for substantial help on experiments, and Marcelo A. Martí and Darío A. Estrin for important discussions and computational facilities.
Abbreviations
- Gal-1
galectin-1
- CRD
carbohydrate recognition domain
- UVRR
ultraviolet resonance Raman
- MD
molecular dynamics
- ws
water site
- Lac
lactose
Footnotes
This work was partially supported by PIP N° 6059 of CONICET and PICT2004 N° 21601 0f the Agencia Nacional de Promoción Científica y Tecnológica in Argentina, and by NIH Grant GM8RO1EB002053. SDL is a doctoral fellow of CONICET and a Fulbright and Fundación Bunge & Born Junior Researcher. JCDR, RMSA and GAR are members of the research career of CONICET in Argentina.
References
- 1.Cooper DNW, Barondes SH. God must love galectins; he made so many of them. Glycobiology. 1999;9:979–984. doi: 10.1093/glycob/9.10.979. [DOI] [PubMed] [Google Scholar]
- 2.Cho M, Cummings RD. Galectin-1, a beta-galactoside-binding lectin in Chinese hamster ovary cells. I. Physical and chemical characterization. J Biol Chem. 1995;270:5198–5206. doi: 10.1074/jbc.270.10.5198. [DOI] [PubMed] [Google Scholar]
- 3.Toscano MA, Ilarregui JM, Bianco GA, Campagna L, Croci DO, Salatino M, Rabinovich GA. Dissecting the pathophysiologic role of endogenous lectins: Glycan-binding proteins with cytokine-like activity? Cytokine Growth Factor Rev. 2007;18:57–71. doi: 10.1016/j.cytogfr.2007.01.006. [DOI] [PubMed] [Google Scholar]
- 4.Toscano M, Bianco GA, Ilarregui JM, Croci DO, Correale J, Hernandez JD, Zwirner NW, Poirier F, Riley EM, Baum LG, Rabinovich GA. Differential glycosylation of TH1, TH2 and TH-17 effector cells selectively regulates susceptibility to cell death. Nature Immunol. 2007;8:825–834. doi: 10.1038/ni1482. [DOI] [PubMed] [Google Scholar]
- 5.Rabinovich GA, Toscano M, Jackson DA, Vasta G. Functions of cell surface galectin-glycoprotein lattices. Curr Opin Struct Biol. 2007;17:513–520. doi: 10.1016/j.sbi.2007.09.002. [DOI] [PMC free article] [PubMed] [Google Scholar]
- 6.Rabinovich GA. Galectin-1 as a potential cancer target. Br J Cancer. 2005;92:1188–1192. doi: 10.1038/sj.bjc.6602493. [DOI] [PMC free article] [PubMed] [Google Scholar]
- 7.Rabinovich GA, Liu FT, Hirashima M, Anderson A. An emerging role for lectins in tuning the immune response: lessons from experimental models of inflammatory disease, autoimmunity and cancer. Scand J Immunol. 2007;66:143–158. doi: 10.1111/j.1365-3083.2007.01986.x. [DOI] [PubMed] [Google Scholar]
- 8.Elola MT, Wolfenstein-Todel Ç, Troncoso MF, Vasta GR, Rabinovich GA. Galectins: matricellular glycan-binding proteins linking cell adhesion, migration and survival. Cell Mol Life Sci. 2007;64:1679–1700. doi: 10.1007/s00018-007-7044-8. [DOI] [PMC free article] [PubMed] [Google Scholar]
- 9.Andre S, Kojima S, Yamazaki N, Fink C, Kaltner H, Kayser K, Gabius HJ. Galectins-1 and -3 and their ligands in tumor biology. Non-uniform properties in cell-surface presentation and modulation of adhesion to matrix glycoproteins for various tumor cell lines, in biodistribution of free and liposome-bound galectins and in their expression by breast and colorectal carcinomas with/without metastatic propensity. J Cancer Res Clin Oncol. 1999;125:461–474. doi: 10.1007/s004320050303. [DOI] [PubMed] [Google Scholar]
- 10.Walzel H, Schulz U, Neels P, Brock J. Galectin-1, a natural ligand for the receptor-type protein tyrosine phosphatase CD45. Immunol Lett. 1999;67:193–202. doi: 10.1016/s0165-2478(99)00012-7. [DOI] [PubMed] [Google Scholar]
- 11.Gu M, Wang W, Song WK, Cooper DN, Kaufman SJ. Selective modulation of the interaction of alpha 7 beta 1 integrin with fibronectin and laminin by L-14 lectin during skeletal muscle differentiation. J Cell Sci. 1994;107:175–181. doi: 10.1242/jcs.107.1.175. [DOI] [PubMed] [Google Scholar]
- 12.Kopitz J, von Reitzenstein C, Burchert M, Cantz M, Gabius HJ. Galectin-1 is a major receptor for ganglioside GM1, a product of the growth-controlling activity of a cell surface ganglioside sialidase, on human neuroblastoma cells in culture. J Biol Chem. 1998;273:11205–11211. doi: 10.1074/jbc.273.18.11205. [DOI] [PubMed] [Google Scholar]
- 13.Ford MG, Weimar T, Kölhi T, Woods RJ. Molecular Dynamics Simulations of Galectin-1-oligosaccharides Complexes Reveal the Molecular Basis of Ligand Diversity. PROTEINS: Struct Fun Gen. 2003;53:229–240. doi: 10.1002/prot.10428. [DOI] [PMC free article] [PubMed] [Google Scholar]
- 14.Ahmad N, Gabius H, Sabesan S, Oscarson S, Brewer CF. Thermodynamic binding studies of bivalent oligosaccharides to galectin-1, galectin-3, and the carbohydrate recognition domain of galectin-3. Glycobiology. 2004;14:817–825. doi: 10.1093/glycob/cwh095. [DOI] [PubMed] [Google Scholar]
- 15.Asensio JL, Siebert HC, von der Lieth CW, Laynez J, Bruix M, Soedjanaamadja UM, Beintema JJ, Cañada FJ, Gabius H, Jiménez-Barbero J. NMR Investigations of Protein-Carbohydrate Interactions: Studies on the Relevance of Trp/Tyr Variations in Lectin Binding Sites as Deduced from Titration Microcalorimetry and NMR Studies on Hevein Domains. Determination of the NMR Structure of the Complex Between Pseudohevein and N,N′,N″-Triacetylchitotriose. PROTEINS: Struct Fun Gen. 2000;40:218–236. [PubMed] [Google Scholar]
- 16.Clarke C, Woods RJ, Gluska J, Cooper A, Nutley MA, Boons G. Involvement of Water in Carbohydrate-Protein Binding. J Am Chem Soc. 2001;123:12238–12247. doi: 10.1021/ja004315q. [DOI] [PubMed] [Google Scholar]
- 17.Sörme P, Arnoux P, Kahl-Knutsson B, Leffler H, Rini JM, Nilsson UJ. Structural and Thermodynamic Studies on Cation-Pi interactions in Lectin-Ligand Complexes: High-Affinity Galectin-3 Inhibitors through Fine-Tuning of an Arginine-Arene Interaction. J Am Chem Soc. 2005;127:1737–1743. doi: 10.1021/ja043475p. [DOI] [PubMed] [Google Scholar]
- 18.Rabinovich GA, Cumashi A, Bianco GA, Ciavardelli D, Iurisci I, D'Egidio M, Piccolo E, Tinari N, Nifantiev N, Iacobelli S. Synthetic lactulose amines: novel class of anticancer agents that induce tumor-cell apoptosis and inhibit galectin-mediated homotypic cell aggregation and endothelial cell morphogenesis. Glycobiology. 2005;16:210–220. doi: 10.1093/glycob/cwj056. [DOI] [PubMed] [Google Scholar]
- 19.Lopez-Lucendo MF, Solis D, Andre S, Hirabayashi J, Kasai K, Kaltner H, Gabius HJ, Romero A. Growth-regulatory human galectin-1: crystallographic characterisation of the structural changes induced by single-site mutations and their impact on the thermodynamics of ligand binding. J Mol Biol. 2004;343:957–970. doi: 10.1016/j.jmb.2004.08.078. [DOI] [PubMed] [Google Scholar]
- 20.Di Lella S, Marti MA, Alvarez RMS, Estrin DA, Díaz Ricci JC. Characterization of the Carbohydrate Recognition Domain of Galectin-1 in Terms of Solvent Occupancy. J Phys Chem B. 2007;111:7360–7366. doi: 10.1021/jp068989k. [DOI] [PubMed] [Google Scholar]
- 21.Asher S. UV Resonance Raman spectroscopy for analytical, physical, and biophysical chemistry. Anal Chem. 1993;65:201–210. doi: 10.1021/ac00052a001. [DOI] [PubMed] [Google Scholar]
- 22.Chi Z, Asher S. UV resonance Raman determination of protein acid denaturation: selective unfolding of helical segments of horse myoglobin. Biochemistry. 1998;37:2865–2872. doi: 10.1021/bi971161r. [DOI] [PubMed] [Google Scholar]
- 23.Ahmed Z, Beta IA, Mikhonin AV, Asher S. UV-Resonance Raman Thermal Unfolding Study of Trp-Cage Shows That It Is Not a Simple Two-State Miniprotein. J Am Chem Soc. 2005;127:10943–10950. doi: 10.1021/ja050664e. [DOI] [PubMed] [Google Scholar]
- 24.Chi Z, Asher S. UV Raman Determination of the Environment and Solvent Exposure of Tyr and Trp Residues. J Phys Chem B. 1998;102:9595–9602. [Google Scholar]
- 25.Kamlet MJ, Abbound JLM, Taft RW. An examination of linear solvation energy relationships. Progress in Physical Organic Chemistry. 1981;13:485–630. [Google Scholar]
- 26.Efremov RG, Feofanov AV, Nabiev IR. Effect of hydrophobic environment on the resonance Raman spectra of tryptophan residues in proteins. J Raman Spectrosc. 1992;23:69–73. [Google Scholar]
- 27.Takeuchi H, Harada I. Normal Coordinate Analysis of the Indole Ring. Spectrochim Acta. 1986;42:1067–1078. [Google Scholar]
- 28.Hirabayashi J, Hashidate T, Arata Y, Nishi N, Nakamura T, Hirashima M, Urashima T, Oka T, Futai M, Muller WE. Oligosaccharide specificity of galectins: a search by frontal affinity chromatography. Biochim Biophys Acta. 2002;1572:232–254. doi: 10.1016/s0304-4165(02)00311-2. [DOI] [PubMed] [Google Scholar]
- 29.Barrionuevo P, Beigier-Bompadre M, Ilarregui JM, Toscano M, Bianco GA, Isturiz MA, Rabinovich GA. A novel function for galectin-1 a the crossroad of innate and a adaptive immunity: galectin-1 regulates monocyte/macrophage physiology through a nonapoptotic ERK-dependent pathway. J Immunol. 2007;178:436–445. doi: 10.4049/jimmunol.178.1.436. [DOI] [PubMed] [Google Scholar]
- 30.Pace KE, Hahn HP, Baum LG. Preparation of recombinant human galectin-1 and use in T cell death assays. Methods Enzymol. 2003;363:499–518. doi: 10.1016/S0076-6879(03)01075-9. [DOI] [PubMed] [Google Scholar]
- 31.Asher SA, Bormett RW, Chen XG, Lemmon DH, Cho N, Peterson P, Arrigoni M, Spinelli L, Cannon J. UV Resonance Raman Spectroscopy Using a New CW Laser Source: Convinience and Experimental Simplicity. Appl Spectrosc. 1993;47:628–633. [Google Scholar]
- 32.Case DA, Darden TA, Cheatman TE, III, Simmerling CL, Wang J, Duke RE, Luo R, Merz DM, Wang B, Pearlman DA, Crowley M, Brozell S, Tsui V, Gohlke H, Mongan J, Hornak V, Cui G, Beroza P, Schafmeister C, Caldwell JW, Ross WS, Kollman PA. AMBER 8. University of California; San Francisco: 2004. [Google Scholar]
- 33.Cheatham TE, Cieplak P, Kollman PA. J Biomol Struct Dyn. 1999;16:845–862. doi: 10.1080/07391102.1999.10508297. [DOI] [PubMed] [Google Scholar]
- 34.Case DA, Cheatham TE, Darden TA, Gohlke H, Luo R, Merz KMJ, Onufriev A, Simmerling C, Wang B, Woods RJ. The Amber biomolecular simulation programs. J Computat Chem. 2005;26:1668–1688. doi: 10.1002/jcc.20290. [DOI] [PMC free article] [PubMed] [Google Scholar]
- 35.Dudik JM, Johnson CR, Asher SA. UV Resonance Raman studies of acetone, acetamide, and N-methylacetamide: models for the peptide bond. J Phys Chem. 1985;89:3805–3814. [Google Scholar]
- 36.Takeuchi H. Raman Structural Markers of Tryptophan and Histidine Side Chains in Proteins. Biopolymers (Biospectroscopy) 2003;72:305–317. doi: 10.1002/bip.10440. [DOI] [PubMed] [Google Scholar]
- 37.Miura T, Takeuchi H, Harada I. Characterization of individual tryptophan side chains in proteins using Raman spectroscopy and hydrogen-deuterium exchange kinetics. Biochemistry. 1988;27:88–94. doi: 10.1021/bi00401a015. [DOI] [PubMed] [Google Scholar]
- 38.Harada I, Miura T, Takeuchi H. Origin of the doublet at 1360 and 1340 cm-1 in the Raman spectra of tryptophan and related compounds. Spectrochim Acta. 1986;42:307–312. [Google Scholar]


