Abstract
The efficiency of conversion of precursor ions to observable products for electron detachment dissociation (EDD) was measured as a function of the key experimental parameters to determine their optimal values for the Fourier transform mass spectrometry analysis of anionic glycosaminoglycan carbohydrates. These parameters include electron current, electron energy, dispenser cathode heater current, electron beam duration, charge state of the precursor ion, oligomer length, and precursor ion number accumulated in an external radio frequency multipole trap. Precursor conversion is most efficient at an electron current of 15 µA, and decreases at higher and lower values. The conversion of precursor to product ions increases in efficiency as the electron pulse duration is increased. Together, these data suggest that a radially repulsive electric field is produced between the electron beam and negative ions during EDD which causes the reaction cross section to decrease at higher values of electron current (>15 µA). Elevating the heater current of the dispenser cathode increases the electron flux, but also causes ion activation, presumably by blackbody infrared irradiation. An electronic circuit is described that allows the electron current produced by the dispenser cathode to be measured during an EDD or electron capture dissociation (ECD) experiment.
INTRODUCTION
Electron capture dissociation (ECD) [1] has proven to be a valuable tool for the analysis of a diverse array of biomolecules, particularly for peptide sequencing [2–4] and for identification of labile modifications that may dissociate or be lost when using conventional ion activation methods [5]. The negative ion complement of this ion activation method, electron detachment dissociation (EDD) has also been utilized for the analysis of deprotonated biomolecules including peptides [6], oligonucleotides [7, 8], gangliosides [9], and carbohydrates [10–13]. Like ECD, EDD produces a charge-reduced precursor ion containing a radical site, and this leads to fragmentation processes that are complementary to those exhibited by other methods of ion activation, namely collisionally induced dissociation (CID) and infrared multiphoton dissociation (IRMPD).
With the development of these electron activation techniques, there has been an effort to characterize the key experimental parameters that control the yield of product ions and to gain further insight into the fundamental processes underlying electron induced fragmentation [2, 4, 14–22]. The majority of this work has been directed toward ECD. The chief parameters that affect ion production are electron beam current (controlled by the dispenser cathode heater current and the voltage applied to the electron extraction lens or grid), electron kinetic energy (determined by the voltage applied to the dispenser cathode), and the duration of the electron pulse. By manipulating these variables, the energy and flux of electrons entering the analyzer cell can be controlled.
As the initial step in ECD/EDD requires the interaction of an electron with a mass-selected precursor ion, the majority of work in this area has focused on maximizing the overlap of the electron beam with the trapped ions within the FTICR analyzer cell by manipulation of the electron flux or the spatial distribution of ions [16, 17, 23, 24]. Initially, directly heated filaments were utilized as the electron source, but given their limited current sourcing capability and difficulty in producing monoenergetic ions with a well-defined electron energy, they were soon replaced by indirectly heated dispenser cathodes. This advance provides for an increased electron emission current and therefore a decrease in irradiation time [16]. Additionally, on and off-resonance excitation have been employed to manipulate the trapped ions and increase the ion-electron interaction [23, 24]. The utility of external ion accumulation for ECD has also been examined. Not only does accumulation in an external multipole increase the precursor ion population available for irradiation, it has been observed that external accumulation results in the axialization of the trapped ions, and therefore increases the beam-ion overlap, resulting in decreased irradiation times [17].
The impact of electron energy has been studied in both ECD and EDD. Typically, electrons are less than 0.2 eV in standard ECD [1]. This range has expanded to 3–13 eV through the development of hot electron capture dissociation (HECD) [18] which produces secondary ion fragments such as w-type ions for peptides. Tysbin et al. have also observed ECD products at electron kinetic energies of 0–50 eV by utilizing the increased sensitivity attained by implementing gas-assisted dynamic trapping [19]. Electron energy studies have covered a smaller range in EDD. Initial reports of EDD in peptide di-anions covered a range of 10–27 eV [6], whereas oligonucleotides were irradiated with 16–18 eV [7, 8] and carbohydrates with 19 eV [10, 11, 13]] and 20–30 eV [12].
We have recently demonstrated the effectiveness of EDD for the analysis of anionic glycosaminoglycan (GAG) carbohydrates. EDD produces abundant cross-ring and glycosidic bond fragmentation while minimizing the loss of SO3 from sulfated GAG oligosaccharides [10, 11, 13]. To establish a quantitative basis for improving our fragmentation efficiency, we examine here the effect of key parameters on the efficiency of the EDD process. By calculating the efficiency of conversion to observable products, we are able to identify the optimal parameters for electron-based fragmentation of anionic glycosaminoglycans. We also examine the effect of oligosaccharide length, charge state of the precursor ion, and accumulation time in an external hexapole on the efficiency of conversion of precursors into product ions.
EXPERIMENTAL
Preparation of DS Oligosaccharides
Dermatan sulfate (DS) oligosaccharides (Structure 1) were prepared by partial enzymatic depolymerization of porcine intestinal mucosa dermatan sulfate (Celsus Laboratories, Cincinnati, OH). A 20 mg/mL dermatan sulfate solution in 50 mM Tris-HCl/60 mM sodium acetate buffer, pH 8 was incubated at 37 °C with chondroitin ABC lyase from Proteus vulgaris, EC 4.2.2.4. (Seikagaku, Japan). After the absorbance at 232 nm indicated the digestion was 50 % completed, the digestion mixture was heated at 100 °C for 3 min. High-molecular-weight oligosaccharides and the enzyme were removed by ultra-filtration using a 5000 MWCO membrane. The resulting oligosaccharide mixture was concentrated by rotary evaporation and fractionated by low pressure GPC on a Bio-Gel P10 (Bio-Rad, Richmond, CA) column. Fractions containing tetra- to decasaccharides (dp4 – dp10) were desalted by GPC on a Bio-Gel P2 column and freeze-dried [25]. Further purification of these compounds was carried out using strong anion exchange high-pressure liquid chromatography (SAX-HPLC) on a semi-preparative SAX S5 Spherisorb column (Waters Corp, Milford, MA). The SAX-HPLC fractions containing > 90 % of the desired oligosaccharides were collected, desalted by GPC, and freeze-dried. The solid was reconstituted in water and purified a second time by SAX-HPLC. Only the top 30 % of the chromatographic peak was collected, desalted, and freeze-dried. Concentration of the oligosaccharide solutions was determined by measuring the absorbance at 232 nm (ε = 3800 M−1cm−1). The resulting fractions containing individual DS oligosaccharides were characterized by PAGE, ESI-MS, and high-field nuclear magnetic resonance (NMR) spectroscopy.
Mass Spectrometry Analysis
Experiments were performed with a 9.4 T Bruker Apex Ultra QeFTMS (Billerica, MA) fitted with an Apollo II dual source, and an indirectly heated hollow cathode for generating electrons for EDD. Solutions of each oligosaccharide were introduced at a concentration of 0.1 – 0.2 mg/mL in 50:50:0.1 methanol:H2O:FA (Sigma, St. Louis, MO) and ionized by electrospray using a metal capillary (Agilent Technologies, Santa Clara, CA, #G2427A). Formic acid was utilized to reduce the presence of additional charge states and sodium-hydrogen heterogeneity. The sample solutions were infused at a rate of 120 µL/hour. All DS oligosaccharides were examined in negative ion mode.
For the EDD experiments, precursor ions were isolated in the external quadrupole and accumulated for 3–6 seconds before injection into the FTMS cell. One isolation/cell fill was utilized per scan. The selection of the precursor ion was further refined by using in-cell isolation with a coherent harmonic excitation frequency (CHEF) event [26]. For electron irradiation the cathode bias was set to −19 V. During scans of electron current, the extraction lens was varied from −18.75 V to −19.70 V, and the cathode heater was set to either 1.3 A or 1.6 A. The precursor ions were then irradiated with electrons for 1 second. During experiments varying the electron irradiation pulse duration, a constant cell current of 15 µA was maintained by setting the extraction lens to −18.31 V for a heater current of 1.3 A and −18.79 V for a heater current of 1.6 A. 24 acquisitions were averaged per mass spectrum. For each mass spectrum, 512K points were acquired, padded with one zero fill, and apodized using a sinebell window. Background spectra were acquired by leaving all parameters the same but setting the cathode bias to 0 V to ensure that no electrons reached the analyzer cell. External calibration of mass spectra produced a mass accuracy of 5 ppm. Internal calibration was also performed using confidently assigned glycosidic bond cleavage products as internal calibrants, providing a mass accuracy of <1 ppm. Due to the large number of low intensity products formed by EDD, only peaks with S/N > 10 are reported. Product ions were assigned using accurate mass measurement. All products are reported using the Domon and Costello nomenclature [27].
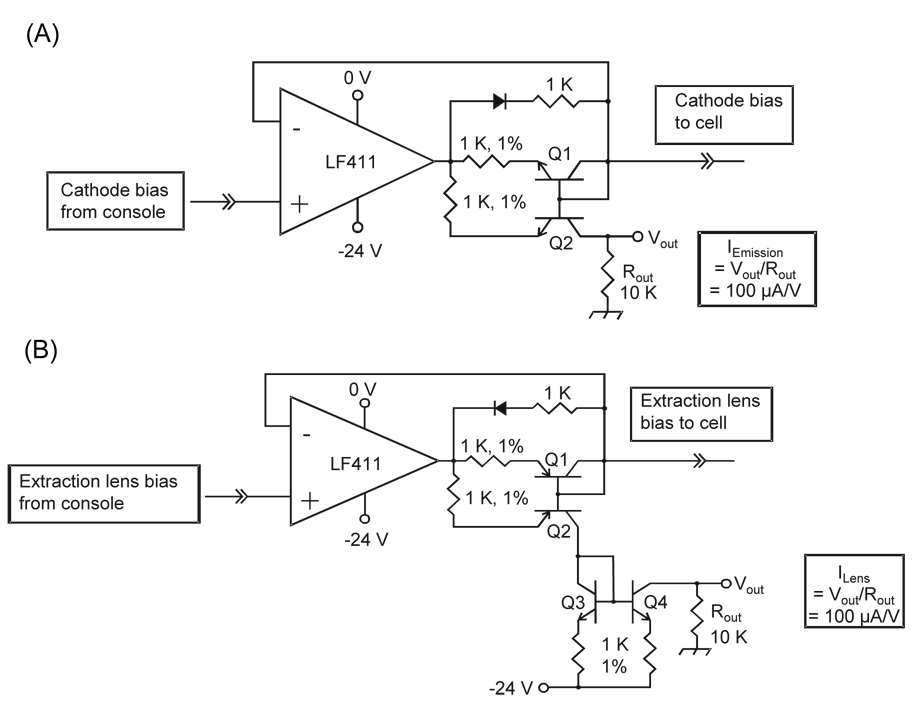
To measure the cathode electron emission current and electron current incident upon the extraction lens during the EDD experiment, a pair of analog circuits is employed, shown in Figures 1A and 1B. A circuit for monitoring current is inserted in series between the electron dispenser cathode and its voltage source, and a second circuit is inserted between the electron extraction lens and its voltage source.
Figure 1.
(A) Analog circuit designed to measure the emission current of the EDD cathode. Q1 and Q2 are a matched pair of npn transistors. (B) Analog circuit designed to measure the extraction lens current. Q1/Q2 are a matched pair of pnp transistors, and Q3/Q4 are a matched pair of npn transistors. The electron current sourced by the cathode and sunk by the lens are mirrored and converted to a voltage by 10K resistors.
For each series of experiments, the formulation of Gorshkov et al. [23] was employed to calculate the efficiency of conversion of precursor ions to observable products for the dermatan sulfate samples. Efficiency refers to the formation of all product ions, including those resulting from EDD, EID [28], and precursor activation due to blackbody irradiation. All efficiency calculations for electron current and pulse duration are presented as the average and associated standard deviation of spectra taken in triplicate for each data point. Efficiency calculations for experiments that utilize hexapole accumulation are based on single measurements. We express our conversion efficiency as:
| Equation 1 |
Ij is the fragment ion intensity of the jth peak, zj is its charge state, excluding the precursor ion intensity but including the charge-reduced precursor intensity, Io is the non-irradiated precursor ion intensity, and zo is the precursor ion charge. As the ions are detected by the measurement of an image current in FTICR-MS, the observed signal intensity is directly proportional to the charge state of a given precursor or product ion. In dividing by a given peak’s charge state, the intensities are normalized, allowing for direct summation across the products present in the MS2 spectrum.
For the two chosen dermatan sulfate samples, precursor ions of charge states 2− and 4−, corresponding to dp4 and dp8 respectively, were isolated and irradiated for each experiment. Based on the theoretical framework presented by Gorshkov, the maximum efficiency that can be achieved is given by:
| Equation 2 |
where n is the precursor charge state; the expected maximum attainable efficiency for a 2− ion is 43.75 % and approaches 50 % as the charge state is increased to 4 −.
RESULTS AND DISCUSSION
Measurement of Electron Current
Other researchers have previously reported measuring the electron current that passes through the cell by capturing electrons at an ion focusing element on the opposing side of the cell from the electron emitters [16, 20, 21]. Kaiser and Bruce have recently reported measuring the electron current incident upon the extraction lens during EPIC [29]. However, with previously reported approaches electron current cannot be measured during an ECD or EDD experiment. We have developed a method for measuring electron current during an experiment. Two analog circuits were designed to allow for a direct measurement of the cathode emission current and electron current incident upon the extraction lens, as shown in Figure 1A and 1B. The face of the hollow dispenser cathode is approximately 36 mm2 but only 19 mm2 of the cathode is exposed to the analyzer cell. Therefore some portion of the emitted electron flux is incident upon the face of the extraction lens and never reaches the cell. Thus, we need to measure both the electron current emitted by the dispenser cathode, and that captured by the extraction lens to determine, by difference, the current reaching the analyzer cell. We denote the measured currents as follows: emission current – the total electron current produced by the dispenser cathode; lens current – the electron current impinging on the face of the extraction lens; and cell current – the electron current entering the FT-ICR analyzer cell, deduced from the difference between emission and lens current.
The electron currents produced at the cathode and captured by the extraction lens are passed by a current mirror circuit in which an equivalent current is driven through a resistor to ground, producing a measurable voltage. The voltages are proportional to the electron current sourced by the cathode and sunk by the lens, and are recorded with an oscilloscope, which provides the values of electron current during the short pulse duration used for EDD or ECD. The current mirror circuit does not alter the voltage applied to the cathode and lens, in contrast to the use of a series resistor for monitoring the current. This is an important advantage, as even small changes in the bias voltage of the dispenser cathode or the extraction lens can produce large changes in the electron current.
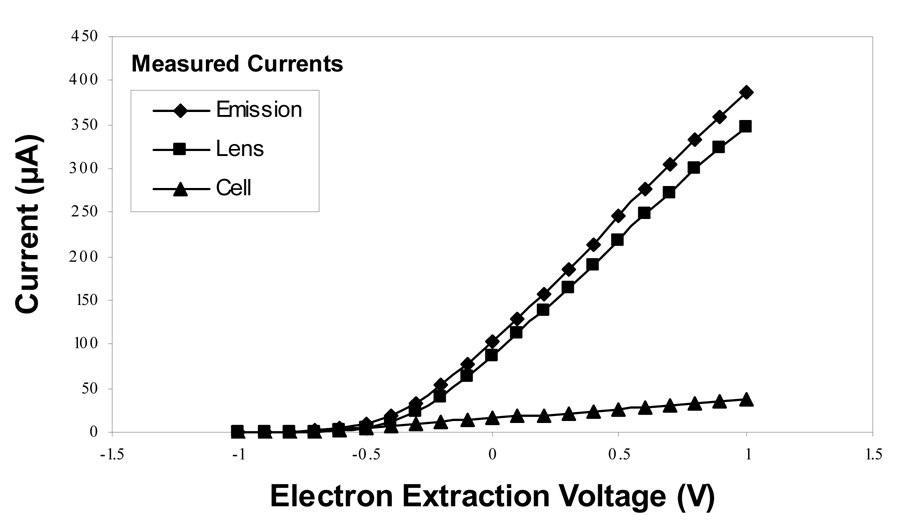
Prior to our application of the circuit to the EDD experiment, we established a series of baseline curves shown in Figure 2, to measure the actual output of the cathode. From these measurements, we find that 80–90% of the emitted electrons are captured by the lens, and therefore fail to reach the FT-ICR analyzer cell. At standard conditions for EDD experiments conducted to date (heater current of 1.6 A and −0.2 V potential difference between the cathode and lens), only 7 % of emitted electrons enter the cell, resulting in a cell current of approximately 15–20 µA. This low value is surprising, as the hollow cathode dispenser/extraction lens design exposes 19 mm2 of the 36 mm2 cathode surface area, and the expected transmission efficiency into the cell should be approximately 50 %. Perhaps the high density of electrons in the region between the cathode and extraction lens leads to a radial expansion of their spatial distribution, causing the high degree of electron capture by the lens. To confirm the value measured by our circuit, we have also measured the electron current captured by the high voltage focusing element on the opposing side of the analyzer cell as proposed by Polfer and Tsybin [16, 21] and find it to be in agreement with the value determined by the difference in emission and lens current.
Figure 2.
Electron currents (µA) as a function of the potential difference between the extraction lens and dispenser cathode, ΔV, at a heater current of 1.6A. A sub-optimal transmission efficiency is observed for electrons entering the FTICR analyzer cell.
Effect of Oligosaccharide Length and Precursor Ion Charge State
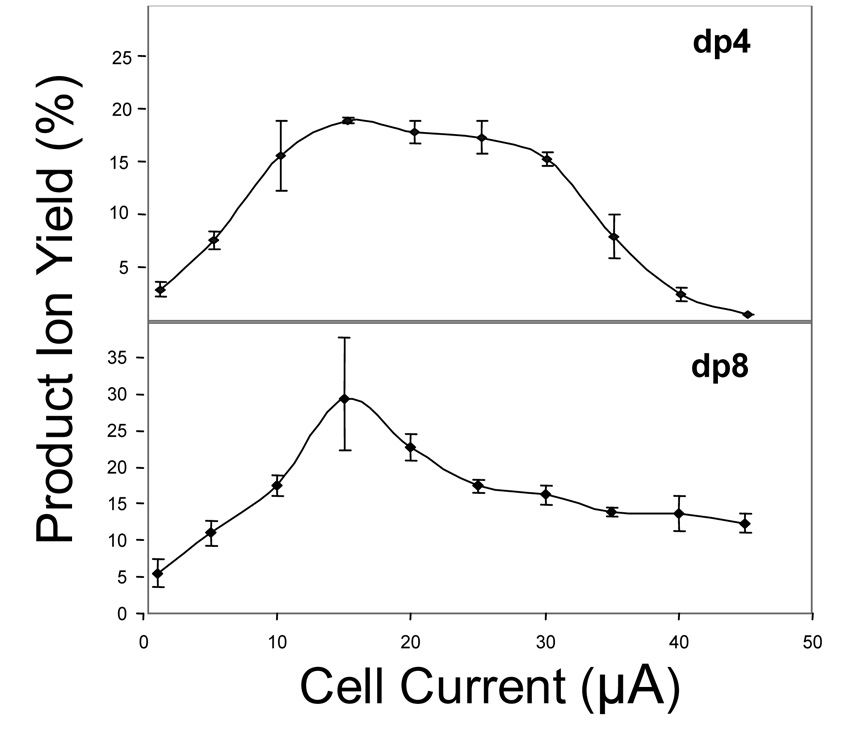
To examine the effect of oligosaccharide length on fragmentation efficiency, dermatan sulfate dp4 and dp8 were analyzed, shown in Figure 3. In both samples, a maximum efficiency is observed at 15 µA of cell current. In doubling the length of the oligomer, the conversion efficiency increases from 18 % to 29 %. The dp8 oligosaccharide has twice the number of sulfate groups than does dp4, and the principal charge state of dp8 is twice that of dp4. Zubarev has previously observed an increase in cross-section to be dependent on z2 during ECD [2]. The higher efficiency of dissociation of dp8 suggests a linear increase in the collision cross-section for the interaction of electrons and negatively-charged precursor ions, resulting from the higher charge of the longer oligosaccharide. This interaction produces both electron detachment and electron induced dissociation.
Figure 3.
Efficiencies of product formation versus electron current for dermatan sulfate dp4 and dp8 at a heater current of 1.6A, showing a maximum at 15 µA.
Heater Current
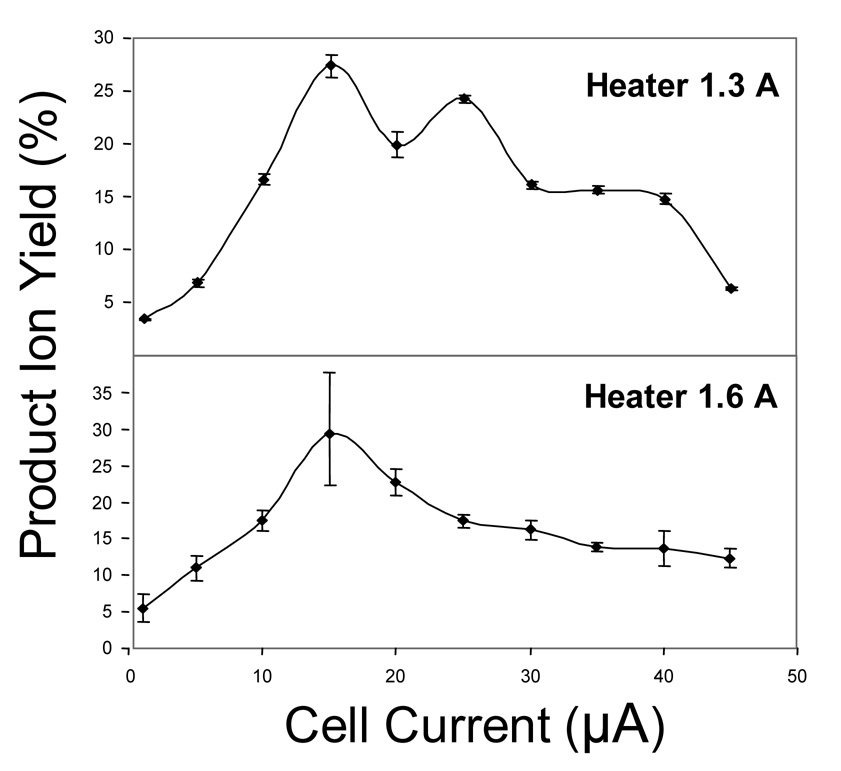
To examine the effect of heater current on the EDD of dermatan sulfate glycosaminoglycans, spectra were analyzed at heater current settings of 1.3 A and 1.6 A for dermatan sulfate dp8, shown in Figure 4. At a cell current of 15 µA, a maximum conversion efficiency of approximately 28–29 % was observed for both heater current values. As the heater current value does not affect the energy of the electrons entering the cell, it should be expected that a similar maximum should be observed for each. The conversion efficiency decreases sharply at cell current values below 15 µA, although products have been observed at cell current values of only 1 µA. Above 15 µA there is also a decrease in efficiency. We do not ascribe much significance to the secondary maximum observed at 30 µA for the data collected with a heater current of 1.3 A, as the dispenser cathode is operating close to the temperature threshold for electron emission. EDD products have been observed at cell current values up to 75 µA. At higher cell currents, the precursor is depleted in intensity and the conversion to products is reduced.
Figure 4.
Efficiency of product formation for dermatan sulfate dp8 as a function of cell current at heater currents of 1.3A and 1.6A.
Several possible mechanisms could account for the decline in efficiency above the optimal electron current of 15 µA. First is that as the electron cell current increases, there is an increase in radial repulsion between the electron beam and negative charge of the trapped ions. This repulsion could result in decreased overlap between the electron beam and the ions, resulting in lower fragmentation efficiencies. Consistent with this argument, the dp8 oligomer is observed to have a sharper maximum than dp4, as seen in Figure 3. One expects a larger repulsive interaction for the longer dp8 oligomer, as it carries twice the charge as does dp4. A second possibility is that with higher electron current, sequential dissociation reactions produce fragment ions with intensities or mass-to-charge values below the detection limit. A third possibility is ion loss by neutralization from multiple electron detachment, which is expected to increase with higher electron flux. These latter two possibilities are discounted by other observations (vide infra.)
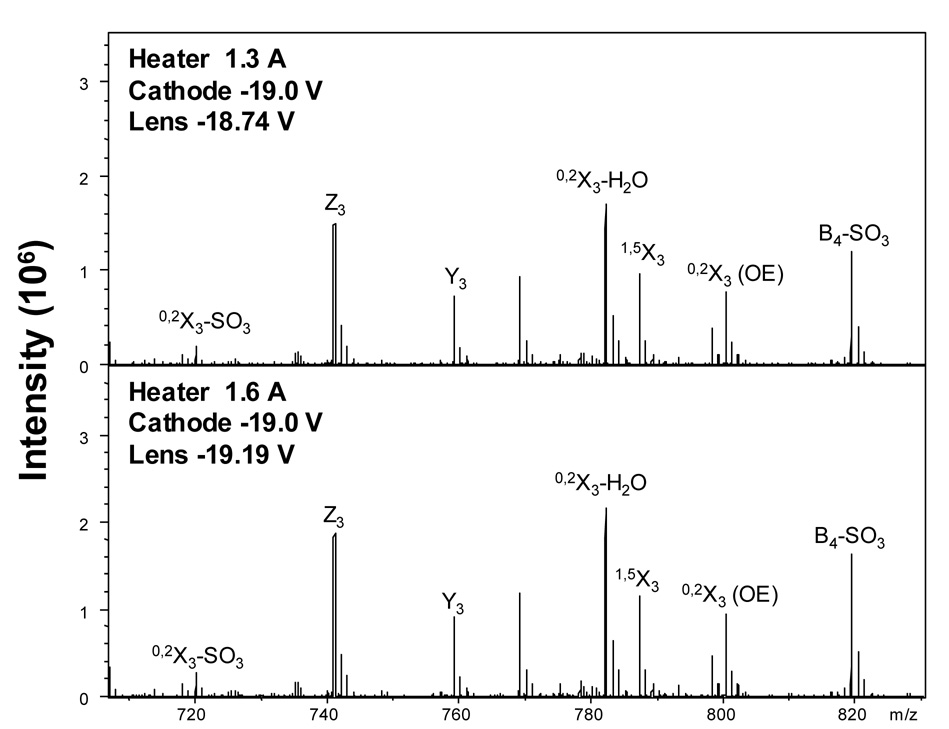
In order to achieve the same cell current at different heater current settings, the voltage applied to the extraction lens must be altered. As the heater current is lowered, the extraction voltage, the potential difference between the extraction lens and dispenser cathode (ΔV), must be increased to maintain a constant cell current. In our study, the cathode was held at −19.0 V and the extraction voltage increased from −0.19 V at 1.6 A to +0.26 V at 1.3 A. Identical EDD mass spectra of DS dp8, shown in Figure 5, were obtained at these settings, demonstrating that cell current is the principle parameter that controls the extent of fragmentation in EDD, and that by monitoring this parameter, one can obtain identical EDD mass spectra for a variety of heater current values.
Figure 5.
EDD mass spectra acquired at heater current settings of 1.3 A and 1.6 A showing identical fragmentation obtained by adjusting the electron extraction voltage.
Pulse Duration
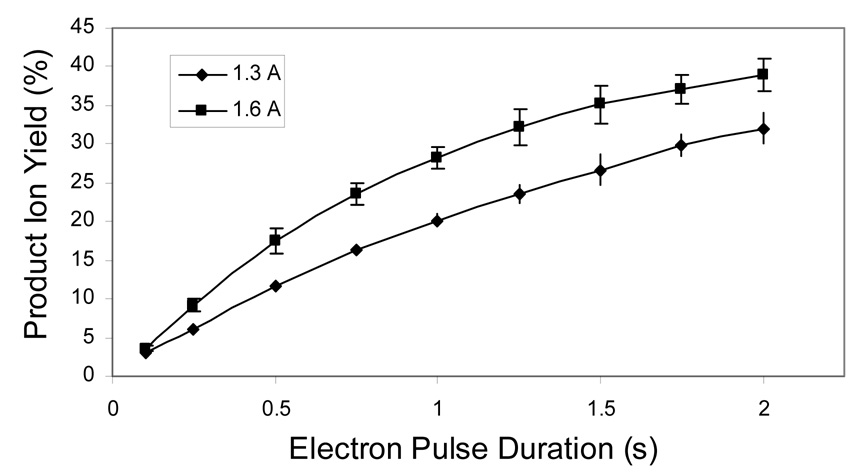
Our previous EDD studies of glycosaminoglycan carbohydrates have used an electron pulse duration of 1.0 s [10, 11, 13]. Having established that the maximum efficiency occurs at a cell current of 15 µA, the effect of electron pulse duration was investigated while holding constant the electron current delivered to the cell. Fragmentation efficiency is observed to increase as the electron beam interaction time increases from 0.1 s to 2.0 s, as shown in Figure 6. This behavior is quite different from the cell current measurements, in which efficiency peaks at an intermediate value, and then decreases as the cell current increases. Together these data suggest that the decrease in efficiency at higher cell currents is not a result of converting ions into neutrals through multiple electron detachment events, or promoting secondary fragmentation that reduces products to m/z or intensity values that are below the threshold for detection. If these mechanisms were active, then increasing pulse duration would have an effect similar to increasing the cell current, as both expose the ions to a larger number of electrons. Rather, these data suggest that the loss in efficiency from raising the electron beam current above the optimal value (15 µA) is a result of radial repulsion between the electron beam and the negatively charged precursor ions, which reduces the overlap of the two.
Figure 6.
Efficiency of product formation as a function of electron pulse duration at heater currents of 1.3 A and 1.6 A.
In order to couple EDD MS to online liquid chromatography (HPLC), the pulse duration should be reduced to 10–100 milliseconds, to allow acquisition on the peak elution time scale. Our present results indicate that sub-optimal conversion efficiencies are achieved on this time scale. Short irradiation times have been attained in ECD by increasing the flux of low energy electrons entering the analyzer cell [16]. However, for ECD, there is an attractive force between the positively-charged precursor ions and the electron beam that improves efficiency as the electron current increases. This approach has an opposite result for EDD because by increasing the electron current, the repulsion between the electron beam and the negatively charged precursor ions also increases, reducing EDD efficiency.
As the value of electron current at the cell is identical for both series of experiments (heater current settings of 1.3 A and 1.6 A), the efficiency curves should be similar. We observe a difference of approximately 10 % between the two curves. This small difference may be a result of blackbody radiation from the dispenser cathode. By increasing the heater current from 1.3 A to 1.6 A, the cathode glows considerably brighter, and the number of emitted infrared photons is expected to increase, resulting in additional ion activation that can increase the EDD fragmentation. To observe true EDD species resulting from the lowest energy radical pathway, the heater current should be minimized to reduce blackbody activation.
Hexapole Accumulation
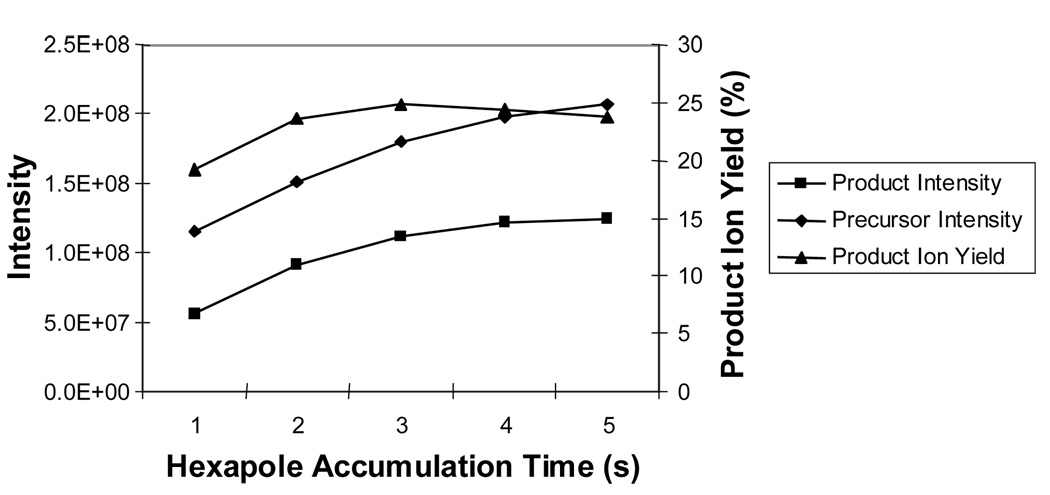
Prior to entering the analyzer cell, the mass-selected precursor ion is accumulated in a hexapole collision cell. Typically, the time for ion accumulation is selected to maximize the precursor intensity. On the other hand, the minimum time required per scan is desired to increase the duty cycle of the measurement. To quantitatively determine the optimal hexapole accumulation time, conversion efficiencies were calculated at the optimal cell current of 15 µA and for accumulation times ranging from 1.0 s to 6.0 s. As shown in Figure 7, the precursor ion intensity is observed to increase with hexapole storage time in asymptotic fashion, suggesting that the space charge limit of the hexapole is being reached after 6.0 s. There is an increase in efficiency up to 3.0 s but a decline at longer hexapole accumulation times. Both the precursor and product ion intensities continue to increase with longer accumulation times but product ion formation increases more slowly than precursor ion intensity leading to a decrease in conversion efficiency. This result is most likely due to a decrease in overlap between an expanding ion cloud and the static shape of the electron beam. As the number of ions in the hexapole increases, the volume of the ion cloud is expected to increase, producing a wider radial distribution of ions after transfer to the analyzer cell. For accumulation times longer than 3.0 s, it appears that the majority of additional precursor ions are distributed outside the interaction region defined by the electron beam.
Figure 7.
Efficiency of product formation (right axis) and precursor/product intensities (left axis) as a function of precursor accumulation time in the external hexapole.
Electron Energy
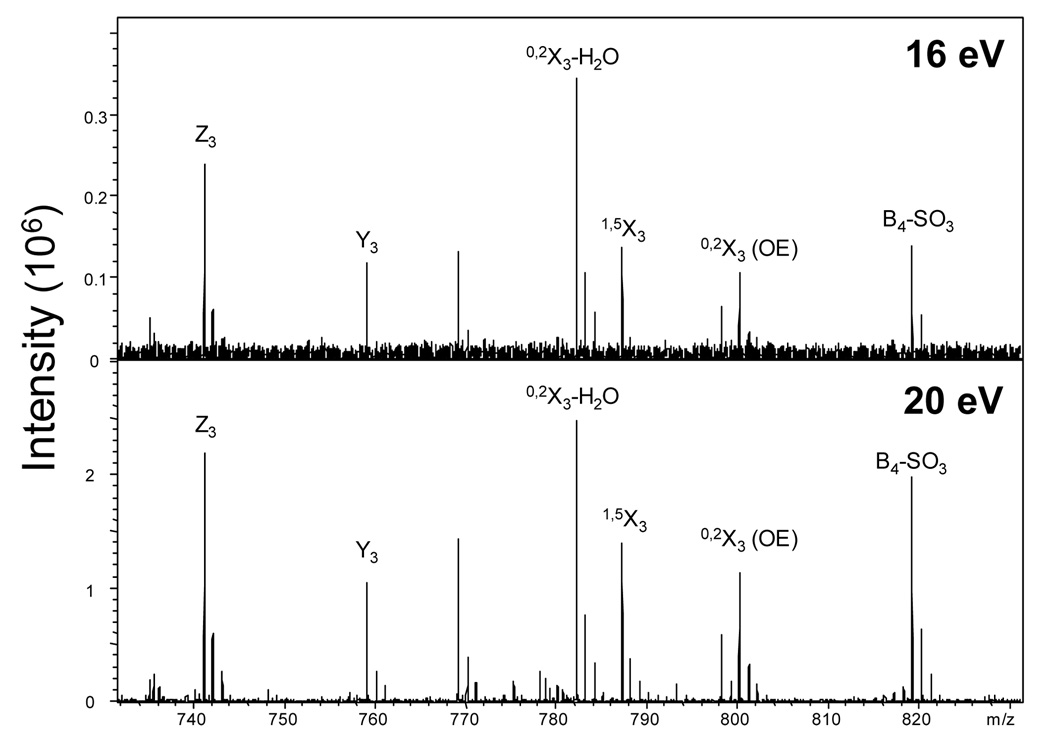
Prior EDD studies of anionic GAGs have employed 19 eV electrons for precursor irradiation [10, 11, 13]. We examine here the effect of varying electron energy over the range of 15–20 eV, while maintaining a constant electron cell current of 15 µA. A threshold of 16 eV was observed for the onset of odd-electron products that can be attributed to the radical EDD fragmentation mechanism. Consistent product ion distributions have been observed over the range of 16–20 eV as seen in Figure 8. Product ion distributions observed at energies as high as 75 eV (data not shown) are similar to our observations at 19 eV. No new product ions are observed, although it appears that increasing rates of glycosidic bond cleavage and losses of SO3 and CO2 occur as the energy is increased. We have previously observed preferential radical-induced loss of SO3 over CO2 at 19 eV. At higher electron energy, both loss channels appear to be equally likely, suggesting electronic activation pathways of dissociation in addition to radical mechanisms.
Figure 8.
EDD mass spectra obtained at 16 eV and 20 eV showing similar product ion distributions.
CONCLUSIONS
The measurement of the electron current entering the analyzer cell enables the optimization of parameters required to obtain the most efficient precursor conversion efficiency for anionic glycosaminoglycan carbohydrates. These studies provide insight into the manner in which electrons interact with negative ions. The current obstacle to increasing the efficiency of EDD appears to be the repulsive interaction of the negative ion cloud with the electron beam. Under the current electron extraction configuration greater than 50 % of the electrons are captured by the lens. Additional work will seek to increase the electron transmission efficiency and allow for operation at lower heater currents, thereby reducing additional blackbody IR ion activation.
ACKNOWLEDGEMENTS
The authors gratefully acknowledge financial support from the National Institutes of Health grant #2R01-GM038060-16. The authors thank Kristina Hakansson for useful discussions regarding her work on this same topic, to be published in an accompanying article in this same issue.
Footnotes
Publisher's Disclaimer: This is a PDF file of an unedited manuscript that has been accepted for publication. As a service to our customers we are providing this early version of the manuscript. The manuscript will undergo copyediting, typesetting, and review of the resulting proof before it is published in its final citable form. Please note that during the production process errors may be discovered which could affect the content, and all legal disclaimers that apply to the journal pertain.
REFERENCES
- 1.Zubarev RA, Kelleher NL, McLafferty FW. J. Am. Chem. Soc. 1998;120:3265. [Google Scholar]
- 2.Zubarev RA, Horn DM, Fridriksson EK, Kelleher NL, Kruger NA, Lewis MA, Carpenter BK, McLafferty FW. Anal. Chem. 2000;72:563. doi: 10.1021/ac990811p. [DOI] [PubMed] [Google Scholar]
- 3.Hakansson K, Cooper HJ, Emmett MR, Costello CE, Marshall AG, Nilsson CL. Anal. Chem. 2001;73:4530. doi: 10.1021/ac0103470. [DOI] [PubMed] [Google Scholar]
- 4.Hakansson K, Emmett MR, Hendrickson CL, Marshall AG. Anal. Chem. 2001;73:3605. doi: 10.1021/ac010141z. [DOI] [PubMed] [Google Scholar]
- 5.Kelleher NL, Zubarev RA, Bush K, Furie B, Furie B, McLafferty FW, Walsh CT. Anal. Chem. 1999;71:4250. doi: 10.1021/ac990684x. [DOI] [PubMed] [Google Scholar]
- 6.Budnik BA, Haselmann KF, Zubarev RA. Chem. Phys. Lett. 2001;342:299. [Google Scholar]
- 7.Yang J, Mo J, Adamson JT, Hakansson K. Anal. Chem. 2005;77:1876. doi: 10.1021/ac048415g. [DOI] [PubMed] [Google Scholar]
- 8.Yang J, Hakansson K. J. Am. Soc. Mass Spectrom. 2006;17:1369. doi: 10.1016/j.jasms.2006.05.006. [DOI] [PubMed] [Google Scholar]
- 9.McFarland MA, Marshall AG, Hendrickson CL, Nilsson CL, Fredman P, Mansson J-E. J. Am. Soc. Mass Spectrom. 2005;16:752. doi: 10.1016/j.jasms.2005.02.001. [DOI] [PubMed] [Google Scholar]
- 10.Wolff JJ, Chi LL, Linhardt RJ, Amster IJ. Anal. Chem. 2007;79:2015. doi: 10.1021/ac061636x. [DOI] [PMC free article] [PubMed] [Google Scholar]
- 11.Wolff JJ, Amster IJ, Chi LL, Linhardt RJ. J. Am. Soc. Mass Spectrom. 2007;18:234. doi: 10.1016/j.jasms.2006.09.020. [DOI] [PMC free article] [PubMed] [Google Scholar]
- 12.Adamson JT, Hakansson K. J. Am. Soc. Mass Spectrom. 2007;18:2162. doi: 10.1016/j.jasms.2007.09.007. [DOI] [PubMed] [Google Scholar]
- 13.Wolff JJ, Laremore TN, Busch AM, Linhardt RJ, Amster IJ. J. Am. Soc. Mass Spectrom. 2008;19:294. doi: 10.1016/j.jasms.2007.10.007. [DOI] [PMC free article] [PubMed] [Google Scholar]
- 14.Tsybin YO, Hendrickson CL, Beu SC, Marshall AG. Int. J. Mass Spectrom. 2006;255:144. [Google Scholar]
- 15.Tsybin YO, Witt M, Baykut G, Kjeldsen F, Hakansson P. Rapid Commun. Mass Spectrom. 2003;17:1759. doi: 10.1002/rcm.1118. [DOI] [PubMed] [Google Scholar]
- 16.Tsybin YO, Håkansson P, Budnik BA, Haselmann KF, Kjeldsen F, Gorshkov M, Zubarev RA. Rapid Commun. Mass Spectrom. 2001;15:1849. doi: 10.1002/rcm.448. [DOI] [PubMed] [Google Scholar]
- 17.Haselmann KF, Budnik BA, Olsen JV, Nielsen ML, Reis CA, Clausen H, Johnsen AH, Zubarev RA. Anal. Chem. 2001;73:2998. doi: 10.1021/ac0015523. [DOI] [PubMed] [Google Scholar]
- 18.Kjeldsen F, Haselmann KF, Budnik BA, Jensen F, Zubarev RA. Chem. Phys. Lett. 2002;356:201. [Google Scholar]
- 19.Tsybin YO, Witt M, Baykut G, Hakansson P. Rapid Commun. Mass Spectrom. 2004;18:1607. doi: 10.1002/rcm.1525. [DOI] [PubMed] [Google Scholar]
- 20.Yang J, Hakansson K. Int. J. Mass Spectrom. Submitted to Current Issue. [Google Scholar]
- 21.Polfer NC, Haselmann KF, Zubarev RA, Langridge-Smith PRR. Rapid Commun. Mass Spectrom. 2002;16:936. doi: 10.1002/rcm.664. [DOI] [PubMed] [Google Scholar]
- 22.McFarland MA, Chalmers MJ, Quinn JP, Hendrickson CL, Marshall AG. J. Am. Soc. Mass Spectrom. 2005;16:1060. doi: 10.1016/j.jasms.2005.03.020. [DOI] [PubMed] [Google Scholar]
- 23.Gorshkov MV, Masselon CD, Nikolaev EN, Udseth HR, Pasa-Tolic L, Smith RD. Int. J. Mass Spectrom. 2004;234:131. [Google Scholar]
- 24.Mormann M, Peter-Katalinic J. Rapid Commun. Mass Spectrom. 2003;17:2208. doi: 10.1002/rcm.1163. [DOI] [PubMed] [Google Scholar]
- 25.Pervin A, Gallo C, Jandik KA, Han XJ, Linhardt RJ. Glycobiology. 1995;5:83. doi: 10.1093/glycob/5.1.83. [DOI] [PubMed] [Google Scholar]
- 26.Heck AJR, de Koning LJ, Pinkse FA, Nibbering NMM. Rapid Commun. Mass Spectrom. 1991;5:406. [Google Scholar]
- 27.Domon B, Costello CE. Glycoconj. J. 1988;5:397. [Google Scholar]
- 28.Cody RB, Freiser BS. Anal. Chem. 1979;51:547. [Google Scholar]
- 29.Kaiser NK, Bruce JE. Int. J. Mass Spectrom. 2007;265:271. [Google Scholar]


