Abstract
We report a system that allows the simultaneous aspiration of one or more cells into each of five capillaries for electrophoresis analysis. A glass wafer was etched to create an array of 1 nL wells. The glass was treated with poly(2-hydroxyethyl methacrylate) to control cell adherence. A suspension of formalin-fixed cells was placed on the surface, and cells were allowed to settle. The concentration of cells and the settling time were chosen so that there was, on average, one cell per well. Next, an array of five capillaries was placed so that the tip of each capillary was in contact with a single well. A pulse of vacuum was applied to the distal end of the capillaries to aspirate the content of each well into a capillary. Next, the tips of the capillaries were placed in running buffer and potential was applied. The cells lysed upon contact with the running buffer, and fluorescent components were detected at the distal end of the capillaries by laser-induced fluorescence. The electrophoretic separation efficiency was outstanding, generating over 750,000 theoretical plates (1,800,000 plates/meter). In this example, AtT-20 cells were used that had been treated with TMR-GM1. The cells were allowed to metabolize this substrate into a series of products before the cells were fixed. The number of cells found in each well was estimated visually under the microscope and was described by a Poisson distribution with mean of 0.95 cells/well. This system provides an approach to high-throughput chemical cytometry.
Cytometry is the analysis of individual cells. Flow cytometry and image cytometry are powerful tools that characterize large numbers of cells.1 However, these measurements can characterize only a handful of specific target molecules. In contrast, chemical cytometry employs powerful analytical tools to characterize the composition of single cells.2–24 While classic cytometry is capable of analyzing a few components from a very large number of cells, most instrumentation for chemical cytometry is capable of analyzing a large number of components but at a much lower rate.
Most chemical cytometry studies have employed manual manipulation to select cells for subsequent analysis. There have been several efforts to improve the sample throughput based on continual lysis and analysis of cells distributed in a flowing stream. Ocvirk reported a microfabricated device for the analysis of β-galactosidease activity in single HL-60 cells.25 Cells were mixed with surfactant to effect lysis. The lysate was mixed with a fluorogenic substrate that was enzymatically converted to fluorescent product, which was detected downstream from the point of lysis. This system produced an analysis rate of perhaps 10 cells/minute. However, this system did not employ a separation step and was able to resolve only one component. Wang reported a similar system with a slightly different geometric design that allowed analysis rates approaching 1 cell per second, but again measuring only one component.26
Wu reported a microfluidic system that can capture a cell, lyse the cell, derivatize the lysate, and separate the labeled components with fluorescence detection.27 In this example, amino acids were determined from single cells. The separation efficiency of this system was limited by the interface between the reaction and separation portions of the device and separation efficiency appeared to be less than 15,000 plates.
We believe that the short separation distances found in microfabricated devices limits the applied potential, and hence separation efficiency, in electrophoretic separations. This limited efficiency is particularly important when chemical cytometry is used to analyze complex cellular components, such as the proteome or complex metabolic pathways of a single cell. We have focused on the use of conventional capillary electrophoresis systems for chemical cytometry.17–24 These systems provide the very high efficiency typical of classical capillary electrophoresis with convenient interface with high-sensitivity detection. Most importantly, the availability of multiple-capillary systems, which were originally developed for high-throughput DNA sequencing, may provide an avenue to high-throughput singe cell analysis.28–30
There remains a significant challenge in employing multiple capillary electrophoresis for chemical cytometry. In single capillary instruments, a capillary is moved with micromanipulators over a cell of interest, which is aspirated into the capillary for lysis.22 While practical for a single capillary instrument, such manual manipulations are unacceptable when dealing with a multiple capillary instrument. In this paper, we report an interface that allows the routine analysis of cells captured in 1-nanoliter wells located on a glass substrate. By capturing cells in wells that are in registration with a capillary array, we are able to simultaneously analyze a set of cells with minimal manual manipulations.
This system is applied to the analysis of ganglioside metabolism in AtT-20 cells.31 Cells are incubated with a fluorescent substrate, TMR-GM1. These cells take up the substrate, which undergoes catabolism to create a series of metabolites that retain the fluorescent tag. By employing capillary electrophoresis with laser-induced fluorescence detection, we are able to employ chemical cytometry for the analysis of metabolism at the single cell level.
Experimental Section
Optical components
A version of the instrument has previously been described.32 We have made several modifications to the optical components. A 10 mW 532 nm solid-state diode-pumped laser (Lasermate) supplied the fluorescence excitation. Signal was passed through a 580 DF40 bandpass filter.
Injection block
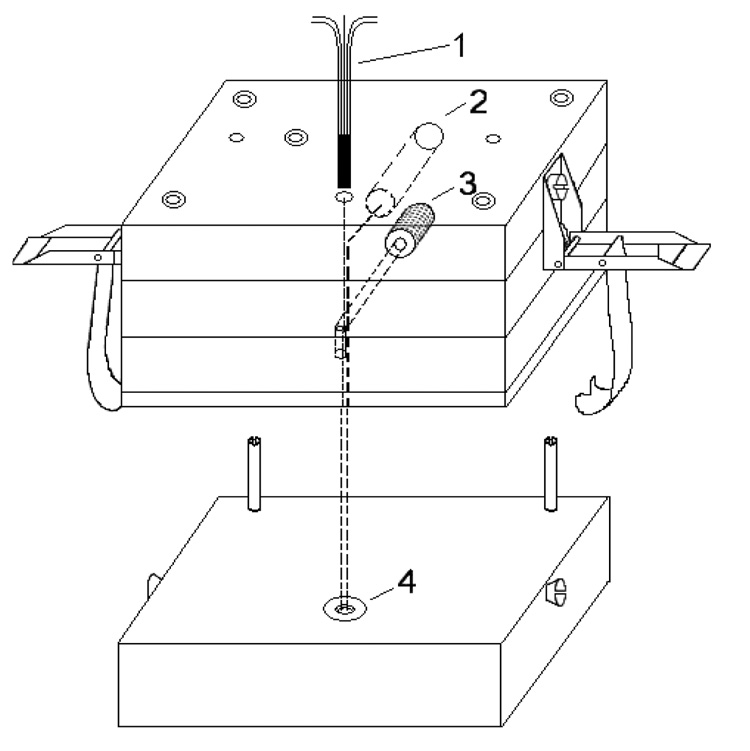
The injection block was modified to inject cells simultaneously into five capillaries, Figure 1. See supporting information for this manuscript for a detailed description. The design of the multi-capillary injector was based on the single cell injector for an individual capillary.22 It is fabricated from Plexiglas so that cells can be visualized with the transmitted light on an inverted microscope.
Figure 1.
Multi-capillary single cell injection block fabricated from Plexiglas. 1, five-capillary array; 2, platinum electrode; 3, nitrogen gas channel; 4, buffer reservoir.
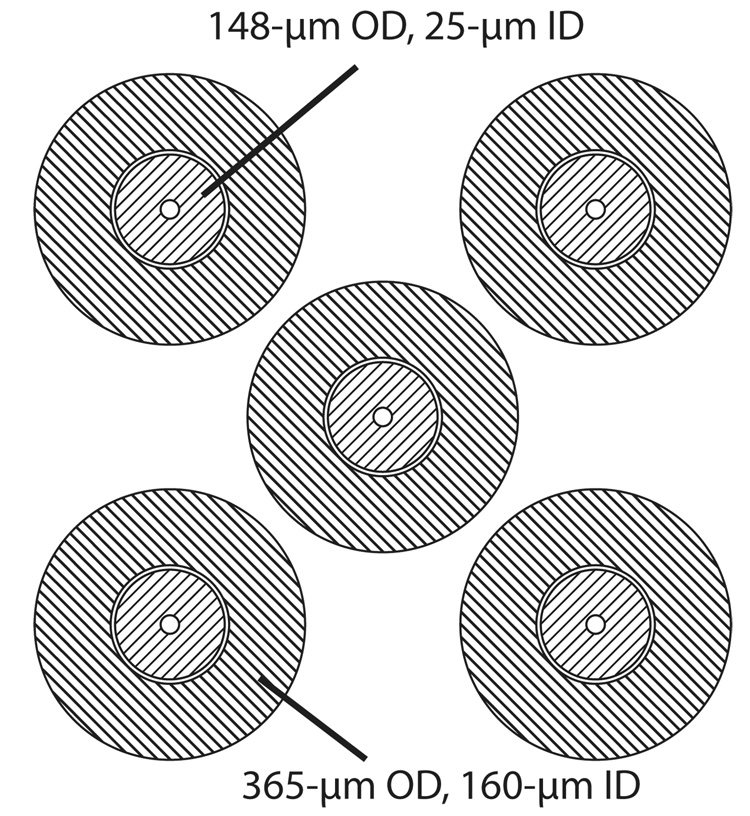
The capillaries were held in an alignment plate with five 375-µm diameter holes, Figure 2. This plate was fit into the top injection block and held the capillaries in precise registration. A set of five 365-µm OD, 160-µm ID fused silica capillaries were used as alignment sleeves and were epoxied into the alignment plate. Finally, the 40-cm long, 148-µm OD, 25-µm ID fused silica electrophoresis capillaries were glued to the alignment sleeves. The capillaries extended approximately 5-mm from the injection block. The distal ends of the capillaries were threaded into the five-channel sheath-flow cuvette.28
Figure 2.
Capillary array. The alignment plate had five 375-µm diameter holes. 365-µm OD 160-µm ID alignment sleeves were made from fused silica capillary and epoxied to the plate. Finally, the 148-µm OD 25-µm ID separation capillaries were threaded through the plate.
Microwell Array Glass Substrates
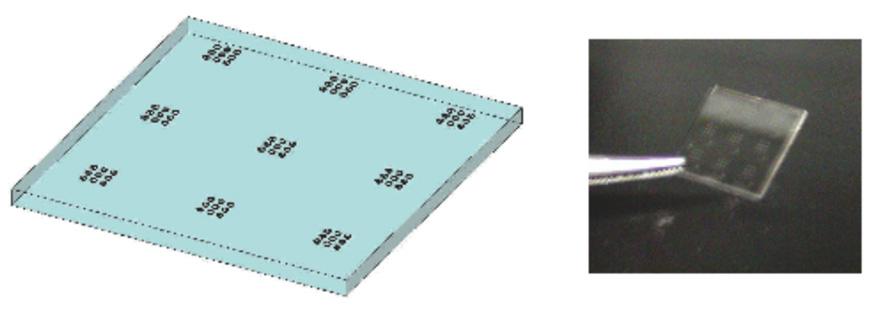
The glass well substrates were fabricated from three-inch borosilicate glass wafers (Erie Scientific, Portsmouth, NH). The wafers were cleaned with a piranha etch and a 70 °C RCA-1 solution, after which 150 Å of chrome and 3000 Å of gold was thermally evaporated onto one side of the glass surface. AZ1512 photoresist (Clariant Corporation, Sommerville, NJ) was spun onto the wafers, which were then soft baked at 90 °C for one minute and exposed through a transparency mask on an Oriel 3-inch aligner. The photoresist was developed in AZ300 MF developer (Clariant) for 30 s and hard baked at 110 °C for five minutes. Gold was etched with Gold Etch TFA (Creekside Technologies, Snohomish, WA) for 120 s and the chrome was etched with Chrome Etch TFD (Transene Company, Danvers, MA) for 10 s. Remaining photoresist was washed away with acetone. Blue-Tack (Semiconductor Equipment Corporation, Moorpark, CA) was used on the backside of the wafers for protection during subsequent hydrofluoric acid etching. Exposed glass was etched in 49% hydrofluoric acid (VWR, San Francisco, CA) for the time required to achieve a microwell depth of approximately 50 µm. The lithography process was repeated for a second mask that creates 3 µm lips around the outer edge of each well. Remaining gold and chrome were removed and the wafer was cleaned sequentially in acetone, isopropanol, and deionized water. This fabrication process resulted in chips with nine arrays of nine wells, 150 µm in diameter by 50 µm deep. The wells were spaced on 400 µm centers (Figure 3). A dicing saw was used to cut the 1 × 1 cm chips out of the wafer. The glass chips were evenly coated with 7.5% poly(2-hydrohyethyl methacrylate) to reduce the cell’s tendency to stick to the surface of the glass.10
Figure 3.
Diagram (left) and photograph (right) of the etched glass surface with the array of 1-nL volume wells.
Cell Preparation
AtT-20 cells were grown in Dulbecco’s modified Eagle medium with 10% horse serum and antibiotics to prevent bacterial contamination. They were incubated at 37 °C with 5 % CO2. The synthesis of the tetramethylrhodamine-GM1 substrate was described elsewhere.33 Briefly, tetramethylrhodamine-GM1 was added to the medium that also contained defatted bovine serum albumin. The cells were then incubated for 50 hours in this medium. Following the incubation, the cells were detached from the dish using 1× Trypsin/EDTA and washed five times with phosphate-buffered saline (PBS).
After incubation, cells were fixed using a solution of 4% formaldehyde in PBS at room temperature for 12 minutes. After removal of the formalin solution, the reaction was quenched by adding PBS, which was supplemented with 10mM glycine, to the cell suspension. The suspension were rinsed five times with fresh PBS and stored in the dark at 4 °C. Before each experiment, the cells were rinsed twice with PBS.
Cell Seeding and Aspiration
The fixed AtT-20 cells were seeded at a concentration of 30,000 cells/mL. The cells were allowed to settle into the wells for 2 hours. Longer settling time resulted in more cells per well.
The cell seeded-substrate was placed on a glass slide that was placed on an inverted microscope. A micromanipulator was used to place the capillary array on the array of wells. The supporting information for this manuscript shows photographs of the aspiration of single cell from a well. The cells were aspirated into the capillaries by exposing the sheath flow at the end of the capillaries to an 87 cm water column for 1 s.22 After aspiration, the injection ends of the capillaries were placed in a single microcentrifuge tube containing running buffer.
Capillary Electrophoresis
Separations were performed using 40 cm long, 25 µm ID, 148 µm OD uncoated fused-silica capillaries. The polyimide coating was removed with a gentle flame from both ends of the capillaries. The running buffer contained 35 mM sodium deoxycholate, 10 mM sodium tetraborate, and 5 mM methyl-β-cyclodextrin and the running voltage was 16 kV.
Results and Discussion
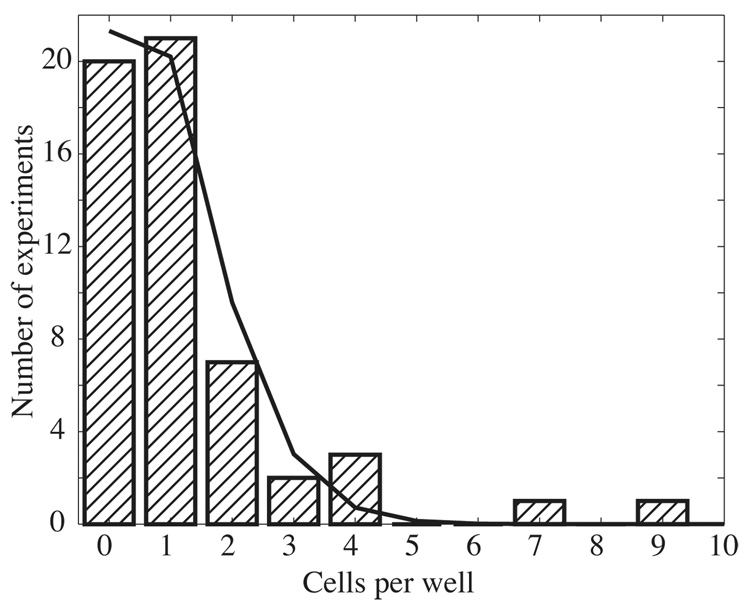
The inverted microscope was used to estimate the number of cells loaded in each well, Figure 4. The number of cells observed per well ranged from 0 to 9, with an average of 0.98 cells/well. The distribution followed a Poisson distribution (smooth curve in Figure 4), with the exception of two outliers that contained 7 and 9 cells. Those cases may reflect clumping of the cells.
Figure 4.
Histogram of the number of cells found in a well. A total of 55 wells were inspected with a microscope and the number of cells was counted visually. The smooth curve is the unweighted least-squares fit of a Poisson distribution to the distribution; the mean of the Poisson distribution was 0.98 cells/well.
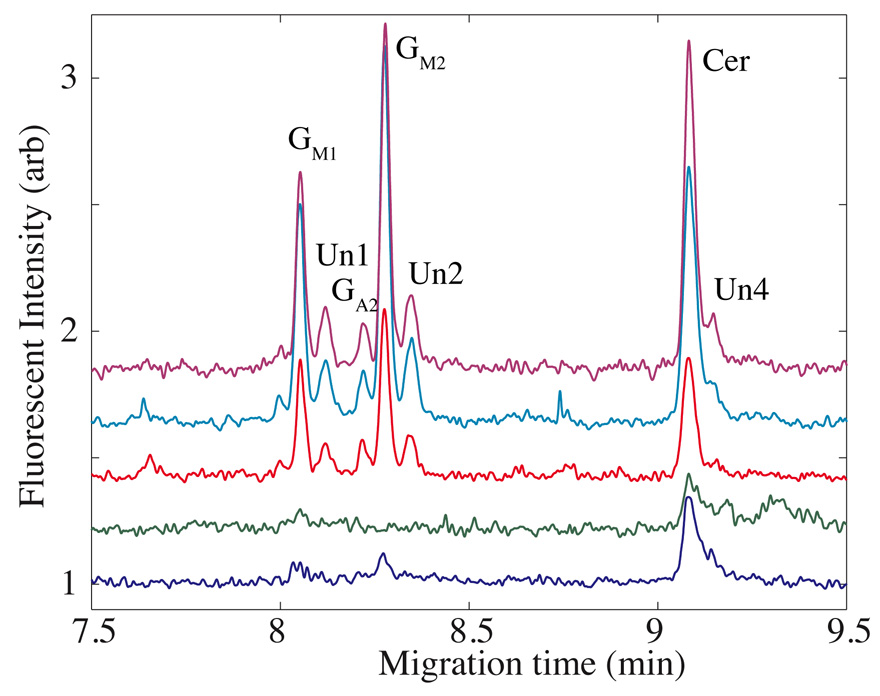
In operation, the capillaries were placed over five of the nine wells in an array, and the contents of those wells were aspirated into the capillary for analysis. Based on the Poiseulle equation, roughly 1 nL of solution was aspirated from each well.22 Figure 5 presents a set of high-efficiency separations obtained from one experiment. Peaks were identified based on the migration time of standard compounds.31,35-36 The data were aligned using a two-point algorithm based on the migration time of Cer and GM1.35 The cell-to-cell profiles are quite similar, as expected for cells obtained from the same cell line. Two wells contained no cells and three wells contained a single cell. The electrophoresis patterns observed from the single cells are similar to that observed in our earlier work,31 except that there was no evidence for expression of LacCer or GlcCer, which generated low amplitude peaks in our earlier experiments. The fixed cells used in this proof-of-principle experiment were stored for several months at 4 °C, and it is likely that the low molecular weight compounds leaked from the cells during storage. The observation of Cer in the empty wells supports this hypothesis; that compounds is present in high abundance in our cells and likely contaminated the cellular supernatant. Differences in amplitude of the Cer peak between capillaries reflect differences in the photodetector sensitivities and in the optical alignments of the sample streams.
Figure 5.
A set of five electropherograms generated simultaneously from a cell suspension aspirated from an array of one-nanoliter wells. The top three traces were generated from capillaries that aspirated a single cell from a well while the bottom traces were generated by capillaries that aspirated from an empty well. The peak identification is based on migration pattern of standards, and the nomenclature is that used in reference 31. Un1, Un2, and Un4 are unknown peaks that do not co-migrate with our standards.
The GM1, GM2, and Cer peaks from the top three traces were fit with a Gaussian function using non-linear regression. The resulting plate counts ranged from 600,000 to 950,000 plates, with an average of 800,000 ± 140,000, which is much higher than that observed with microfabricated devices that are employed for chemical cytometry. The high efficiency likely reflects two factors. First, we employ high potential for the separation, leading to improved plate counts. Second, the running buffer must efficiently lyse cells when the buffer front sweeps past the cell, leading to sharp initial analyte zones.
This system provides an attractive means of introducing cells into an array of capillaries for high throughput chemical cytometry. However, the system has one clear limitation: the number of cells contained in each well is not controlled and instead is governed by Poisson statistics. By adjusting the average number of cells per well to one, roughly 40% of the wells will contain a single cell. It is necessary to visually inspect the wells before analysis to determine the number injected. A delivery system will ultimately need to be developed to ensure deposition of a single cell in each well.
Supplementary Material
A detailed drawing of the interface and photographs showing aspiration of a single cell from a well are shown in the supporting material. This material is available free of charge via the Internet at http://pubs.acs.org.
Acknowledgements
This work was supported by grants R01NS061767 and P50HG002360 from the National Institutes of Health.
References
- 1.Shapiro HM. Practical Flow Cytometry. 4th Ed. Hoboken New Jersey: Wiley-Liss; 2003. [Google Scholar]
- 2.Dovichi NJ, Hu S. Curr. Opin. Chem. Biol. 2003;7:603–608. doi: 10.1016/j.cbpa.2003.08.012. [DOI] [PubMed] [Google Scholar]
- 3.Turner EH, Cohen D, Pugsley HR, Gonzalez-Gómez D, Whitmore CD, Zhu C, Dovichi NJ. Anal. Bioanal. Chem. 2008;390:223–226. doi: 10.1007/s00216-007-1665-5. [DOI] [PubMed] [Google Scholar]
- 4.Kennedy RT, Oates MD, Cooper BR, Nickerson B, Jorgenson JW. Science. 1989;246:57–63. doi: 10.1126/science.2675314. [DOI] [PubMed] [Google Scholar]
- 5.Olefirowicz TM, Ewing AG. Anal. Chem. 1990;62:1872–1876. doi: 10.1021/ac00216a026. [DOI] [PubMed] [Google Scholar]
- 6.Hogan BL, Yeung ES. Anal. Chem. 1992;64:2841–2845. doi: 10.1021/ac00046a031. [DOI] [PubMed] [Google Scholar]
- 7.Lee TT, Yeung ES. Anal. Chem. 1992;64:3045–3051. doi: 10.1021/ac00047a029. [DOI] [PubMed] [Google Scholar]
- 8.Milofsky RE, Yeung ES. Ana.l Chem. 1993;65:153–157. doi: 10.1021/ac00050a011. [DOI] [PubMed] [Google Scholar]
- 9.Kristensen HK, Lau YY, Ewing AG. J. Neurosci. Methods. 1994;51:183–188. doi: 10.1016/0165-0270(94)90009-4. [DOI] [PubMed] [Google Scholar]
- 10.Xue Q, Yeung ES. Anal. Chem. 1994;66:1175–1178. doi: 10.1021/ac00079a036. [DOI] [PubMed] [Google Scholar]
- 11.Gilman SD, Ewing AG. Anal. Chem. 1995;67:58–64. doi: 10.1021/ac00097a010. [DOI] [PubMed] [Google Scholar]
- 12.Meredith GD, Sims CE, Soughayer JS, Allbritton NL. Nat. Biotechnol. 2000;18:309–312. doi: 10.1038/73760. [DOI] [PubMed] [Google Scholar]
- 13.Roper MG, Shackman JG, Dahlgren GM, Kennedy RT. Anal. Chem. 2003;75:4711–4717. doi: 10.1021/ac0346813. [DOI] [PubMed] [Google Scholar]
- 14.Zarrine-Afsar A, Krylov SN. Anal. Chem. 2003;75:3720–3724. doi: 10.1021/ac034463+. [DOI] [PubMed] [Google Scholar]
- 15.Miao H, Rubakhin SS, Sweedler JV. Anal. Bioanal. Chem. 2003;377:1007–1013. doi: 10.1007/s00216-003-2191-8. [DOI] [PubMed] [Google Scholar]
- 16.Fuller KM, Arriaga EA. Anal. Chem. 2003;75:2123–2130. doi: 10.1021/ac026476d. [DOI] [PubMed] [Google Scholar]
- 17.Le XC, Tan W, Scaman CH, Szpacenko A, Arriaga E, Zhang Y, Dovichi NJ, Hindsgaul O, Palcic MM. Glycobiology. 1999;9:219–225. doi: 10.1093/glycob/9.3.219. [DOI] [PubMed] [Google Scholar]
- 18.Krylov SN, Zhang Z, Chan NW, Arriaga E, Palcic MM, Dovichi NJ. Cytometry. 1999;37:14–20. doi: 10.1002/(sici)1097-0320(19990901)37:1<14::aid-cyto2>3.0.co;2-j. [DOI] [PubMed] [Google Scholar]
- 19.Zhang Z, Krylov S, Arriaga EA, Polakowski R, Dovichi NJ. Anal. Chem. 2000;72:318–322. doi: 10.1021/ac990694y. [DOI] [PubMed] [Google Scholar]
- 20.Hu S, Lee R, Zhang Z, Krylov SN, Dovichi NJ. J. Chromatogr. B. 2001;752:307–310. doi: 10.1016/s0378-4347(00)00528-4. [DOI] [PubMed] [Google Scholar]
- 21.Hu S, Zhang L, Cook LM, Dovichi NJ. Electrophoresis. 2001;22:3677–3682. doi: 10.1002/1522-2683(200109)22:17<3677::AID-ELPS3677>3.0.CO;2-Q. [DOI] [PubMed] [Google Scholar]
- 22.Krylov SN, Starke DA, Arriaga EA, Zhang Z, Chan NW, Palcic MM, Dovichi NJ. Anal. Chem. 2000;72:872–877. doi: 10.1021/ac991096m. [DOI] [PubMed] [Google Scholar]
- 23.Hu S, Le Z, Krylov S, Dovichi NJ. Anal. Chem. 2003;75:3493–3501. doi: 10.1021/ac034153r. [DOI] [PubMed] [Google Scholar]
- 24.Hu K, Ahmadzadeh H, Krylov SN. Anal. Chem. 2004;76:3864–3866. doi: 10.1021/ac0495900. [DOI] [PubMed] [Google Scholar]
- 25.Ocvirk G, Salimi-Moosavi H, Szarka RJ, Arriaga EA, Andersson PE, Smith R, Dovichi NJ, Harrison DJ. Proceedings IEEE; 2004. pp. 115–125. [Google Scholar]
- 26.Wang HY, Lu C. Chem. Commun. (Camb) 2006;33:3528–3530. doi: 10.1039/b605722e. [DOI] [PubMed] [Google Scholar]
- 27.Wu H, Wheeler A, Zare RN. Proc. Natl. Acad. Sci. USA. 2004;101:12809–12813. doi: 10.1073/pnas.0405299101. [DOI] [PMC free article] [PubMed] [Google Scholar]
- 28.Zhang J, Voss KO, Shaw DF, Roos KP, Lewis DF, Yan J, Jiang R, Ren H, Hou JY, Fang Y, Puyang X, Ahmadzadeh H, Dovichi NJ. Nucleic Acids Res. 1999;27:e36. doi: 10.1093/nar/27.24.e36. [DOI] [PMC free article] [PubMed] [Google Scholar]
- 29.Crabtree HJ, Bay SJ, Lewis DF, Coulson LD, Fitzpatrick G, Harrison DJ, Delinger SL, Zhang JZ, Dovichi NJ. Electrophoresis. 2000;21:1329–1335. doi: 10.1002/(SICI)1522-2683(20000401)21:7<1329::AID-ELPS1329>3.0.CO;2-2. [DOI] [PubMed] [Google Scholar]
- 30.Zhang J, Yang M, Puyang X, Fang Y, Cook LM, Dovichi NJ. Anal. Chem. 2001;73:1234–1239. doi: 10.1021/ac001001c. [DOI] [PubMed] [Google Scholar]
- 31.Whitmore CD, Hindsgaul O, Palcic MM, Schnaar RL, Dovichi NJ. Anal. Chem. 2007;79:5139–5142. doi: 10.1021/ac070716d. [DOI] [PubMed] [Google Scholar]
- 32.Zhu CHX, Kraly JR, Jones MR, Whitmore CD, Gomez DG, Eggertson M, Quigley W, Boardman A, Dovichi NJ. Anal. Chem. 2007;79:765–768. doi: 10.1021/ac061652u. [DOI] [PubMed] [Google Scholar]
- 33.Larsson EA, Olsson U, Whitmore CD, Martins R, Tettamanti G, Schnaar RL, Dovichi NJ, Palcic MM, Hindsgaul O. Carbohydr. Res. 2007;342:482–489. doi: 10.1016/j.carres.2006.10.002. [DOI] [PMC free article] [PubMed] [Google Scholar]
- 34.Li XF, Ren H, Le X, Qi M, Ireland ID, Dovichi NJ. J. Chromatogr. A. 2000;869:375–384. doi: 10.1016/s0021-9673(99)00893-6. [DOI] [PubMed] [Google Scholar]
- 35.Whitmore CD, Olsson U, Larsson A, Hindsgaul O, Palcic MM, Dovichi NJ. Electrophoresis. 2007;28:3100–3104. doi: 10.1002/elps.200700202. [DOI] [PubMed] [Google Scholar]
- 36.Chan NWC, Stangier K, Sherburne R, Taylor DE, Zhang YN, Dovichi NJ, Palcic MM. Glycobiology. 1995;5:683–688. doi: 10.1093/glycob/5.7.683. [DOI] [PubMed] [Google Scholar]
Associated Data
This section collects any data citations, data availability statements, or supplementary materials included in this article.
Supplementary Materials
A detailed drawing of the interface and photographs showing aspiration of a single cell from a well are shown in the supporting material. This material is available free of charge via the Internet at http://pubs.acs.org.


