Abstract
β-Amyloid peptide (Aβ), one of the primary protein components of senile plaques found in Alzheimer disease, is believed to be toxic to neurons by a mechanism that may involve loss of intracellular calcium regulation. We have previously shown that Aβ blocks the fast-inactivating potassium (A) current. In this work, we show, through the use of a mathematical model, that the Aβ-mediated block of the A current could result in increased intracellular calcium levels and increased membrane excitability, both of which have been observed in vitro upon acute exposure to Aβ. Simulation results are compared with experimental data from the literature; the simulations quantitatively capture the observed concentration dependence of the neuronal response and the level of increase in intracellular calcium.
Keywords: Alzheimer disease, mathematical model
Intracellular Ca2+ is an important second messenger in the central nervous system. Increases in intracellular Ca2+ concentration ([Ca2+]i) trigger neurotransmitter release, increase enzyme activity, and up-regulate gene expression, and they are believed to play a role in synaptic plasticity (1). Loss of Ca2+ homeostasis is therefore very detrimental to cell function and may precede certain types of neurotoxicity (2).
β-Amyloid (Aβ) is a major component of senile plaques, one of the defining pathological features of Alzheimer disease (AD), and is believed by many to play an important role in the onset and/or progression of the disease. Aβ is a short peptide, between 38 and 43 amino acids long, produced by proteolytic cleavage of the amyloid precursor protein (APP) (3). Evidence supporting the role of Aβ in neurotoxicity in AD includes the following: mutations in APP lead to early-onset AD (3), transgenic mice overexpressing one of the mutant forms of APP have AD-like pathology and cognitive impairment (4), and Aβ is toxic to cultured neurons (5–15).
Loss of Ca2+ regulation has been implicated in the observed neurotoxicity of Aβ (6, 16). In in vitro experiments, addition of Aβ resulted in abnormally large increases in [Ca2+]i upon depolarization of the neuron (17). Aβ increased spontaneous Ca2+ fluctuations in neurons, in both frequency and magnitude (18). Anticonvulsants (19), Ca2+ channel blockers (8), glutamate receptor antagonists, and Na+ channel blockers (18) reportedly reduce or prevent Aβ-mediated Ca2+ rise, neurotoxicity, or increased excitability.
The mechanism by which Aβ induces loss of Ca2+ regulation has yet to be firmly established. We endeavored, through the use of a mathematical simulation of a hippocampal neuron, to demonstrate the feasibility of one mechanism by which Aβ could cause elevations in [Ca2+]i, specifically, by blocking the fast-inactivating potassium (A) channel. Previously we showed that Aβ blocks the A current, that the block is independent of membrane potential, and that the kinetics of channel opening and deactivation are not altered (20). From our data we postulated that Aβ bound to a closed channel and prevented it from opening. In results reported here, we simulated the changes in ion fluxes and intracellular Ca2+ in a hippocampal neuron in response to the Aβ block. We demonstrate that Aβ block of the A current would increase [Ca2+]i and neuronal excitability, quantitatively consistent with literature data.
METHODS
Structure of Model.
We modeled calcium dynamics in a hippocampal neuron, treating the neuron as a “wrinkled” sphere with radius R and surface area S. The spherical geometry, although incapable of describing signal integration in dendrites, has been used successfully to describe calcium dynamics and properties related to neuron excitability (21–23). The components of the model neuron are shown in Fig. 1. The only source or sink of calcium included in the cytosol was immobile calcium buffers. Calcium release from intracellular stores was ignored because it occurs on a longer time scale than that of the present simulations (24, 25). Unless otherwise stated, parameters were taken from the literature on hippocampal neurons and were not adjusted. Parameter values are listed in Table 1.
Figure 1.
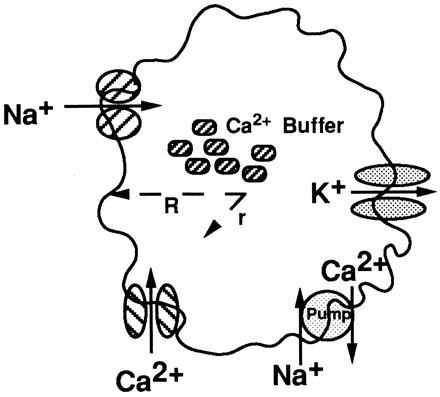
Schematic of components of neuron model. Ca2+ buffers were uniformly distributed within the cytosol. The membrane contained a Na+ channel; the A, DR, C, and AHP K+ channels; the L, N, and T Ca2+ channels; and a Ca2+ pump. Ca2+ concentration was computed as a function of time t and radial distance r inside the sphere.
Table 1.
Model parameter values
| Parameter | Value | Ref(s). |
|---|---|---|
| R, mm | 12 | 23 |
| A, cm2 | 4 × 10⁻⁵ | 23 |
| C, mF/cm2 | 1 | 26, 27 |
| D, cm2/s | 6 × 10⁻⁶ | 21, 22 |
| kb1, M−1·s−1 | 108 | 21, 24 |
| kb2, s−1 | 600 | 24–26, 28 |
| Kp, M−1 | 125,000 | 22 |
| kpP0, mol/s | 4 × 10⁻¹⁸ | 22, 26 |
| rleak, mol/s | 2.5 × 10⁻²⁰ | 22, 26 |
The governing equation for intracellular Ca2+ concentration, [Ca2+]i, everywhere inside the neuron is
 |
1 |
where t is time, D is the diffusion coefficient of Ca2+ inside the cell, and rbuffer is the rate of Ca2+ uptake by buffers. Ca2+ buffering is described as a reversible saturable process, with a single binding site for Ca2+ on the buffer. rbuffer is expressed as
 |
2 |
where kb1 and kb2 are the forward and reverse rate constants for the buffering reaction, respectively, [B] is the concentration of the nondiffusing Ca2+ buffering proteins, and [Ca2+B] is the concentration of buffering proteins with Ca2+ bound (21, 27). The value of kb1 is taken from the literature (21, 24). kb2 was adjusted to be consistent with experimental estimates of the equilibrium dissociation constant of calcium from the buffers (24–26, 28). Everywhere inside the sphere
 |
3 |
Diffusive terms were not included in Eq. 3, as buffers were assumed to be large and immobile at short times (28).
The boundary conditions are
 |
4 |
 |
5 |
where r is the distance from the center of the neuron in the radial direction, F is Faraday’s constant, ICa2+ is the calcium current through the membrane, and rpump is the rate that Ca2+ is being pumped out of the cell. A positive current is defined as a cation flowing out of the cell. L, N, and T calcium currents were included. The ion currents and the rate of pumping are defined for the entire membrane; therefore, the diffusive flux of calcium is multiplied by the surface area. The Ca2+ pump is described by a Michaelis–Menten type formulation with
 |
6 |
where kp is the rate that Ca2+ is transported out of the cell, P0 is the total surface concentration of the calcium pump, [Ca2+]r=R represents Ca2+ concentration at the inside surface of the cell, Kp is the equilibrium constant for Ca2+ binding to the pump, and rleak is the basal rate at which Ca2+ leaks into the cell at resting potentials. Although there are at least two Ca2+ transport mechanisms out of the cell, a Na+- and an ATP-dependent pump, only the first mechanism was included (22, 26). rleak was calculated such that rpump equals zero when [Ca2+]i equals [Ca2+]0. The rate of calcium extrusion predicted from our simulations is consistent with experimental values of calcium extrusion rates from two types of neurons (29).
Initial conditions at t = 0 for all r are defined for [Ca2+], [B], and [Ca2+B] such that their distribution is homogeneous throughout the cell. The homogeneous distribution of buffers within the cytosol is not uniformly assumed in the literature (21, 27), but experimental data supporting a nonuniform buffer distribution are lacking. [Ca2+]0 was fixed at 50 nM. Reported values for buffer concentrations in various cell types range from 0.003 to 1 mM (21, 26, 28). For most simulations, [B]0 was set at 0.225 mM. [Ca2+B]0 was fixed such that at the start of the simulation, the equilibrium condition was satisfied. Table 2 gives a complete list of the initial conditions used in the model.
Table 2.
Initial conditions
| Variable | Initial value |
|---|---|
| [Ca2+]0, nM | 50 |
| [B]0, mM | 0.225 |
| [Ca2+B]0, μM | 1.87 |
| All m | 0 |
| All h | 1 |
The membrane potential on the surface of the soma is (21)
 |
7 |
where C is the membrane capacitance; V is the membrane potential; INa is the sodium current; ICa(L), ICa(N), and ICa(T) are the L, N, and T type calcium currents, respectively; IK(DR), IK(A), IK(C), and IK(AHP) are the delayed rectifier, fast-inactivating, calcium-dependent, and calcium-dependent–long afterhyperpolarizing potassium currents, respectively; Iinject is the current stimulus injected into the cell; IAMPA is the synaptic current corresponding to the α-amino-3-hydroxy-5-methyl-4-isoxazolepropionic acid (AMPA) receptor activation; and Ileak is the current leaking into or out of the cell. It was assumed that there were no spatial gradients of voltage or current on the surface of the membrane, implying that all ion channels and pumps were uniformly distributed. In general, the jth ion current is described by
 |
8 |
where ¯gj is the maximum conductance through the jth channel multiplied by the number of j ion channels, m and h are voltage- and time-dependent parameters describing the probability of a channel being open, a is an empirically determined parameter related to the number of closed but active states the channel has, b has a value of 1 if the channel inactivates and a value of 0 if it is noninactivating, and Vj is the Nernst potential for the jth ion. The Nernst potentials for Na+ and K+ were assumed to be constant, as ion fluxes were unlikely to significantly change intracellular and extracellular ion concentrations under in vitro conditions. For the calcium currents, the Goldman–Hodgkin–Katz potential was used (30).
For each ion current, m and h are computed by solving
 |
9 |
where x represents either m or h, and αm, αh, βm, and βh are voltage-dependent rate constants for the state variables m and h. The α and β functions for the ion currents were taken from Traub et al. (23), with the exception of the L, N, and T currents, which were taken from Jaffe et al. (26), and αmK(AHP) and the Ca2+ dependence of IK(C), which were modified to adjust for differences in numerical methods used in determining [Ca2+]i.
 |
10 |
and
 |
11 |
Functional forms and parameters for IAMPA (26) and Ileak (23) were taken from the literature. Ca2+ current through the N-methyl-d-aspartate (NMDA) receptor was not included in the model because it is not a significant source of Ca2+ entry except under conditions of high-frequency stimulation such as occur in long-term potentiation (31). Other currents not incorporated into the model were IK(M) and ICa(P). Membrane excitability and calcium dynamics have been accurately modeled without the inclusion of either current (23, 26). Table 3 lists all channel conductances.
Table 3.
Channel conductances
| Variable | Conductance, mS/cm2 |
|---|---|
| ḡNa | 135* |
| ḡCa(L) | 2.5 |
| ḡCa(N) | 2.5 |
| ḡCa(T) | 0.25 |
| ḡK(DR) | 32 |
| ḡK(A)0 | 5 |
| ḡK(C) | 0.8 |
| ḡK(AHP) | 0.4 |
| ḡleak | 0–0.05 |
Channel conductances were taken from the literature (27).
ḡNa was increased by a factor of 3 to yield an action potential of the appropriate half-width.
Effect of Aβ.
Previously, we showed that Aβ blocks the A current, probably by binding to closed A channels and preventing them from opening, without altering the kinetics of channel opening, kinetics of deactivation, or voltage-dependent properties of the channel (20). We therefore assumed that Aβ has no effect on the state variables m and h. The effect of Aβ on the current was immediate and reversible, hence, we assumed that Aβ binding to the channel is at equilibrium. On the basis of these data, we propose that Aβ blocks a fraction of the channels xb = [Aβ]/(KI + [Aβ]), where KI is the inhibition constant for Aβ blocking the channel and has a value of 1 μM. The value of KI determined previously (10 μM) was based on a concentration of peptide in the delivery pipette and thus represented an upper limit of the true value of the inhibition constant. On the basis of experience, we assumed that a 10-fold dilution of peptide occurred between the delivery pipette and the neuronal membrane, yielding the lower value for KI. The maximum conductance through all of the fast-inactivating potassium channels was expressed as the maximum conductance through all channels in the absence of Aβ, ḡK(A)0, multiplied by the fraction of channels still open, 1 − xb. Ileak was fixed to keep the neuron membrane quiescent when unstimulated and roughly balanced the magnitude of IA at low potentials (−65 mV). The size of Ileak was therefore modified for different [Aβ] to reflect the change in IA .
Model Computations.
The equations were solved using pdasac (32). The solution of the system of equations yields [Ca2+]i as a function of radial distance and time. Values of [Ca2+]i reported were averaged over the entire volume of the neuron. For some simulations, [Ca2+]i was averaged over the time of the simulation as well.
RESULTS
The goal of this work was to demonstrate that Aβ block of the fast-inactivating potassium channel, which we previously identified (20), is a plausible molecular explanation for observed changes in cellular function (principally increased [Ca2+]i and increased excitability) in response to Aβ (16–19, 33, 34). We therefore constructed a model which described the neuron in terms of elementary reactions and diffusion. The model was evaluated under several conditions, first, to ensure that it captured essential features of normal neuronal function, and second, to evaluate the effect of Aβ on neuronal excitability and [Ca2+]i.
Case 1: Single Action Potential.
We simulated the response of the neuron to an injected current pulse Iinject of adjustable magnitude but with a fixed duration of 2 ms. The action potential triggered by an injected current of 0.4 nA in the absence of Aβ has a half-width of approximately 1 ms, and it is followed by a period during which the membrane is hyperpolarized (Fig. 2). The time between the peak membrane potential and the peak [Ca2+]i is less than 2 ms. The time constant for [Ca2+]i decay is on the order of 500 ms. These time constants and the shapes of the curves are generally characteristic of experimental data and model simulation of hippocampal neurons (22, 26, 35).
Figure 2.
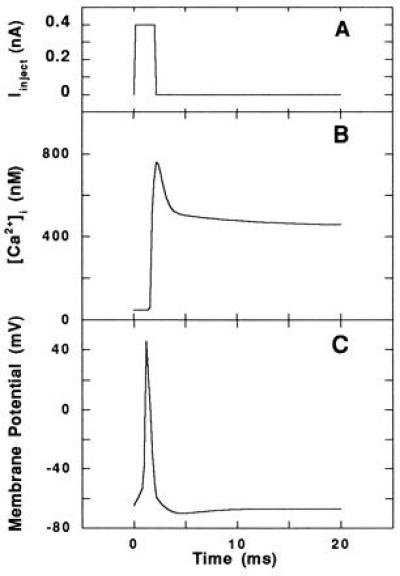
Single action potential in the absence of Aβ. (A) Current pulse injected into the model neuron to evoke the action potential. (B and C) Computed average [Ca2+]i (B) and voltage trajectory (C) of the model neuron in response to the injected current, typical of an action potential in a hippocampal neuron.
Excitability of the model neuron was assessed as a function of [Aβ] by determining the minimum Iinject needed to elicit a response typical of an action potential (Fig. 3A). The threshold current decreased substantially in the presence of Aβ, indicating that Aβ increases the excitability of the neuron at micromolar concentrations.
Figure 3.
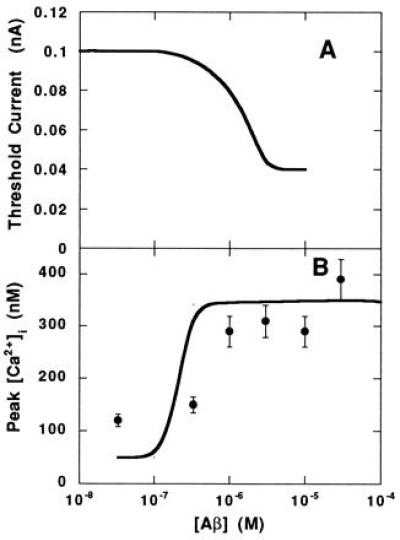
Response of neuron to single action potential in the presence of Aβ. (A) Threshold current needed to evoke an action potential. (B) Peak [Ca2+]i during an injected current pulse as a function of the extracellular [Aβ]. Simulation results (lines) and experimental data (•; ref. 18) are shown.
Peak [Ca2+]i levels were computed at a number of concentrations of Aβ when the stimulus applied to the neuron was 0.08-nA injected current (Fig. 3B). This level is subthreshold in the absence of Aβ. The simulation demonstrates that Aβ increases the peak [Ca2+]i during a single action potential. Experimental data (18) of peak [Ca2+]i during spontaneous action potentials in cultured hippocampal neurons in the presence of Aβ-(25–35) were compared with the simulations (Fig. 3B). Both model simulations and data represent acute responses to Aβ. The simulations reasonably approximate the experimental data in terms of the minimum concentration of Aβ needed to elicit an increase in peak [Ca2+]i and the asymptotic value for [Ca2+]i at high Aβ concentrations.
Case 2: Repetitive AMPA Stimulation.
Previous reports have shown that Aβ increases neuronal sensitivity to glutamate (6, 16). We therefore simulated glutamatergic stimulation of the neuron in the presence of Aβ. A repetitive stimulus was applied to the neuron that approximated the current entering a glutamatergic neuron through AMPA-gated channels (26).
Fig. 4 shows the membrane potential and [Ca2+]i in response to a stimulating AMPA current when no Aβ is present. To assess the excitability of the model neuron in the presence of Aβ, the frequency of response (or action potential generation) was monitored during repetitive AMPA stimulation at different Aβ concentrations. As Aβ concentration increased, the frequency of the response exceeded the frequency of the stimulus (Fig. 5A).
Figure 4.
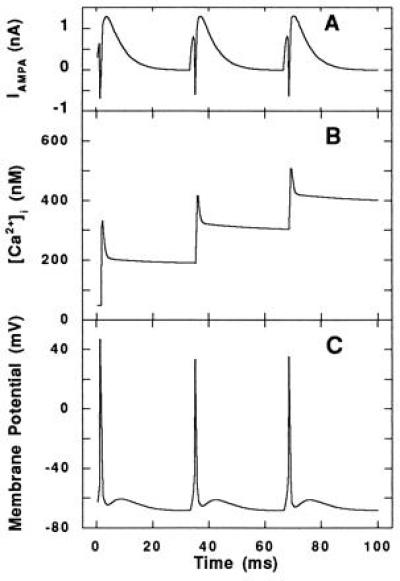
Response to repetitive stimulation at the AMPA receptor in the absence of Aβ. (A) The AMPA current, applied at 30 Hz, used to elicit a repetitive response in the model neuron. (B) The computed average [Ca2+]i and (C) voltage trajectory in response to AMPA stimulation.
Figure 5.
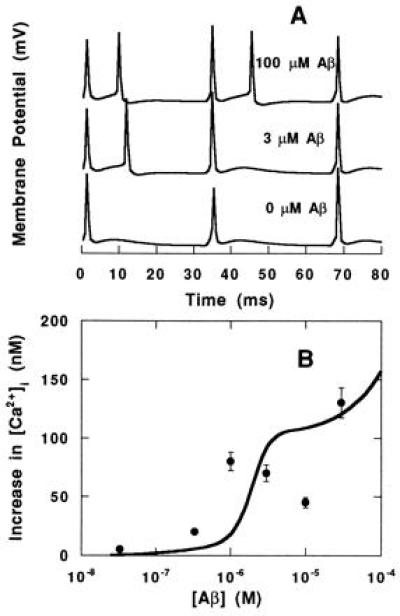
Response to repetitive stimulation at the AMPA receptor in the presence of Aβ. (A and B) Voltage trajectory (A)and average increase in [Ca2+]i (B) during repetitive (30-Hz) AMPA stimulation as a function of extracellular [Aβ]. The average [Ca2+]i increase without application of Aβ was subtracted from the average [Ca2+]i increase with application of Aβ and plotted. Simulation results (lines) and experimental data (•; ref. 18) are shown.
The increase in [Ca2+]i upon repetitive stimulation as a function of Aβ was simulated. [Ca2+]i was averaged over the 100-ms simulation and compared with experimental data from the literature (18). As shown in Fig. 5B, Aβ increased the average change in [Ca2+]i upon AMPA stimulation. The simulation was able to reproduce the experimental data in terms of both concentration dependence and level of response. It should be noted that there are some differences between simulation and experiment: experimentally, [Ca2+]i was obtained by averaging intracellular concentrations over a 1-min period, and spontaneous activity as opposed to a defined stimulus was used to evoke a cellular response.
Correlation with Cell Viability.
Data from the literature (5–15) on cell viability as a function of concentration of Aβ were plotted along with model simulations of the average [Ca2+]i during 100 ms of repetitive AMPA stimulation (Fig. 6). Only studies which reported viability of cortical or hippocampal neurons with Aβ-(25–35) or aged (aggregated) Aβ-(1–40) and Aβ-(1–42) were included. The concentration of Aβ needed to induce increased [Ca2+]i (by simulation) corresponds to the concentration needed to induce toxicity.
Figure 6.
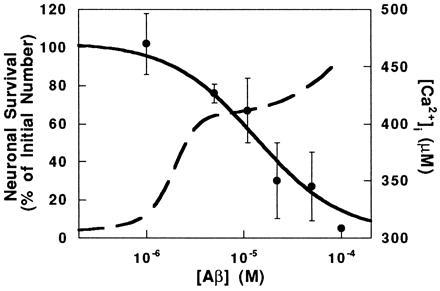
Neuronal viability and Ca2+ response as a function of extracellular [Aβ]. Experimental data (•) of viability were taken from the literature (5–15). Error bars represent the SD of reported values at each [Aβ]. Simulations (broken line) were performed as in Fig. 5B. The left and right scales refer to the experimental data and simulation results, respectively.
DISCUSSION
Brorson et al. (18) showed that acute (≈1-min) exposure of hippocampal neurons to Aβ caused repeatable, reversible, and sustainable increases in intracellular Ca2+ and in membrane excitability, and they suggested that Aβ somehow moved neurons closer to the threshold for firing. Other investigators (17, 33) have shown similar acute responses experimentally, but did not provide a mechanism by which Aβ caused these responses. In this work, we used a mathematical model of a hippocampal neuron to causally link these reported effects to our recent experimental observation that acute application of Aβ blocks the fast-inactivating K+ channel. We compared our simulations of Ca2+ response to Aβ directly with experimental data from the literature (18). When a subthreshold Iinject is used to stimulate the neuron, the magnitude of the simulated changes in [Ca2+]i are similar to the experimentally observed changes in [Ca2+]i (Fig. 3B). When a repetitive AMPA stimulation is used and [Ca2+]i is averaged over time, again, reasonable agreement between simulation and experiment is observed with respect to the minimum Aβ concentration required to elicit an increase in [Ca2+]i and with respect to the level of the increase in [Ca2+]i (Fig. 5B). Several factors must be considered in comparing simulation with experiment. First, simulation results are sensitive to parameter choices. Wherever possible we used well-established values for our simulations. Second, the experimental paradigm could not be simulated exactly: the simulations investigated response of a single neuron to a controlled stimulus, whereas the experimental paradigm most likely represents the additive effects of a neuron being more responsive in the presence of Aβ as well as the neuron receiving more stimulus from the surrounding population, which is again more highly excited in the presence of Aβ. In spite of these caveats, the agreement between data and simulation on both the dosage required for response and the level of response is supportive of our hypothesis.
Our mechanism is consistent with a number of in vitro and in vivo observations. For example, γ-aminobutyric acid (GABA)ergic and calretinin-immunoreactive neurons are relatively spared from Aβ toxicity, possibly due to high Ca2+ buffering capacity (9, 12, 36), and Ca2+ channel density is lower in areas of the AD brain that are less affected by the disease (37, 38). We modified the Ca2+ buffering capacity or Ca2+ channel density in our simulations and showed that neurons with increased Ca2+ buffering ability or fewer Ca2+ channels are less responsive to Aβ block of the A current. For example, a 3-fold increase in the Ca2+ buffer concentration or a 5-fold decrease in Ca2+ channel density leads to 20% lower [Ca2+]i after Aβ exposure. In other studies, increased neuronal excitability has been observed in individuals at risk for developing AD (39). Anticonvulsants, which decrease excitability of the neuron, also decrease Aβ neurotoxicity in vitro (19). Our simulations show that Aβ increases the excitability of the neuron, both by decreasing the amplitude of the stimulus necessary to excite the neuron (Fig. 3A) and by increasing the frequency of response to the same stimulus (Fig. 5A).
As seen in Fig. 6, the transition between nontoxic and toxic concentrations of Aβ seen experimentally overlaps with the transition between concentrations of Aβ incapable and capable of elevating Ca2+ levels determined from our simulations. The agreement in concentration dependence between experiment and simulation is consistent with our hypothesis that Aβ block of the A current is an early critical step in the molecular mechanism by which Aβ kills neurons. Toxicity is generally assayed after long-term (hours to days) exposure of neuronal cultures to Aβ and is presumably the cumulative result of a number of events. Interactions of Aβ with a number of other cell membrane components have been reported (for example, see refs. 40–42); these interactions could have additional effects on neuronal toxicity that are not accounted for in our model.
Our model of the action of Aβ on a hippocampal neuron demonstrates that the block of the fast-inactivating potassium channel by Aβ is sufficient to initiate a cascade of events—membrane depolarization, calcium influx, and increased excitability—that have been observed in vitro. Other events induced by Aβ, possibly subsequent to and/or caused by Ca2+ entry, such as tyrosine phosphorylation (43) and free radical damage (44), will also determine the response of neurons to chronic exposure to Aβ.
Acknowledgments
Helpful discussions with Dr. Warren Stewart are gratefully acknowledged. Financial support was provided by National Institutes of Health Biotechnology Training Grant 5T326 M08349 (T.A.G.) and the National Science Foundation Presidential Young Investigator Program (R.M.M.).
Footnotes
Abbreviations: [Ca2+]i, intracellular Ca2+ concentration; Aβ, β-amyloid; AD, Alzheimer disease; AMPA, α-amino-3-hydroxy-5-methyl-4-isoxazolepropionic acid.
References
- 1.Ghosh A, Greenberg M. Science. 1995;268:239–247. doi: 10.1126/science.7716515. [DOI] [PubMed] [Google Scholar]
- 2.Randall R D, Thayer S A. J Neurosci. 1992;12:1882–1895. doi: 10.1523/JNEUROSCI.12-05-01882.1992. [DOI] [PMC free article] [PubMed] [Google Scholar]
- 3.Selkoe D J. Trends NeuroSci. 1993;16:403–409. doi: 10.1016/0166-2236(93)90008-a. [DOI] [PubMed] [Google Scholar]
- 4.Games D, Adams D, Alessandrini R, Barbour R, Berthelette P, et al. Nature (London) 1995;373:523–527. doi: 10.1038/373523a0. [DOI] [PubMed] [Google Scholar]
- 5.Lockhart B P, Benicourt C, Junien J-L, Privat A. J Neurosci Res. 1994;39:494–505. doi: 10.1002/jnr.490390416. [DOI] [PubMed] [Google Scholar]
- 6.Mattson M P, Tomaselli K P, Rydel R E. Brain Res. 1993;621:35–49. doi: 10.1016/0006-8993(93)90295-x. [DOI] [PubMed] [Google Scholar]
- 7.Pike C J, Burdick D, Walencewicz A J, Glabe C G, Cotman C W. J Neurosci. 1993;13:1676–1687. doi: 10.1523/JNEUROSCI.13-04-01676.1993. [DOI] [PMC free article] [PubMed] [Google Scholar]
- 8.Weiss J H, Pike C J, Cotman C W. J Neurochem. 1994;62:372–375. doi: 10.1046/j.1471-4159.1994.62010372.x. [DOI] [PubMed] [Google Scholar]
- 9.Pike C J, Cotman C W. Brain Res. 1995;671:293–298. doi: 10.1016/0006-8993(94)01354-k. [DOI] [PubMed] [Google Scholar]
- 10.Pike C J, Walencewicz A J, Glabe C G, Cotman C W. Brain Res. 1991;563:311–314. doi: 10.1016/0006-8993(91)91553-d. [DOI] [PubMed] [Google Scholar]
- 11.Pike C J, Walencewicz A J, Glabe C G, Cotman C W. Eur J Pharmacol. 1991;207:367–368. doi: 10.1016/0922-4106(91)90014-9. [DOI] [PubMed] [Google Scholar]
- 12.Pike C J, Cotman C W. Neuroscience (Oxford) 1993;56:269–274. doi: 10.1016/0306-4522(93)90331-9. [DOI] [PubMed] [Google Scholar]
- 13.Simmons L K, May P C, Tomaselli K J, Rydel R E, Fuson K S, Brigham E F, Wright S, Lieberburg I, Becker G W, Brems D N, Li W Y. Mol Pharmacol. 1994;45:373–379. [PubMed] [Google Scholar]
- 14.Wujek J R, Dority M D, Frederickson R, Brunden K R. Neurobiol Aging. 1996;17:107–113. doi: 10.1016/0197-4580(95)02020-9. [DOI] [PubMed] [Google Scholar]
- 15.Goodman Y, Mattson M P. Brain Res. 1994;650:170–174. doi: 10.1016/0006-8993(94)90223-2. [DOI] [PubMed] [Google Scholar]
- 16.Mattson M P, Cheng B, Bryant K, Lieberburg I, Rydel R E. J Neurosci. 1992;12:376–389. doi: 10.1523/JNEUROSCI.12-02-00376.1992. [DOI] [PMC free article] [PubMed] [Google Scholar]
- 17.Hartmann H, Eckert A, Muller W E. Biochem Biophys Res Commun. 1993;194:1216–1220. doi: 10.1006/bbrc.1993.1952. [DOI] [PubMed] [Google Scholar]
- 18.Brorson J R, Bindokas V P, Iwama T, Marcuccilli C J, Chisholm J C, Miller R J. J Neurobiol. 1995;26:325–338. doi: 10.1002/neu.480260305. [DOI] [PubMed] [Google Scholar]
- 19.Mark R J, Ashford J W, Goodman Y, Mattson M P. Neurobiol Aging. 1995;16:187–198. doi: 10.1016/0197-4580(94)00150-2. [DOI] [PubMed] [Google Scholar]
- 20.Good T A, Smith D O, Murphy R M. Biophys J. 1996;70:296–304. doi: 10.1016/S0006-3495(96)79570-X. [DOI] [PMC free article] [PubMed] [Google Scholar]
- 21.Yamada W M, Koch C, Adams P R. In: Methods in Neuronal Modeling. Koch C, Segev, editors. Cambridge, MA: MIT Press; 1989. pp. 97–133. [Google Scholar]
- 22.Sala F, Hernandez-Cruz A. Biophys J. 1990;57:313–324. doi: 10.1016/S0006-3495(90)82533-9. [DOI] [PMC free article] [PubMed] [Google Scholar]
- 23.Traub R D, Wong R K S, Miles R, Michelson H. J Neurophysiol. 1991;66:635–650. doi: 10.1152/jn.1991.66.2.635. [DOI] [PubMed] [Google Scholar]
- 24.Wang S S-H, Thompson S H. Biophys J. 1995;69:1683–1697. doi: 10.1016/S0006-3495(95)80086-X. [DOI] [PMC free article] [PubMed] [Google Scholar]
- 25.Helmchen F, Imoto K, Sakmann B. Biophys J. 1996;70:1069–1081. doi: 10.1016/S0006-3495(96)79653-4. [DOI] [PMC free article] [PubMed] [Google Scholar]
- 26.Jaffe D B, Ross W N, Lisman J E, Lasser-Ross N, Miyakawa H, Johnston D. J Neurophysiol. 1994;71:1065–1077. doi: 10.1152/jn.1994.71.3.1065. [DOI] [PubMed] [Google Scholar]
- 27.Migliore M, Cook E P, Jaffe D B, Turner D A, Johnston D. J Neurophysiol. 1995;73:1157–1168. doi: 10.1152/jn.1995.73.3.1157. [DOI] [PubMed] [Google Scholar]
- 28.Jafri M S, Keizer J. Biophys J. 1995;69:2139–2153. doi: 10.1016/S0006-3495(95)80088-3. [DOI] [PMC free article] [PubMed] [Google Scholar]
- 29.Friel D D. Biophys J. 1995;68:1752–1766. doi: 10.1016/S0006-3495(95)80352-8. [DOI] [PMC free article] [PubMed] [Google Scholar]
- 30.Hagiwara S, Byerly L. Annu Rev Neurosci. 1981;4:69–125. doi: 10.1146/annurev.ne.04.030181.000441. [DOI] [PubMed] [Google Scholar]
- 31.Miyakawa H, Ross W N, Jaffe D, Callaway J C, Lasser-Ross N, Lisman J E, Johnston D. Neuron. 1992;9:1163–1173. doi: 10.1016/0896-6273(92)90074-n. [DOI] [PubMed] [Google Scholar]
- 32.Caracotsios M, Stewart W E. Computers Chem Eng. 1995;19:1019–1030. [Google Scholar]
- 33.Joseph R, Han E. Biochem Biophys Res Commun. 1992;184:1441–1447. doi: 10.1016/s0006-291x(05)80044-0. [DOI] [PubMed] [Google Scholar]
- 34.Fukuyama R, Wadhwani K, Galdzicki Z, Rapoport S, Ehrenstein G. Brain Res. 1994;667:269–272. doi: 10.1016/0006-8993(94)91505-9. [DOI] [PubMed] [Google Scholar]
- 35.Markram H, Helm P J, Sakmann B. J Physiol (London) 1995;485:1–20. doi: 10.1113/jphysiol.1995.sp020708. [DOI] [PMC free article] [PubMed] [Google Scholar]
- 36.Harkany T, De Jong G I, Soos K, Penke B, Luiten P G M, Gulya K. Brain Res. 1995;698:270–274. doi: 10.1016/0006-8993(95)01013-l. [DOI] [PubMed] [Google Scholar]
- 37.Kerr L M, Filloux F, Olivera B M, Jackson H, Wamsley J K. Eur J Pharmacol. 1988;146:188–183. doi: 10.1016/0014-2999(88)90501-8. [DOI] [PubMed] [Google Scholar]
- 38.Mann D M, Snowden J S. Acta Neuropathol. 1995;89:178–183. doi: 10.1007/BF00296363. [DOI] [PubMed] [Google Scholar]
- 39.Boutros N, Torello M, Burns E, Wu S-S, Nasrallah H. Psychiatry Res. 1995;57:57–63. doi: 10.1016/0165-1781(95)02597-p. [DOI] [PubMed] [Google Scholar]
- 40.Mark R J, Hensley K, Butterfield C A, Mattson M P. J Neurosci. 1995;15:6239–6249. doi: 10.1523/JNEUROSCI.15-09-06239.1995. [DOI] [PMC free article] [PubMed] [Google Scholar]
- 41.Yan S D, Chen X, Fu J, Chen M, Zhu H, Roher A, Slattery T, Zhao L, Nagashima M, Morser J, Migheli A, Nawroth P, Stern D, Schmidt A M. Nature (London) 1996;382:685–691. doi: 10.1038/382685a0. [DOI] [PubMed] [Google Scholar]
- 42.El Khoury J, Hickman S E, Thomas C A, Cao L, Silverstein S C, Loike J D. Nature (London) 1996;382:716–719. doi: 10.1038/382716a0. [DOI] [PubMed] [Google Scholar]
- 43.Lou Y Q, Hirashima N, Li Y H, Alkon D L, Sunderland T, Etcheberrigaray R, Wolozin B. Brain Res. 1995;681:65–74. doi: 10.1016/0006-8993(95)00282-u. [DOI] [PubMed] [Google Scholar]
- 44.Hensley K, Carney J, Mattson M, Aksenova M, Harris M, Wu F, Floyd R, Butterfield D. Proc Natl Acad Sci USA. 1994;91:3270–3274. doi: 10.1073/pnas.91.8.3270. [DOI] [PMC free article] [PubMed] [Google Scholar]


