

Abstract
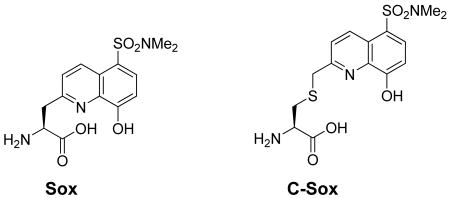
Catalyzed by kinases, serine/threonine and tyrosine phosphorylation is a vital mechanism of intracellular regulation. Thus, assays that easily monitor kinase activity are critical in both academic and pharmaceutical settings. We previously developed sulfonamido-oxine (Sox)-based fluorescent peptides following a β-turn focused (BTF) design for the continuous assay of kinase activity in vitro and in cell lysates. Upon phosphorylation of the Sox-containing peptide, the chromophore binds Mg2+ and undergoes chelation-enhanced fluorescence (CHEF). While the design was applied successfully to the development of several kinase sensors, an intrinsic limitation was that only residues C- or N-terminal to the phosphorylated residue could be used to derive specificity for the target kinase. To address this limitation, a new, recognition-domain focused (RDF) strategy has been developed that also relies on CHEF. In this approach, the requirement for the constrained β-turn motif is obviated by alkylation of a cysteine residue with a Sox-based derivative to afford an amino acid termed C-Sox. The RDF design allows inclusion of extended binding determinants to maximize recognition by the cognate kinase, which has now permitted the construction of chemosensors for a variety of representative Ser/Thr (PKCα, PKCβI, PKCδ, Pim2, Akt1, MK2 and PKA), as well as receptor (IRK) and non-receptor (Src, Abl) Tyr kinases with greatly enhanced selectivity. The new sensors have up to 28-fold improved catalytic efficiency and up to 66-fold lower KM when compared to the corresponding BTF probes. The improved generality of the strategy is exemplified with the synthesis and analysis of Sox-based probes for PKCβI and PKCδ, which were previously unattainable using the BTF approach.
Introduction
Intracellular phosphorylation, triggered by extracellular signals and carried out by protein kinases (PKs), is the leading mechanism by which a cell turns on or off diverse sets of processes.1-6 Dysfunctions in the actions of PKs, or aberrations in the activities of key components of the signaling pathways that they activate, result in severe illnesses such as cancer, diabetes, immune deficiencies, and cardiovascular diseases.7,8 Sensitive and selective tools for monitoring target kinase activities are invaluable in academic and pharmaceutical settings not only for new drug discovery,9 but also for unraveling the multifarious signaling cascades in which these enzymes are pivotal.
Traditional assays for kinase activity use either phosphopeptide-specific antibodies or, more commonly, [γ-32P]ATP where transfer of the radioactive γ-phophoryl group to substrate is quantified by scintillation counting. Although general and sensitive, [32P]-based assays are not compatible with physiological concentrations of ATP, real-time analysis or high-throughput kinetic determination. Furthermore, such assays require special handling, generate radioactive waste, and lose much of the kinetic information due to their intrinsic end-point nature. On the other hand, continuous assays that rely on fluorescence changes upon sensor phosphorylation are ideal for high throughput screening (HTS) and thus make discovery of new inhibitors and substrates with enhanced specificity much more practical. Fluorescence-based assays may also be compatible with cell lysates, living cells and physiological ATP concentrations. Existing fluorescent protein- and peptide-based sensors exploit a variety of detection methods such as fluorescence polarization, fluorescence or luminescence resonance energy transfer (FRET or LRET, respectively), quenching, metal-ion enhancement and solvatochromism, and have been recently reviewed.10-13 In general, these probes exhibit modest fluorescence changes (up to 0.6-fold for FRET-based approaches) that limit their sensitivity. Several notable exceptions, especially for Tyr kinases,14 have been reported in the literature in the last few years, particularly from the Lawrence group.12
One of the major challenges in the field of kinase analysis is sensor specificity. With more than 500 different kinases encoded in the human genome,2 closely related enzymes will inevitably phosphorylate some of the same substrates. This is particularly true of peptide-based probes, which lack several of the characteristics of protein substrates in living systems. For example, in cells, kinases gain specificity based not only on proximal recognition sequences, but also on spatial and temporal control that the cell exercises over an enzyme and its protein substrate (i.e. by providing both in the same location at the same time). Furthermore, protein substrates can be involved in docking or scaffolding interactions that occur distal to the phosphorylation site and may derive specificity based primarily on those protein-protein contacts, rather than the short sequence surrounding the phorphorylatable residue. One way to develop sensors that are better able to discriminate between multiple kinases (whether in vitro, in vivo or in cell lysates) is by improving the kinetic parameters (lower the KM while keeping the Vmax high); this can be accomplished either by employing unnatural recognition elements15 or by extending the kinase recognition domain.
Recently, our laboratory has reported guidelines for the design of chemosensors that exhibit large fluorescence increases (4- to 12-fold) upon phosphorylation.16 The approach, termed the β-turn focused (BTF) design, exploits the chelation-enhanced fluorescence (CHEF) of the sulfonamido-oxine amino acid Sox.17 When incorporated into a modular peptide chemosensor design that also includes part of the kinase recognition motif (either C- or N-terminal to the phosphorylation site) and a constrained β-turn motif, the affinity for Mg2+ is low in the absence of the phosphoryl group. In contrast, upon phosphorylation, the Mg2+ affinity dramatically increases due to an advantageous chelate effect (Figure 1). The BTF design has been successfully applied for the development of chemosensors that monitor kinases both in vitro18 and in unfractionated cell extracts.19 However, although versatile, the BTF design does not allow for exploitation of the full peptide recognition sequence due to the limitations imposed by the requirement for a conformationally-constrained β-turn motif.
Figure 1.

Schematic representations of the BTF and RDF designs from optimized non-fluorescent substrates. Highlighted is the fact that the recognition elements are fully conserved in the RDF design and only partially so in the BTF design due to the required β-turn. Upon kinase-catalyzed phosphorylation, the sensors become fluorescent (λex = 360 nm, λem = 485 nm). The Sox chromophore can be positioned N- or C-terminal to the Ser/Thr/Tyr residue in both designs.
To address the issues surrounding probe specificity, herein we report a more versatile and powerful chemosensor design that also exploits CHEF and is recognition-domain focused (RDF). The advantages of the new strategy are exemplified by the development of probes with greatly improved kinetic parameters for a variety of representative Ser/Thr and Tyr (non-receptor and receptor) kinases: protein kinase C (PKC) isozymes (α, βI and δ),20 protein kinase A (PKA),21,22 protein kinase B/Akt1,23,24 mitogen-activated protein kinase-activated protein kinase-2 (MK2),25,26 Pim2,27 Abelson kinase (Abl),28 sarcoma kinase (Src),29-31 and insulin receptor kinase (IRK).32,33 The RDF approach circumvents the constrained β-turn motif, which is required for optimal binding of Mg2+ by Sox and the phosphorylated residue in the BTF design, by alkylation of a cysteine residue with a Sox chromophore derivative to afford an amino acid termed C-Sox. The C-Sox containing peptides are flexible enough to effectively coordinate Mg2+ even without the preorganizationing β-turn. Thus, while the intrinsic nature of the BTF design necessitates removal of recognition elements from one terminus of an optimal peptide-based substrate, the RDF design allows for the inclusion of extended binding determinants to maximize recognition by the cognate kinase (Figure 1).
Results and Discussion
Synthesis of RDF Sensors
The RDF chemosensor peptides can be constructed in two ways. In the first approach, Fmoc-based solid phase peptide synthesis (SPPS) is utilized to assemble the intact peptide that includes an appropriately placed cysteine protected with a hyper acid-labile group (Scheme 1). After selective on-resin sulfhydryl group deprotection, the free thiol is alkylated with Sox-Br.17 Standard TFA cleavage from the resin and concomitant removal of all side chain protecting groups reveals the desired chemosensor with excellent conversion to the alkylated product (>95%). The solid support-based alkylation is particularly valuable when utilizing automated SPPS or SPOT34 synthesis to generate libraries of peptides in a rapid manner.
Scheme 1.

Synthesis of RDF chemosensors (a) on solid support and (b) using the building block approach.a
a Reagents and conditions: (a) 1% TFA, 5% TIS, CH2Cl2, 5 × 20 min; (b) Sox-Br, TMG, DMF, 12 h (95%); (c) 95% TFA, 2.5% TIS, 2.5% H2O, 3 h; (d) Allyl-Br, Cs2CO3, MeOH/DMF; (e) 5% TFA, 5% TIS, CH2Cl2 (69% for two steps); (f) Sox-Br, i-Pr2NEt, CH2Cl2 (95%); (g) Pd(PPh3)4, PhSiH3, CH2Cl2 (77% crude).
Alternatively, if larger amounts of a more limited range of chemosensor peptides are needed, a building block approach may be more appropriate. In this case, the synthesis of the building block, Fmoc-C(Sox[TBDPS])-OH (3), commences with the allylation of commercially available amino acid 1, followed by removal of the p-methoxytrityl (Mmt) masking group to afford 2 (Scheme 1). The sulfhydryl of 2 is then alkylated with Sox-Br17 in excellent yield (95%). Lastly, Pd(II)-assisted deallylation produces the desired amino acid 3 that was subsequently used in standard Fmoc-based SPPS to produce RDF sensors in excellent yields. Peptide identities and purities were confirmed via matrix-assisted laser desorption ionization time-of-flight (MALDI TOF) or electrospray ionization (ESI) mass spectrometry together with high performance liquid chromatography (HPLC) analysis. The synthesis of C-Sox, and therefore of RDF peptides, is considerably more facile since we used a chiral starting material 1 and were able to completely circumvent the key asymmetric alkylation transformation that was used to install the stereogenic center in the Sox amino acid17—a key component of the BTF design.
Chromophore Positioning in the RDF Design
The first task with the RDF approach was to determine the optimal placement of the Sox chromophore within the probes. Several substrate and corresponding phosphopeptide sensors were synthesized in which the C-Sox was positioned at various sites relative to the phosphorylatable residue. The probes were evaluated based on the observed fluorescence increases (Table 1) because one of the main priorities was to obtain sensors with a robust signal for easy assay readout. Larger fluorescence increases also generally indicate tighter binding of Mg2+ as has been demonstrated with the BTF chemosensors.16,18 The difference in fluorescence was determined by comparison of the fluorescence intensity at the maximum emission wavelength (485 nm) of synthetic phosphorylated and unphosphorylated peptides in the presence of Mg2+. We also calculated Z′ factor values for each RDF chemosensor pair (see Supporting Information), which is a statistical quality parameter used to evaluate and validate performance of assays, particularly in HTS.35 Typically, in order for an HTS assay to be considered useful, Z′ should be 0.5-1, as assays in this range exhibit large dynamic ranges and separation bands.
Table 1.
Optimal Positioning of the Sox Chromophore in Substrates for Ser/Thr and Tyr Kinases
| Entry | Peptide Sequencea | Fold Fluorescence Increaseb | Z′c | |||||||||||||||
|---|---|---|---|---|---|---|---|---|---|---|---|---|---|---|---|---|---|---|
| -5 | -4 | -3 | -2 | -1 | 0 | +1 | +2 | +3 | +4 | +5 | +6 | +7 | +8 | |||||
| 1 | Ac | R | R | R | K | CSox | S | F | R | R | K | A | CONH2 | 1.6 ± 0.1 | 0.82 | |||
| 2 | Ac | R | R | R | CSox | G | S | F | R | R | K | A | CONH2 | 2.9 ± 0.3 | 0.55 | |||
| 3 | Ac | R | R | R | CSox | A | S | F | R | R | K | A | CONH2 | 3.7 ± 0.2 | 0.84 | |||
| 4 | Ac | V | P | L | L | T | P | CSox | G | R | R | G | COOH | 5.4 ± 0.1 | 0.84 | |||
| 5 | Ac | V | P | L | L | T | P | G | CSox | R | R | G | COOH | 6.3 ± 0.2 | 0.80 | |||
| 6 | Ac | V | P | CSox | L | T | P | G | G | R | R | G | COOH | 6.9 ± 0.1 | 0.86 | |||
| 7 | Ac | E | CSox | I | Y | A | A | P | F | A | K | K | K | CONH2 | 4.6 ± 0.5 | 0.91 | ||
| 8 | Ac | CSox | A | I | Y | A | A | P | F | A | K | K | K | CONH2 | 3.2 ± 0.3 | 0.74 | ||
| 9 | Ac | CSox | E | A | I | Y | A | A | P | F | A | K | K | K | CONH2 | 2.1 ± 0.2 | 0.43 | |
| 10 | Ac | E | A | I | Y | A | A | CSox | F | A | K | K | K | CONH2 | 2.2 ± 0.1 | 0.64 | ||
Phosphorylatable residue is bolded and set as the 0 position.
Measured in triplicate as a quotient of fluorescence intensity at 485 nm of phosphopeptide and substrate in 20 mM HEPES (pH 7.4), 10 mM MgCl2, and 10 μM peptide.
Z′ factors were calculated using standard deviations and means (from triplicate measurements) of non-phosphorylated substrate (background) and synthetic phosphopeptide (signal) in the same conditions as reported for fluorescence increases.
It is clear from high fluorescence enhancements that position +2 or −2 is favored over +1 or −1 in the case of sensors for Ser/Thr kinases (e.g. compare entry 1 with 2 and 3 in Table 1). Since the Tyr residue is significantly larger than Ser/Thr, placement of the Sox chromophore in position +3 or +4 or −3 or −4 was expected to yield the largest increase in fluorescence upon phosphorylation (e.g. entries 8-10). However, the peptide with C-Sox in the −2 (or +2) position (e.g. entry 7) is the preferred Tyr-containing probe in this series. In addition to having the largest fluorescence increases, peptide pairs with C-Sox in the optimal +2 or −2 position also have the highest Z′ factor values, making them particularly useful for high-throughput screens.
Some kinases, such as ERK1/2, require Pro immediately next to the phosphorylatable residue (i.e. in position +1) for substrate recognition. As expected, the largest fluorescence enhancement is achieved when the chromophore is located on the side opposite of the Pro reside (relative to the phosphorylatable residue), in position −2 (e.g. entry 6). However, if the residues in that region are important in kinase recognition, C-Sox has to be placed on the same side as Pro. In such a case, a higher fluorescence increase is achieved when the fluorophore is placed in the +3 rather than the +2 position (e.g. compare entries 4 and 5). This flexibility is unique to the RDF design as the β-turn of the BTF design generally dictates, and restricts, the position of the fluorophore. Lastly, an additional improvement in fluorescence difference, and a further increase in Mg2+ affinity (Table S1 in Supporting Information), can be achieved by selecting an α-substituted amino acid rather than glycine at the −1 position between C-Sox and the Ser/Thr phosphorylation site (e.g. compare entries 2 and 3).
Fluorescence Properties of RDF Probes
After determination of the optimal chromophore position it was possible to examine a more comprehensive set of RDF probes by comparing their fluorescence differences to those of their BTF counterparts. Overall, the RDF reporters have robust fluorescence increases and high Z′ values (Table 2). A range of 2- to 10-fold enhancement is observed due to the differing affinity for Mg2+ among the phosphopeptides. The RDF peptides also normally exhibit larger fluorescence increases than their BTF counterparts. More specifically, the RDF sensors for Src, Abl, IRK, PKCβI and ERK1/2 kinases have higher fluorescence differences than the corresponding BTF sensors. While this trend is reversed for PKCα, PKCδ, Akt1 and MK2 kinases, the fluorescence increases are still large enough for these to be useful probes in kinetic assays (vide infra). In the case of Pim2 and PKA, both designs afford probes with comparable fluorescence properties. Furthermore, the C-Sox moiety is tolerant of acidic (entries 2, 4 and 6), basic (entries 6, 8, 10, 16 and 18), aliphatic (entries 2, 4, 18, 20 and 22) and aromatic (entries 12 and 16) residues immediately flanking it. The chromophore can also be placed C- or N-terminal to the phosphorylatable residue, which gives great flexibility in the initial design stage. These results demonstrate that the RDF design is general enough to be applied to synthesis of sensors for a variety of important Ser and Thr (ERK1/2, entry 22) kinases as well as for non-receptor and receptor (IRK, entry 6) Tyr kinases.
Table 2.
Comparison of Substrate Sequences and Fluorescence Increases for BTF and RDF Chemosensors
| Entry | Target Kinase | Design | Location of the Chromophorea | Substrate Sequenceb | Fold Fluorescence Increasec | Z′d |
|---|---|---|---|---|---|---|
| 1 | Src | BTF | N | Ac-Sox-PEIY*GEFEAKKKK-CONH2 | 1.6 ± 0.1 | |
| 2 | RDF | N | Ac-AEE-CSox-IY*GEFEAKKKK-CONH2 | 2.0 ± 0.1 | 0.85 | |
| 3 | Abl | BTF | N | Ac-Sox-PGIY*AAPFAKKK-CONH2 | 3.6e | |
| 4 | RDF | N | Ac-E-CSox-IY*AAPFAKKK-CONH2 | 4.6 ± 0.5 | 0.91 | |
| 5 | IRK | BTF | N | Ac-Sox-PGDY*-Nle-TMQIGKK-CONH2 | 2.0 ± 0.1 | |
| 6 | RDF | N | Ac-R-CSox-DY*-Nle-TMQIGKK-CONH2 | 4.2 ± 0.1 | 0.77 | |
| 7 | PKCα | BTF | N | Ac-Sox-PGS*FRRR-CONH2 | 6.7 ± 0.6 | |
| 8 | RDF | N | Ac-RRR-CSox-AS*FRRR-CONH2 | 3.7 ± 0.2 | 0.84 | |
| 9 | PKCβI | BTF | N | Ac-Sox-PAS*FKKFA-CONH2 | 4.7 ± 0.2 | |
| 10 | RDF | N | Ac-LKR-CSox-AS*FKKFA-CONH2 | 9.7 ± 0.5 | 0.87 | |
| 11 | PKCδ | BTF | C | Ac-RKRKGS*F-dPro-Sox-G-CONH2 | 12.1 ± 0.1 | |
| 12 | RDF | C | Ac-RKRKGS*F-CSox-YGG-CONH2 | 7.3 ± 0.1 | 0.94 | |
| 13 | Pim2 | BTF | C | Ac-ARKRRRHPS*G-dPro-Sox-G-CONH2 | 3.0 ± 0.4 | |
| 14 | RDF | C | Ac-ARKRRRHPS*G-CSox-PTA-CONH2 | 3. 2 ± 0.1 | 0.89 | |
| 15 | Akt1 | BTF | C | Ac-ARKRERAYS*F-dPro-Sox-G-CONH2 | 7.6 ± 0.6 | |
| 16 | RDF | C | Ac-ARKRERAYS*F-CSox-HHA-CONH2 | 3.9 ± 0.3 | 0.89 | |
| 17 | MK2 | BTF | C | Ac-AHLQRQLS*I-dPro-Sox-G-CONH2 | 7.7 ± 0.9 | |
| 18 | RDF | C | Ac-AHLQRQLS*I-CSox-HH-CONH2 | 4.4 ± 0.2 | 0.85 | |
| 19 | PKA | BTF | C | Ac-LRRAS*L-dPro-Sox-G-CONH2 | 5.3 ± 0.1 | |
| 20 | RDF | C | Ac-ALRRAS*L-CSox-AA-CONH2 | 5.0 ± 0.2 | 0.95 | |
| 21 | ERK1/2 | BTF | N | Ac-Sox-PLT*PGGRRG-COOH | 2.9 ± 0.1 | |
| 22 | RDF | N | Ac-VP-CSox-LT*PGGRRG-COOH | 6.9 ± 0.1 | 0.86 | |
In reference to the phosphorylatable residue.
Asterisk (*) denotes the residue that is phosphorylated. In cases where it has been determined, residues important in kinase recognition are underlined. Norleucine is designated as Nle.
Measured in triplicate as a quotient of fluorescence intensity at 485 nm of phosphopeptide and substrate in 20 mM HEPES (pH 7.4), 10 mM MgCl2, and 10 μM peptide (λex = 360 nm, λem = 485 nm).
Z′ factors were only calculated for RDF chemosensors using standard deviations and means (from triplicate measurements) of non-phosphorylated substrate (background) and synthetic phosphopeptide (signal) in the same conditions as reported for fluorescence increases.
Originally reported in reference 42 as the mean of triplicate experiments without s.e.m.
While the RDF sensors exhibited strong fluorescence increases under standard assay conditions, we also examined their properties in media that more closely resemble physiological ATP and Mg2+ concentrations (0.8-1 mM36 and 0.5-5 mM,37 respectively). As was the case without ATP (Table 2), the fluorescence enhancements in the presence of cellular concentrations of ATP for 11 of 13 chemosensors are quite robust (Table S2). Additionally, fluorescence differences of RDF probes that contain acidic residues (such as many substrates for Tyr kinases) near the Sox chromophore tend to improve with lower Mg2+ concentrations. Acidic side chains may help to recruit Mg2+ ions, increasing the background fluorescence from the unphosphorylated substrate. As [Mg2+] is lowered, however, the substrate fluorescence becomes less intense while the phosphopeptide remains unchanged, resulting in an effective increase in fluorescence differences. Under more extreme conditions, such as with low [Mg2+] and high [ATP], the fluorescence difference somewhat decreases, but even so most of the Tyr-containing sensors exhibit useful fluorescence enhancements (Table S3). These promising results indicate that the RDF probes may also be translatable for use in cellular environments.
Comparison of Kinetic Parameters for BTF and RDF Chemosensors
In order to validate the advantages of the new RDF chemosensors over the corresponding BTF sensors in kinase assays, we compared their selectivities toward 11 different enzymes. Accommodation of the β-turn motif in the BTF design required elimination of several N- or C-terminal residues that are either known to be involved in kinase recognition (underlined residues in Table 2) or that could be used to impart enzyme specificity through library screening. On the other hand, the RDF probes should benefit from inclusion of the entire kinase recognition motif.
In addition to demonstrating robust fluorescence increases under various enzyme reaction conditions (which may include detergents, lipids, reducing agents, et cetera, Tables S4 and S5), for 8 of 11 kinases there were improvements in both the KM and Vmax parameters (Table 3). The results indicate that the RDF design is particularly useful in creating peptidyl sensors for kinases that require multiple residues both N- and C-terminal to the site of phosphorylation for adequate substrate recognition, as is the case for PKCα, PKCβI and PKCδ.38 This is reflected in the catalytic efficiency (kcat/KM) of phosphoryl transfer by PKCα to its RDF chemosensor that is 27 times greater than that of the BTF chemosensor (compare entries 7 to 8). A remarkable 66-fold improvement in the KM value of the RDF probe was also observed (entry 8), thereby underscoring the importance of the basic N-terminal sequence in the PKCα chemosensor selectivity. Even more strikingly, the BTF sensors for PKCβI and PKCδ (entries 9 and 11) show no appreciable turnover (Figure S3), whereas the corresponding RDF probes (entries 10 and 12) are excellent substrates. Furthermore, they display kinetic parameters that are in close agreement with published values for their non-sensing (parent) peptides, once again demonstrating that the C-Sox sensing module does not negatively interfere with substrate binding to the kinase.
Table 3.
Comparison of Kinetic Parameters Obtained with BTF and RDF Substrates
| Entry | Target Kinase | Design | KM (μ-M)a | Vmax (μmol mg-1 min-1)a | Catalytic Efficiencyb | Parent KM (μM)c |
|---|---|---|---|---|---|---|
| 1 | Src | BTF | 30.7 ± 5.8 | 0.54 ± 0.04 | 1 | 3344 |
| 2 | RDF | 7.0 ± 1.0 | 3.4 ± 0.2 | 28 | ||
| 3 | Abl | BTF | 26 ± 5d | 9.3 ± 0.5d | 1 | 444 |
| 4 | RDF | 10.5 ± 1.5 | 19.1 ± 1.0 | 5 | ||
| 5 | IRK | BTF | 25.7 ± 0.7 | 7.3 ± 2.2 | 1 | 2439 |
| 6 | RDF | 27.1 ± 3.9 | 6.3 ± 0.4 | 1 | ||
| 7 | PKCα | BTF | 8.6 ± 2.9e | 5.9 ± 1.9e | 1 | 3.838 |
| 8 | RDF | 0.13 ± 0.02 | 2.4 ± 0.1 | 27 | ||
| 9 | PKCβI | BTF | NSf | NSf | NAg | 2.838 |
| 10 | RDF | 0.81 ± 0.18 | 0.76 ± 0.06 | NAg | ||
| 11 | PKCδ | BTF | NSf | NSf | NAg | 0.9838 |
| 12 | RDF | 0.48 ± 0.07 | 0.39 ± 0.02 | NAg | ||
| 13 | Pim2 | BTF | 2.3 ± 0.2h | 0.52 ± 0.12h | 1 | 1.245 |
| 14 | RDF | 1.4 ± 0.1 | 0.67 ± 0.02 | 2 | ||
| 15 | Akt1 | BTF | 3.8 ± 0.2h | 0.59 ± 0.14h | 1 | 8.846 |
| 16 | RDF | 0.69 ± 0.11 | 2.5 ± 0.2 | 23 | ||
| 17 | MK2 | BTF | 21 ± 2h | 2.3 ± 0. 2h | 1 | 3147 |
| 18 | RDF | 1.2 ± 0.2 | 1.3 ± 0.1 | 10 | ||
| 19 | PKA | BTF | 2.7 ± 0.4 | 26.5 ± 1.1 | 1 | 1640 |
| 20 | RDF | 2.6 ± 0.3 | 17.9 ± 0.8 | 1 | ||
Kinetic parameters (KM and Vmax) were obtained from initial slopes and corrected appropriately for substrate and product fluorescence as described in Supporting Information. The values reported are the mean ± s.e.m. of triplicate experiments as calculated from a direct fit of ν vs. [S] plots using the Briggs-Haldane equation.
Catalytic efficiency of each substrate was calculated as kcat/KM (min-1 μM-1). The values for BTF and RDF probes within each kinase subset were normalized to the number obtained with the BTF substrate.
The KM values of the parent substrates from which the respective chemosensors were derived are obtained from the indicated literature references.
Results originally reported in reference 42.
Results originally reported in reference 6.
NS: Not a Substrate.
NA: Not Applicable.
Results originally reported in reference 4.
Two of the three kinases for which there was no improvement in kinetic parameters, IRK and PKA, showed no preference for either of the designs (Table 3, entries 5-6 and 19-20). This result is not surprising since the consensus sequence for IRK is reported to be Y-Nle/M-X-M,39 which is present in its entirety in both designs, and the PKA sensor is based on Kemptide40 where the C-terminal Ala residues do not impart much additional specificity. Finally, despite a robust fluorescence increase of the peptidyl RDF sensor for ERK1/2,25,41 it was not possible to derive kinetic parameters as this kinase requires an entire protein docking domain in addition to the short Thr-Pro consensus sequence for substrate recognition.42
For substrates that have not been subjected to extensive specificity studies, comparison of the catalytic efficiencies of RDF and BTF sensors now allows easy identification of regions and/or residues that play a role in enzyme recognition. For example, we can make the generalization that the basic C-terminal end is clearly important for Akt1 and MK2 kinases as their RDF chemosensors are 23- and 10-times, respectively, more efficient than the BTF probes (compare entries 15 to 16 and 17 to 18). Similarly, the acidic N-terminal sequence provides up to 28- and 5-fold improvement in catalytic efficiency toward Src and Abl, respectively (compare entries 1 to 2 and 343 to 4), which is in agreement with reported studies.44 Lastly, while the 3-residue N-terminal extension of the RDF substrate for Pim2 only modestly increases efficiency (compare entries 13 and 14), the RDF design now allows screens for further improvement in selectivity of this probe.
Finally, a major practical advantage of the assays with RDF chemosensors is that they are straightforward to apply. Kinetic assays were performed in either the fluorometer or fluorescence plate reader (FPR) by simple mixing of appropriate reaction components. Although the fluorometer is a much more sensitive instrument than FPR, most of the kinetic parameters for the aforementioned kinases were determined using a 96-well plate in the FPR. This was only possible because of the robust fluorescence enhancement that the sensors demonstrate upon phosphorylation under a wide range of kinase reaction conditions (see Supporting Information). Moreover, the use of 96-well plates in the FPR indicates not only the versatility of RDF chemosensors in obtaining kinetic parameters, but also the ease with which they could be adapted to high-throughput screens in search of potent inhibitors.
Conclusion
We have developed a general method for synthesis of versatile yet specific kinase chemosensors. The RDF design can incorporate both N- and C-terminal kinase recognition elements of Ser/Thr- and Tyr-containing substrates. The resulting chemosensors exhibit high and robust fluorescence enhancements under a variety of conditions. The RDF probes have also been used in the 96-well plate format to obtain complete kinetic parameters, indicating that the assays can be easily tuned for use in high-throughput screening. More importantly, this approach allowed us to substantially improve substrate efficacy over the BTF-designed chemosensors and should be more easily amenable to screens for additional specificity determinants. For example, the RDF approach now makes viable the construction of protein-based sensors where the C-Sox reporter can be placed anywhere in the protein (e.g. via native chemical ligation or a selective modification of an appropriately placed Cys residue) in order to obtain probes that fully exploit protein-protein interactions in enzyme selection. The BTF reporters, on the other hand, can only be located at peptide (and protein) termini (due to the β-turn) and, thus, have a more restricted utility. Ongoing work is focused on modifying the Sox chromophore to increase the excitation and emission wavelengths. The RDF chemosensors, along with their assaying ease, may provide a way to tackle a very important problem of enzyme specificity as fluorescent probes start to make their way into the arena of monitoring kinase activities in vivo.
Supplementary Material
Experimental procedures for peptide and building block synthesis, characterization of peptides and synthetic intermediates, enzyme assays, fluorescence spectral comparison of all substrate and product peptide pairs, calculations for obtaining kinetic parameters from fluorescence data, and ν vs. [S] plots (PDF). This material is available free of charge via the Internet at http://pubs.acs.org.
Acknowledgments
This research was supported by the NIH Cell Migration Consortium (GM064346), the Invitrogen Corporation and the A. M. Escudero Foundation postdoctoral fellowship for J.A.G-V. We thank Dr. A. M. Reynolds, Dr. M. A. Sainlos, Dr. M. D. Shults and A. Larkin for helpful discussions and Dr. M. A. Sainlos for obtaining MALDI TOF MS. The Biophysical Instrumentation Facility for the Study of Complex Macromolecular Systems (NSF-0070319) and the Department of Chemistry Instrumentation Facility (NIH-1S10RR013886-01) are also gratefully acknowledged.
References
- 1.Adams JA. Chem Rev. 2001;101:2271–2290. doi: 10.1021/cr000230w. [DOI] [PubMed] [Google Scholar]
- 2.Manning G, Whyte DB, Martinez R, Hunter T, Sudarsanam S. Science. 2002;298:1912–1934. doi: 10.1126/science.1075762. [DOI] [PubMed] [Google Scholar]
- 3.Hunter T. Cell. 2000;100:113–127. doi: 10.1016/s0092-8674(00)81688-8. [DOI] [PubMed] [Google Scholar]
- 4.Graves JD, Krebs EG. Pharmacol Ther. 1999;82:111–121. doi: 10.1016/s0163-7258(98)00056-4. [DOI] [PubMed] [Google Scholar]
- 5.Hunter T. Cell. 1995;80:225–236. doi: 10.1016/0092-8674(95)90405-0. [DOI] [PubMed] [Google Scholar]
- 6.Johnson LN, Lewis RJ. Chem Rev. 2001;101:2209–2242. doi: 10.1021/cr000225s. [DOI] [PubMed] [Google Scholar]
- 7.Blume-Jensen P, Hunter T. Nature. 2001;411:355–365. doi: 10.1038/35077225. [DOI] [PubMed] [Google Scholar]
- 8.Yarden Y, Sliwkowski MX. Nat Rev Mol Cell Biol. 2001;2:127–137. doi: 10.1038/35052073. [DOI] [PubMed] [Google Scholar]
- 9.Cohen P. Nat Rev Drug Discovery. 2002;1:309–315. doi: 10.1038/nrd773. [DOI] [PubMed] [Google Scholar]
- 10.Rothman DM, Shults MD, Imperiali B. Trends Cell Biol. 2005;15:502–510. doi: 10.1016/j.tcb.2005.07.003. [DOI] [PubMed] [Google Scholar]
- 11.Turk BE. Curr Opin Chem Biol. 2008;12:4–10. doi: 10.1016/j.cbpa.2008.01.018. [DOI] [PMC free article] [PubMed] [Google Scholar]
- 12.Shanna V, Wang Q, Lawrence DS. Biochim Biophys Acta, Proteins Proteomics. 2008;1784:94–99. doi: 10.1016/j.bbapap.2007.07.016. [DOI] [PMC free article] [PubMed] [Google Scholar]
- 13.Li Y, Xie W, Fang G. Anal Bioanal Chem. 2008;390:2049–2057. doi: 10.1007/s00216-008-1986-z. [DOI] [PubMed] [Google Scholar]
- 14.Lawrence DS, Wang Q. ChemBioChem. 2007;8:373–378. doi: 10.1002/cbic.200600473. [DOI] [PMC free article] [PubMed] [Google Scholar]
- 15.Lawrence DS. Biochim Biophys Acta. 2005;1754:50–57. doi: 10.1016/j.bbapap.2005.07.038. [DOI] [PubMed] [Google Scholar]
- 16.Shults MD, Carrico-Moniz D, Imperiali B. Anal Biochem. 2006;352:198–207. doi: 10.1016/j.ab.2006.03.003. [DOI] [PubMed] [Google Scholar]
- 17.Shults MD, Pearce DA, Imperiali B. J Am Chem Soc. 2003;125:10591–10597. doi: 10.1021/ja0355980. [DOI] [PubMed] [Google Scholar]
- 18.Shults MD, Imperiali B. J Am Chem Soc. 2003;125:14248–14249. doi: 10.1021/ja0380502. [DOI] [PubMed] [Google Scholar]
- 19.Shults MD, Janes KA, Lauffenburger DA, Imperiali B. Nat Methods. 2005;2:277–283. doi: 10.1038/nmeth747. [DOI] [PubMed] [Google Scholar]
- 20.Newton AC. Chem Rev. 2001;101:2353–2364. doi: 10.1021/cr0002801. [DOI] [PubMed] [Google Scholar]
- 21.Shabb JB. Chem Rev. 2001;101:2381–2411. doi: 10.1021/cr000236l. [DOI] [PubMed] [Google Scholar]
- 22.Taylor SS, Yang J, Wu J, Haste NM, Radzio-Andzelm E, Anand G. Biochim Biophys Acta. 2004;1697:259–269. doi: 10.1016/j.bbapap.2003.11.029. [DOI] [PubMed] [Google Scholar]
- 23.Brazil DP, Hemmings BA. Trends Biochem Sci. 2001;26:657–664. doi: 10.1016/s0968-0004(01)01958-2. [DOI] [PubMed] [Google Scholar]
- 24.Downward J. Semin Cell Dev Biol. 2004;15:177–182. doi: 10.1016/j.semcdb.2004.01.002. [DOI] [PubMed] [Google Scholar]
- 25.Roux PP, Blenis J. Microbiol Mol Biol Rev. 2004;68:320–344. doi: 10.1128/MMBR.68.2.320-344.2004. [DOI] [PMC free article] [PubMed] [Google Scholar]
- 26.Kotlyarov A, Yannoni Y, Fritz S, Laass K, Telliez JB, Pitman D, Lin LL, Gaestel M. Mol Cell Biol. 2002;22:4827–4835. doi: 10.1128/MCB.22.13.4827-4835.2002. [DOI] [PMC free article] [PubMed] [Google Scholar]
- 27.White E. Genes Dev. 2003;17:1813–1836. doi: 10.1101/gad.1123103. [DOI] [PubMed] [Google Scholar]
- 28.Songyang Z, Cantley LC. Trends Biochem Sci. 1995;20:470–475. doi: 10.1016/s0968-0004(00)89103-3. [DOI] [PubMed] [Google Scholar]
- 29.Martin GS. Nat Rev Mol Cell Biol. 2001;2:467–475. doi: 10.1038/35073094. [DOI] [PubMed] [Google Scholar]
- 30.Frame MC. Biochim Biophys Acta. 2002;1602:114–130. doi: 10.1016/s0304-419x(02)00040-9. [DOI] [PubMed] [Google Scholar]
- 31.Schlessinger J. Cell. 2000;100:293–296. doi: 10.1016/s0092-8674(00)80664-9. [DOI] [PubMed] [Google Scholar]
- 32.Porter AC, Vaillancourt RR. Oncogene. 1998;17:1343–1352. doi: 10.1038/sj.onc.1202171. [DOI] [PubMed] [Google Scholar]
- 33.Garcia P, Shoelson SE, George ST, Hinds DA, Goldberg AR, Miller WT. J Biol Chem. 1993;268:25146–25151. [PubMed] [Google Scholar]
- 34.Frank R. J Immunol Methods. 2002;267:13–26. doi: 10.1016/s0022-1759(02)00137-0. [DOI] [PubMed] [Google Scholar]
- 35.Zhang JH, Chung TD, Oldenburg KR. J Biomol Screen. 1999;4:67–73. doi: 10.1177/108705719900400206. [DOI] [PubMed] [Google Scholar]
- 36.Gribble FM, Loussouarn G, Tucker SJ, Zhao C, Nichols CG, Ashcroft FM. J Biol Chem. 2000;275:30046–30049. doi: 10.1074/jbc.M001010200. [DOI] [PubMed] [Google Scholar]
- 37.Haugland RP, Spence MTZ, Johnson ID, Basey A. The handbook: a guide to fluorescent probes and labeling technologies. 10th. Molecular Probes; Eugene, OR: 2005. [Google Scholar]
- 38.Nishikawa K, Toker A, Johannes FJ, Songyang Z, Cantley LC. J Biol Chem. 1997;272:952–960. doi: 10.1074/jbc.272.2.952. [DOI] [PubMed] [Google Scholar]
- 39.Shoelson SE, Chatterjee S, Chaudhuri M, White MF. Proc Natl Acad Sci USA. 1992;89:2027–2031. doi: 10.1073/pnas.89.6.2027. [DOI] [PMC free article] [PubMed] [Google Scholar]
- 40.Kemp BE, Graves DJ, Benjamini E, Krebs EG. J Biol Chem. 1977;252:4888–4894. [PubMed] [Google Scholar]
- 41.Kyriakis JM, Avruch J. Physiol Rev. 2001;81:807–869. doi: 10.1152/physrev.2001.81.2.807. [DOI] [PubMed] [Google Scholar]
- 42.Rainey MA, Callaway K, Barnes R, Wilson B, Dalby KN. J Am Chem Soc. 2005;127:10494–10495. doi: 10.1021/ja052915p. [DOI] [PMC free article] [PubMed] [Google Scholar]
- 43.Shults MD. PhD Thesis. Massachusetts Institute of Technology; 2005. [Google Scholar]
- 44.Songyang Z, Carraway KL, 3rd, Eck MJ, Harrison SC, Feldman RA, Mohammadi M, Schlessinger J, Hubbard SR, Smith DP, Eng C. Nature. 1995;373:536–539. doi: 10.1038/373536a0. [DOI] [PubMed] [Google Scholar]
- 45.Hutti JE, Jarrell ET, Chang JD, Abbott DW, Storz P, Toker A, Cantley LC, Turk BE. Nat Methods. 2004;1:27–29. doi: 10.1038/nmeth708. [DOI] [PubMed] [Google Scholar]
- 46.Obata T, Yaffe MB, Leparc GG, Piro ET, Maegawa H, Kashiwagi A, Kikkawa R, Cantley LC. J Biol Chem. 2000;275:36108–36115. doi: 10.1074/jbc.M005497200. [DOI] [PubMed] [Google Scholar]
- 47.Manke IA, Nguyen A, Lim D, Stewart MQ, Elia AE, Yaffe MB. Mol Cell. 2005;17:37–48. doi: 10.1016/j.molcel.2004.11.021. [DOI] [PubMed] [Google Scholar]
Associated Data
This section collects any data citations, data availability statements, or supplementary materials included in this article.
Supplementary Materials
Experimental procedures for peptide and building block synthesis, characterization of peptides and synthetic intermediates, enzyme assays, fluorescence spectral comparison of all substrate and product peptide pairs, calculations for obtaining kinetic parameters from fluorescence data, and ν vs. [S] plots (PDF). This material is available free of charge via the Internet at http://pubs.acs.org.