Abstract
We compare the folding of representative members of a protein superfamily by experiment and simulation to investigate common features in folding mechanisms. The homeodomain superfamily of three-helical, single-domain proteins exhibits a spectrum of folding processes that spans the complete transition from concurrent secondary and tertiary structure formation (nucleation-condensation mechanism) to sequential secondary and tertiary formation (framework mechanism). The unifying factor in their mechanisms is that the transition state for (un)folding is expanded and very native-like, with the proportion and degree of formation of secondary and tertiary interactions varying. There is a transition, or slide, from the framework to nucleation-condensation mechanism with decreasing stability of the secondary structure. Thus, framework and nucleation-condensation are different manifestations of an underlying common mechanism.
Keywords: two-state, three-state, framework, nucleation, homeodomain
AHoly Grail of protein folding is to find a single mechanism. Given the diversity of protein structure and the evolutionary pressure on function and not on folding rates, a unique mechanism for folding would seem unlikely. If there are simplifying features, then small, single-domain proteins may be the most likely to exhibit them. But such proteins seem to fold by two distinct mechanisms. The λ6-85 repressor fragment (1) and the engrailed homeodomain (En-HD; ref. 2) seem to fold by a classical diffusion-collision mechanism (3-5) whereby secondary structural elements form independently and then dock to form the tertiary structure. Chymotrypsin inhibitor 2, on the other hand, folds by nucleation-condensation, which is characterized by concerted consolidation of secondary and tertiary interactions as the whole domain collapses around an extended nucleus (6). It has been argued on general grounds that nucleation-condensation and diffusion-collision are different manifestations of a common mechanism in which secondary structure and tertiary structure form in parallel (7, 8). Nucleation-condensation reflects the situation when secondary structure is inherently unstable in the absence of tertiary interactions whereas diffusion-collision becomes more probable with increasing stability of secondary structure.
Studies of the folding of point mutants of a prototype protein are essential for discovering atomic level details of folding mechanisms and kinetics. Single-point mutants may even cause gross changes in the kinetics of folding, such as the transition from three-state to two-state folding (9). But, to extrapolate a general understanding of folding mechanisms, studies on members of the same fold family (different homologues sharing the same overall topology but with different primary structures) can be useful in finding correlations between amino acid sequences and three-dimensional structures (10-16). Although there can be different folding routes through different transition states for some proteins (17), it seems that mechanisms of folding are often conserved in a protein family although there may be variations in the population of intermediates (11, 13, 16). Here, we extend our earlier studies of the En-HD and characterize and compare the kinetics and folding pathways of three members of the homeodomain-like protein family that share the same overall topology: human TRF1 Myb domain (hTRF1), human RAP1 Myb domain (hRAP1), and c-Myb-transforming protein (c-Myb).
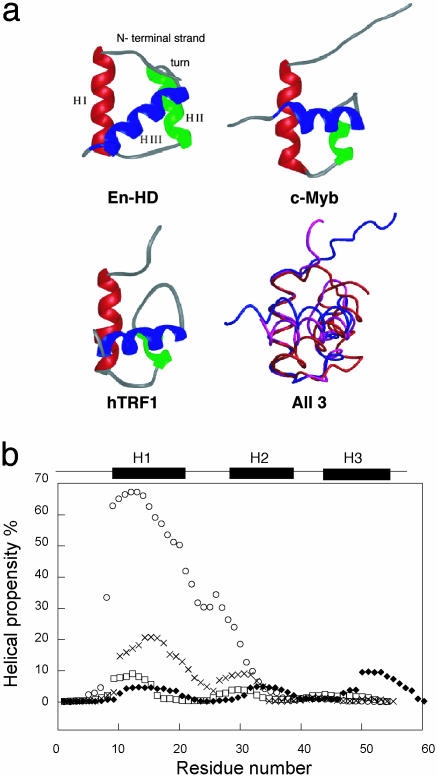
The three-dimensional structures of those sequence-specific, DNA-binding proteins consist of three-helix bundle structures with a characteristic helix-turn-helix motif (helices II and III, Fig. 1). Their backbone architecture is highly conserved. Minor differences are: (i) the loop that connects helix I and helix II in hRAP1, which is slightly longer and less ordered than in the other domains (11 residues vs. 4 residues for En-HD); and (ii) the fine structural organization of the turn in the helix-turn-helix motif, which is generally longer (up to 8 residues for hTRF1) than the prototypic 4-residue length in En-HD. Further, the structural superposition of c-Myb, En-HD, and hTRF1 shows fine differences in the architecture of their three helical bundles that stem mainly from a different angle between helices I and III (Fig. 1a). Importantly, the program AGADIR predicts that the first and second α-helices of En-HD should have much higher propensity for formation than in c-Myb, hTRF1, and hRAP1 (Fig. 1b). Similarly, the algorithm of Dodd and Eagan (18) predicted En-HD to have a high tendency for formation of its helix-turn-helix motif, compared with a very low probability for the other members of the homeodomain-like family studied here (data not shown).
Fig. 1.
(a) Individual and superposed structures of hTRF1, c-Myb, and En-HD, with alignment of each structure about helix I. (b) Ab initio secondary structure prediction for En-HD (○), c-Myb (×), hRAP1 (♦), and hTRF1 (□). The three helices of each protein (En-HD, residues 10-22, 28-38, and 43-55; c-Myb, residues 149-162, 166-172, and 178-189; and hTRF1, residues 8-19, 26-32, and 41-51) are marked above the graph. The helical propensities were calculated by using the agadir program (32) (www.embl-heidelberg.de/cgi/agadirwrapper.pl).
Materials and Methods
Proteins. The synthetic genes coding for hRAP1, hTRF1, and c-Myb were synthesized, and their gene products were expressed and purified to homogeneity by standard procedures (2).
Equilibrium and Kinetic Measurements. All experiments were carried out in the presence of 100 mM NaCl and 50 mM sodium acetate buffer (pH 5.7) at 25 ± 0.1°C. Equilibrium denaturation with urea was followed by fluorescence using an appropriate cut-off filter (>320 nm for c-Myb, En-HD, and hRAP1 and >360 nm for hTRF1, excitation at 280 nm) and by circular dichroism at 222 nm. Stopped-flow experiments were carried out on an Applied Photophysics (Letherhead, U.K.) SX-18MV instrument. Folding and unfolding were initiated by an 11-fold dilution of the denatured or the native protein in the appropriate urea solution. Temperature-jump measurements were made by using a DIA-RT capacitor-discharge T-jump apparatus (Dia-Log, Düsseldorf, Germany) and 10- to 70-μM protein concentration; 25-kV discharges were used to effect 2°C jumps, by using a 20-nF capacitor, to a final temperature of 25 ± 0.1°C, with complete heating within 5 μs under optimal conditions. Continuous-flow measurements were carried out as described (19). For hRAP1 and c-Myb, which each contain a Pro residue, there was a slow urea-independent phase with rate constants of ≈1 × 10⁻²·sec-1 for hRAP1 and 7 × 10⁻³·sec-1 for c-Myb of 5% of the total folding amplitudes, which presumably arose from a cis-trans isomerization in the denatured state. We did not analyze this phase further.
Molecular Dynamics (MD) Simulations. We extended one of the previously described simulations of the unfolding of En-HD at 498 K (2, 20) from 40 to 65 ns for better sampling of the denatured state. All calculations were performed by using the program ENCAD (21-23). Seven independent simulations of c-Myb were performed at 498 K: one proceeded for 60 ns and six were 2 ns in duration. The initial structure for the 60-ns simulation of c-Myb and four of the 2-ns simulations was the average NMR structure [PDB code 1IDY (24)]. Structure 1 of the NMR ensemble was used for the other 2-ns simulations. The c-Myb domain of this study contains an additional Met at the N terminus, which was built onto the NMR structure. His residues (H159 and H184) were protonated, and Glu and Asp were negatively charged, reflecting a pH of ≈4-7.
The starting structure for the 60-ns c-Myb simulation was minimized for 1,000 steps. After minimization, water molecules were added to solvate the protein in a rectangular box extending at least 8 Å in all directions, resulting in 3,461 water molecules. The water density was set to the experimental value [0.829 g/ml at 225°C (25)] by adjusting the volume of the box. The solvent water was then subjected to the conjugate gradient minimization of 1,000 cycles followed by 1,000 steps of molecular dynamics. The water was then minimized again for 1,000 cycles. Finally, the protein was minimized for 1,000 steps, followed by 1,000 steps of minimization of the entire protein-water system. After these preparatory steps, the system was heated to 225°C, and the simulation was allowed to evolve over time by using a 2-fs integration time step. Atoms were allowed to move according to Newton's equations of motion, and the velocities of the atoms were adjusted intermittently until the system reached the desired temperature, after which the NVE ensemble (microcanonical ensemble in which the number of particles, volume, and energy are constant) was used. In all calculations, an 8-Å, force-shifted, nonbonded interaction cut-off was used. The nonbonded list was updated every two cycles. The short simulations for c-Myb were performed similarly except that the number of steps in the preparatory dynamics and minimization routines was varied between 990 and 1,100 to produce independent trajectories. The random number see for MD was also varied. The number of water molecules ranged from 3,461 to 3,486. The same protocols were used in two simulations of S16A hTRF1 at 498 K, beginning with the NMR averaged structure (26). These simulations were each 60 ns in duration. The number of water molecules was 2,666.
Results and Discussion
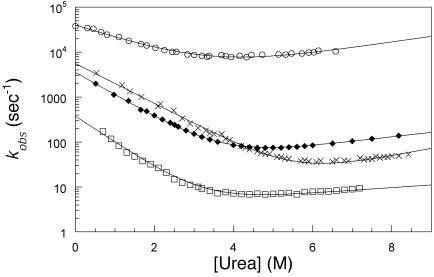
Transition from Two- to Three-State Kinetics. There is a progression from three-state to two state kinetics across the family. Apart from the proline phase, the folding of hTRF1, hRAP1, and c-Myb fitted a single exponential process under all conditions, unlike the multiphasic kinetics of En-HD (2). The folding/unfolding rate constants for hTRF1, hRAP1, and c-Myb fitted the canonical chevron plots with urea concentration (Fig. 2), characteristic of a two-state process (27). Apart from En-HD, all of the values of  and mD-N calculated from kinetics were in good agreement with those calculated from equilibrium experiments (data not shown), consistent with a two-state model (27). Further, the kinetic mD-N value of 0.59 (±0.03) kcal·mol-1·M-1 for En-HD is significantly lower than that measured at equilibrium, 0.80 (±0.05) kcal·mol-1·M-1, consistent with a compact folding intermediate accumulating on the pathway (2).
Fig. 2.
Chevron plots of wild-type En-HD (○), c-Myb (×), hRAP1 (♦), and hTRF1 (□) measured in 50 mM sodium acetate buffer and 100 mM NaCl at 25°C. The lines are the best fit for a kinetic two-state model (27).
The refolding rate constant of each protein (Table 1) had a similar strong dependence on denaturant concentration whereas the unfolding rate changed only slightly (see m values in Table 1). The compactness of the transition state, relative to the native state, can be estimated by the β Tanford (βT) value [βT = mF/(mU + mF)], which is one measure of the position of the transition state on the reaction coordinates (28). The βT values of 0.90 for hTRF1, 0.82 for hRAP1, and 0.79 (±0.02) for c-Myb (Table 1) indicated that they had a compact native-like transition state.
Table 1. Kinetic folding parameters for the homeodomain-like proteins.
| kF, s—1 | kU, s—1 | mF, kcal·mol—1·M—1 | mU, kcal·mol—1·M—1 | mD-N, kcal·mol—1·M—1 | ΔGD-N, kcal·mol—1 | βT | |
|---|---|---|---|---|---|---|---|
| hTRF1 | 370±20 | 3.20±0.30 | 0.86±0.02 | 0.09±0.01 | 0.95±0.02 | 2.82±0.05 | 0.90±0.02 |
| c-Myb | 6,200±200 | 5.30±0.60 | 0.65±0.01 | 0.17±0.01 | 0.82±0.01 | 4.17±0.07 | 0.79±0.02 |
| hRAP1 | 3,600±100 | 18.0±2.0 | 0.68±0.01 | 0.15±0.01 | 0.83±0.01 | 3.12±0.06 | 0.82±0.02 |
| En-HD | 39,900±700 | 2,100±500 | 0.49±0.02 | 0.10±0.02 | 0.59±0.03 | 1.7±0.2 | 0.83±0.06 |
Calculated according to a two-state model (27); SE are given. kF and kU are the rate constants for folding and unfolding, respectively. m is the slope of (log k)/RT vs. urea concentration.
There was no correlation between stability and folding rate, in contrast to the folding of Src homology 3 (29) and immunoglobin-like domains (12). The variation in helical and turn propensities for En-HD and its homologs may reconcile the different kinetic mechanisms for folding (7, 8, 30, 31). Calculations of the helical stabilities by AGADIR (ref. 32 and Fig. 1) suggest that the regions spanning helices I and II of En-HD have a high and continuous helical propensity whereas all of the other proteins have a much lower helical propensity, with c-Myb being second at 20% for helix I. Thus, the strong inherent propensity to form native secondary structure in the absence of tertiary interactions seemed to dominate the folding kinetics of En-HD. Conversely, the proteins of inherently weaker secondary structure folded in a two-state manner.
Φ-Value Analysis of En-HD and c-Myb. We investigated by Φ-value analysis (33) the folding transition states of c-Myb, the most stable protein in this study, and a stabilized pseudo-wild-type mutant of En-HD, K52A, which is more tolerant to mutations (Table 2). For a two-state system, ΦF = 1 - ΦU, where F = folding and U = unfolding. Generally, the equation ΦF = 0 implies that the residue in question in the transition state is structurally similar to the denatured state; and the equation ΦF = 1 implies full extent of native interactions in the transition state (34). Owing to the complexities in analyzing the multistate kinetics of folding of En-HD, we concentrated only on its rate-determining transition state for unfolding, that is, its final transition state for folding.
Table 2.
Φ and S values for the transition states of En-HD and c-Myb*
| Mutant | Location | Interaction probed | ΦF† | S value‡ |
|---|---|---|---|---|
| En-HD | ||||
| F8A | N-term. | 3°: packing throughout core | 0.42 | 0.35 |
| L13A | HI | 3°: core packing around the N-term. strand | 0.51 | 0.63 |
| A14G | HI | 2° | 0.79 | 0.85 |
| L16V | HI | 3°: packing throughout the core | 0.39 | 0.56 |
| F20A | HI | 3°: packing throughout the core | 0.36 | 0.20 |
| Y25G | Loop | 2° and 3° | 0.28 | 0.08 |
| A25G | Loop | 2° and 3° | 0.17 | 0.08 |
| L26A | Loop | 2° and 3° packing around loop | 0.46 | 0.31 |
| L38A | HII | 3°: core packing around turn | 0.48 | 0.62 |
| L38V | HII | 3°: core packing around turn | 0.83 | 0.62 |
| G39A | Turn | 2° and 3° | 0.92 | 0.79 |
| L40A | Turn | 2° and 3°: core packing around turn | 0.95 | 0.58 |
| A43G | HIII | 2° | 1.05 | 0.73 |
| I45V | HIII | 2° and 3°: core packing around turn | 0.69 | 0.62 |
| A54G | HIII | 2° | 0.62 | 0.59 |
| c-Myb | ||||
| W147F | N-term. | 3°: core packing and H-bond between N-term. strand and HIII | 0.11 | 0.21 |
| E151Q | HI | 3°: region around turn | 0.16 | 0.81 |
| D152N | HI | 3°: interactions between HI and HIII | 0.18 | 0.87 |
| I154V | HI | 2° and 3°: interaction between HI and HII/turn | 0.84 | 0.82 |
| LI55A | HI | 3°: packing of core | 0.34 | 0.63 |
| A158G | HI | 2° | 0.66 | 0.67 |
| G163A | Loop | 2° and 3° | 0.46 | 0.47 |
| A167G | HII | 2° | 0.92 | 0.66 |
| I169V | HII | 3°: core packing between HI HII in loop | 0.34 | 0.25 |
| A170G | HII | 2° and 3°: interaction between HII and HIII/turn | 0.48 | 0.32 |
| L173V | Turn | 3°: interactions between HI and HIII | 0.34 | 0.39 |
| P174G | Turn | 2° and 3°: packing around turn | 0.08 | 0.15 |
| G175A | Turn | 2° and 3°: packing around turn | 0.32 | 0.58 |
| R176K | Turn | 3°: region between turn and the N-term./HI | 0.31 | 0.46 |
| A180G | HIII | 2° and 3°: between HIII and N-term. strand | 0.55 | 0.75 |
| I181A | HIII | 3°: packing around turn. | 0.64 | 0.52 |
| W185F | HIII | 3°: core packing and H-bond between HI and HIII | —0.04 | 0.44 |
| M189A | C-term. | 3°: packing between HI and HIII | 0.01 | 0.27 |
S value is the simulated equivalent of Φ. HI, helix I; HII, helix II; HIII, helix III; 2°, secondary probe; 3°, tertiary probe; term., terminal
Because En-HD folds from its open denatured state, U, via a compact highly helical intermediate, I, ΦF values were calculated for the transition state that leads to the formation of the fully native state, using the relationship ΦF = 1 — ΦU. c-Myb folds by simple kinetics, with a single transition state. ΦF was found to be insensitive to the concentration of urea, and each value has a SE of ± 0.04—0.06
Average S values were calculated for the trajectories and time periods described in the legend to Fig. 5. For the residues in turns and loops, the S3° values are given because the main chain became distorted but side chain interactions were frequently maintained. In such cases, the product of S2° and S3° failed to capture this retention of structure. In particular, this was the case with residues 8, 26, and 40 of En-HD and residues 163, 173, 175, and 176 of c-Myb
We made two classes of mutation, either perturbing primarily secondary structure or primarily tertiary structure (Table 2). Identical Φ values were calculated from the folding and unfolding rate constants for c-Myb, confirming that the folding and unfolding kinetics of all of the mutants of c-Myb obey the classical behavior for a two-state system. Similarly, the observed mD-N values were all similar to the value obtained for wild-type c-Myb. Moreover, the values of βT were all very similar (Table 1).
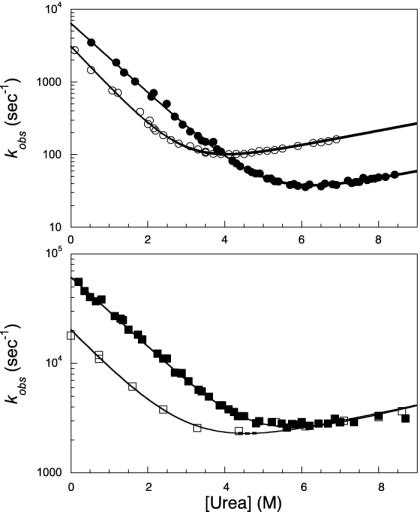
The Φ values for En-HD and c-Myb were quite similar (Table 2), but there was one significant difference in the pattern of ΦF between the two proteins (Table 2): the region around the turn in helix II-turn-helix III in En-HD had ΦF values that were close to 1 whereas the values for c-Myb were close to zero (Table 2 and Fig. 3). The ΦF values parallel the prediction of a high probability for the helix-turn-helix in En-HD but not c-Myb. The folding transition state of c-Myb had an extended, loosely packed hydrophobic nucleus located at the interface between the three helices. The folding nucleus of En-HD is similar but seems to be more structured, by virtue of a cluster of native-like interactions throughout the turn.
Fig. 3.
(Upper) Chevron plot of wild-type c-Myb (•) compared with a representative secondary probe in the turn region, namely G175A mutant (○). Fits follow a simple two-state model. (Lower) Chevron plots of the pseudo-wild type of the En-HD (▪) compared with a representative secondary probe mutant in the turn, namely G39A (□). Fits are the result of a three-state model. Quantitative comparison of these homologous positions in the two proteins suggests that the turn of En-HD is fully structured in the folding transition state whereas that of c-Myb is mainly unstructured.
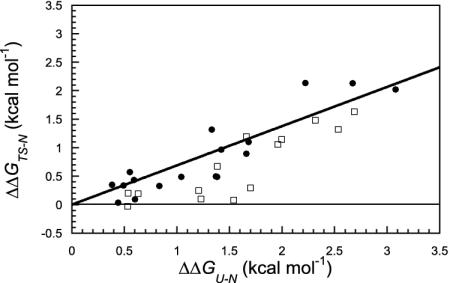
It is difficult to distinguish between nucleation-condensation and diffusion—collision solely on the basis of a limited number of ΦF values. Both mechanisms are consistent with an extended nucleus in the transition state, but diffusion-collision should have a significant number of ΦF values that probe secondary stucture close to 1 (35). There is considerable ancillary evidence for diffusion-collision for En-HD: the presence of a folding intermediate with much native secondary structure and the sequence of events observed in the MD simulations (described below), as well as several ΦF values in the secondary structure close to 1 (ref. 2 and Table 2). Conversely, chymotrypsin inhibitor 2 folds from an unstructured denatured state, with a very clear pattern of fractional ΦF values from a very large number of mutants for which a double logarithmic plot of the unfolding rate constant vs. equilibrium constant follows a linear Brønsted plot of slope 0.64 (6, 36). The Brønsted plot for c-Myb is very similar, with a slope of 0.69 (Fig. 4), which represents the average degree of formation of interaction energies within the whole protein. The fractional slope and reasonable fit to a single line for nearly all mutants implies that secondary structure and tertiary structure are being formed in parallel, according to the nucleation-condensation mechanism (37). In contrast, nearly all of the positions probing secondary structure in the Brønsted plot for En-HD fall on a line with a slope of 0, as one would expect for helices that are fully formed before docking in the transition state (Fig. 4). In contrast, the majority of the positions probing tertiary structure are similar to c-Myb, as expected for docking of side chains in the rate-determining step. Further evidence comes from MD simulation.
Fig. 4.
Brønsted plot for c-Myb (•) and En-HD (□). The line is the best linear fit to the Brønsted plot for the c-Myb mutants (r = 0.90). We noted that, for En-HD, the mutants along the line with slope 0 are involved in the stabilization of H1 (A14G) and the HII-turn-HIII motif, indicating that these secondary elements are fully formed before the docking of the transition state (see text).
MD Simulations of En-HD, c-Myb, and hTRF1. We performed MD simulations of the thermal denaturation of En-HD, c-Myb, and hTRF1 to obtain atomic resolution information for unfolding pathways and associated transition, intermediate, and denatured states. Multiple independent simulations of each protein were performed at different temperatures. We have already shown that the unfolding times in simulations at 75 and 100°C are in good agreement with experiment (2). Also, we have shown that the overall unfolding process for this (2, 20) and other proteins (38) is essentially independent of temperature and that increasing the temperature merely accelerates the process. So, we focus on very high temperature simulations (498 K, or 225°C, and elevated pressure, ≈26 atm, to maintain water in the liquid state) because of their improved sampling of the denatured state although some results for lower experimental temperatures are also presented to show the generality and applicability of the findings.
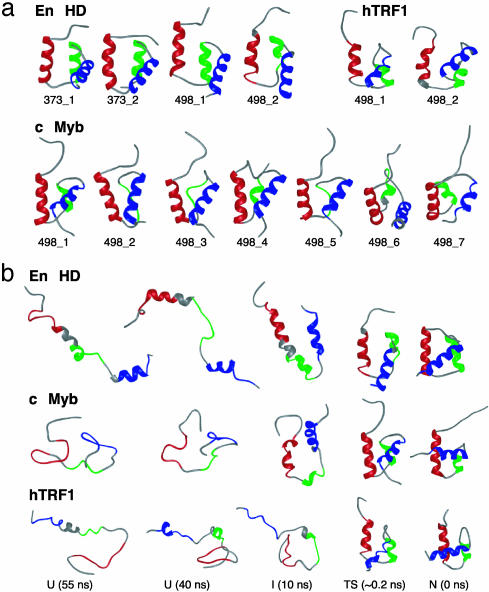
Putative transition state ensembles were identified for the various simulations by using a conformational clustering procedure (39, 40). Representative structures from these ensembles for the independent trajectories (two each at 373 and 498 K for En-HD; seven at 498 K for c-Myb; and two at 498 K for hTRF1) are presented in Fig. 5a. Although the structures are native-like, the average solvent-accessible surface area increased by ≈17% for En-HD and c-Myb, or βT = 0.83, and ≈20% for hTRF1, or βT = 0.80. This degree of exposure is consistent with the βT value determined experimentally: 0.83, 0.79, and 0.90 for En-HD, c-Myb, and hTRF1, respectively.
Fig. 5.
(a) Representative transition-state (TS) structures for independent unfolding simulations of En-HD, c-Myb, and hTRF1 at different temperatures. The TS ensembles correspond to the following time intervals: En-HD, 373_1, 1.715-1.72 ns; 373_2, 1.98-1.985 ns; 498_1, 0.165-0.17 ns; and 498_2, 0.255-0.26 ns; c-Myb, 498_1, 0.1-0.105 ns; 498_2, 0.275-0.28 ns; 498_3, 0.315-0.32 ns; 498_4, 0.225-0.23 ns; 498_5, 0.50-0.505 ns; 498_6, 0.55-0.555 ns; and 498_7, 0.145-0.150 ns; and hTRF1, 498_1, 0.14-0.145 ns; and 498_2, 0.125-0.13 ns. The structure corresponding to the final time point for each TS ensemble is presented. (b) Structures from 498-K simulations of En-HD (498_2), c-Myb (498_1), and hTRF1 (498_1).
We calculated S values, the semiquantitative MD equivalents of Φ values (41). The S and Φ values are in reasonable agreement (Table 2), with correlation coefficients of 0.79 and 0.74 for En-HD and c-Myb (excluding the E151Q and D152N mutants), respectively. ΦF is a good measure for fractional bond formation when determined for mutations of larger to smaller hydrophobic side chains but not necessarily so for mutation of charged or polar residues (33, 34). We found the best agreement for the hydrophobic mutations (the correlation coefficient given for c-Myb decreases by 0.28 if the E151 and D152 mutations are considered). The transition state structures were effectively insensitive to changes in temperature and sequence, considering the global fold of the protein (Fig. 5a). On closer inspection, however, it can be seen that the transition state for En-HD is more structured than that of c-Myb. In particular, helix II is highly variable in c-Myb, it experiences more fraying at the ends of helices I and III, and the loop between helices II and III is distorted. Thus, the transition state of En-HD contains a high degree of secondary structure and consolidation of the packing interactions and the final expulsion of water occurs in the transition state and during the progression to the native state. In contrast, both secondary and tertiary interactions are in the process of being formed in the transition states of c-Myb and hTRF1.
Importantly, we also detected an intermediate in the unfolding pathway of c-Myb that was not apparent in the experiments. c-Myb and En-HD both populate intermediates with considerable helical structure in the MD simulations (Fig. 5b). This finding is consistent with experiment on En-HD, which folds via a highly helical intermediate, whereas c-Myb folds in an apparent two-state manner. However, the population of the c-Myb intermediate increases in single-site mutants that specifically increase the helical and turn propensities such that the intermediate becomes experimentally visible (unpublished data). The unfolded states of these two proteins are quite different. The unfolded state of En-HD contains residual, dynamic helical structure whereas that of c-Myb seems to be a compact random coil (Fig. 5b). Finally, we did not detect intermediates during the unfolding of hTRF1, and its denatured state is quite disordered, like that of c-Myb (Fig. 5b). These findings are consistent with the lower helical propensities of hTRF1 compared with c-Myb and En-HD.
Unifying Features in Folding Mechanisms. The transition state of En-HD, as reflected in both the Φ value analysis and the simulated transition state ensembles, and the actual simulated unfolding pathway show what is expected for a diffusion-collision mechanism (4), with nearly fully formed elements of secondary structure coalescing via their hydrophobic side chains in the transition state (2, 7). The transition state structures of c-Myb and hTRF1 are similar except that the helices are not fully formed, particularly helix II, and instead are in the process of being consolidated as would be expected for the nucleation-condensation mechanism. But, it must be noted that movements from diffusion-collision to nucleation-condensation are not detected simply by the helical content of the folding transition states but by the careful analysis of whether the secondary and tertiary structures are formed simultaneously or not (Figs. 5b and 6). This point can be addressed only by careful characterization of denatured and intermediate states, as discussed by Mayor et al. (2) for En-HD, such as investigation of the formation of secondary structure elements in the denatured state (5), Φ values, and Brønsted plot analysis that specifically monitors the differences in free energy between the ground states and the transition state between them, as well as direct MD simulation.
Fig. 6.
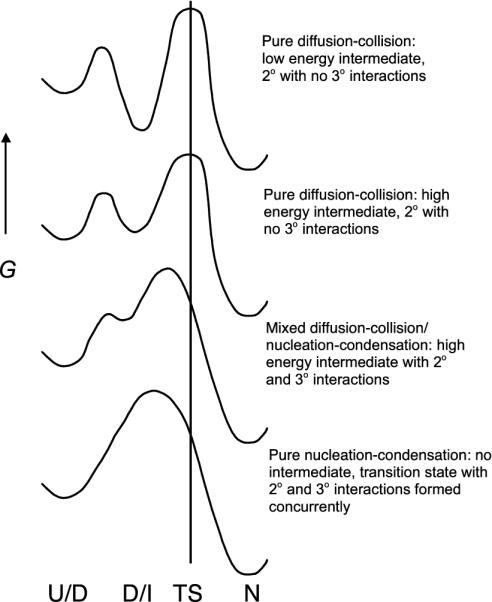
Simplified energy diagrams for folding of small single-domain proteins. Pure nucleation-condensation implies that secondary and tertiary structures are formed simultaneously in the absence of intermediates, as observed for hTRF1. As the propensity for forming secondary structure increases, the mechanism slides from the nucleation-condensation to the pure diffusion-collision model, as observed for En-HD.
The nucleation-condensation model postulates the existence of a folding nucleus whose formation stabilizes the transition state. However, formation of a small folding nucleus is probably not solely rate determining because a significant fraction of the overall structure must be in approximately the correct conformation for the discontinuous network of residues in the nucleus to come together. An important corollary of this observation is that formation of the nucleus (nucleation) is coupled with a more general formation of structure (condensation), giving rise to a roughly linear Brønsted profile as observed for c-Myb.
The Src homology 3 domain (42) and WW domains (43, 44) seem to fold via an alternative folding mechanism that implies the presence of a structurally polarized transition state, perhaps caused by loop or hairpin nucleation events that seem to initiate the folding of these all β-sheet proteins (45). Polarized transition states represent a hybrid between nucleation-condensation and diffusion-collision. The structure of the transition state, which resembles an expanded version of the native state, with fractional and low Φ values throughout the hydrophobic core, is consolidated by a discrete and localized cluster of preformed secondary elements, with high Φ values, giving rise to a structurally polarized transition state.
hTRF1 and En-HD represent two extreme variations of the folding process for this particular topology. As the propensity for forming secondary structure increases, the mechanism slides from nucleation-condensation to the diffusion-collision/framework model (Fig. 6). Based on our results, En-HD seems to fold via the framework model whereas c-Myb seems to fold via a mixed framework/nucleation-condensation model with a high energy intermediate, and hTRF1 seems to fold via a pure nucleation-condensation process. The common feature in the un(folding) of these proteins is a transition state that is very native-like, with a mixture of tertiary and secondary interactions. But the balance of tertiary and secondary interactions and the route of reaching the transition state depend crucially on the inherent propensities for secondary and tertiary structure.
Acknowledgments
We thank Dr. Christopher M. Johnson for skillful technical assistance. S.G. is supported by a fellowship from the Istituto Pasteur-Fondazione Cenci Bolognetti (Rome), N.R.G. is supported by a Winston Churchill Scholarship, and U.M. is supported by an ”Ikertzaileen prestakuntza” grant from the Government of the Basque Country. V.D. is grateful for support of the computational work provided by Grant GM 50789 from the National Institutes of Health (NIH). This work is supported by an NIH Pharmacological Sciences Training Grant 5 TG32 GM07750 (to M.L.D.).
Abbreviations: En-HD, engrailed homeodomain; c-Myb, c-Myb-transforming protein; hTRF1, human TRF1 Myb domain; βT, β Tanford value; hRAP1, human RAP1 Myb domain; MD, molecular dynamics.
References
- 1.Myers, J. K. & Oas, T. G. (1999) Biochemistry 38, 6761-6768. [DOI] [PubMed] [Google Scholar]
- 2.Mayor, U., Guydosh N. R., Johnson C. M., Grossmann J. G., Sato S., Jas G. S., Freund S. M., Alonso D. O., Daggett V. & Fersht, A. R. (2003) Nature 421, 863-867. [DOI] [PubMed] [Google Scholar]
- 3.Islam, S. A., Karplus, M. & Weaver, D. L. (2002) J. Mol. Biol. 318, 199-215. [DOI] [PubMed] [Google Scholar]
- 4.Karplus, M. & Weaver, D. L. (1994) Protein Sci. 3, 650-668. [DOI] [PMC free article] [PubMed] [Google Scholar]
- 5.Kim, P. & Baldwin, R. L. (1990) Annu. Rev. Biochem. 59, 631-660. [DOI] [PubMed] [Google Scholar]
- 6.Itzhaki, L. S., Otzen, D. E. & Fersht, A. R. (1995) J. Mol. Biol. 254, 260-288. [DOI] [PubMed] [Google Scholar]
- 7.Daggett, V. & Fersht, A. R. (2003) Trends Biochem. Sci. 28, 18-25. [DOI] [PubMed] [Google Scholar]
- 8.Fersht, A. R. (1999) Structure and Mechanism in Protein Science (Freeman, New York).
- 9.Matouschek, A., Kellis, J. T., Jr., Serrano, L., Bycroft, M. & Fersht, A. R. (1990) Nature 346, 440-445. [DOI] [PubMed] [Google Scholar]
- 10.Chiti, F., Taddei, N., White, P. M., Bucciantini, M., Magherini, F., Stefani, M. & Dobson, C. M. (1999) Nat. Struct. Biol. 6, 1005-1009. [DOI] [PubMed] [Google Scholar]
- 11.Ferguson, N., Capaldi, A. P., James, R., Kleanthous, C. & Radford, S. E. (1999) J. Mol. Biol. 286, 1597-1608. [DOI] [PubMed] [Google Scholar]
- 12.Fowler, S. B. & Clarke, J. (2001) Structure. 9, 355-366. [DOI] [PubMed] [Google Scholar]
- 13.Gianni, S., Travaglini-Allocatelli, C., Cutruzzola, F., Bigotti, M. G. & Brunori, M. (2001) J. Mol. Biol. 309, 1177-1187. [DOI] [PubMed] [Google Scholar]
- 14.Martinez, J. C. & Serrano, L. (1999) Nat. Struct. Biol. 6, 1010-1016. [DOI] [PubMed] [Google Scholar]
- 15.Riddle, D. S., Grantcharova, V. P., Santiago, J. V., Alm, E., Ruczinski, I. & Baker, D. (1999) Nat. Struct. Biol. 6, 1016-1024. [DOI] [PubMed] [Google Scholar]
- 16.Staniforth, R. A., Giannini, S., Bigotti, M. G., Cutruzzolà, F., Travaglini-Allocatelli, C. & Brunori, M. (2000) J. Mol. Biol. 297, 1231-1244. [DOI] [PubMed] [Google Scholar]
- 17.Ternstrom, T., Mayor, U., Akke, M. & Oliveberg, M. (1999) Proc. Natl. Acad. Sci. USA 96, 14854-14859. [DOI] [PMC free article] [PubMed] [Google Scholar]
- 18.Dodd, I. B. & Egan, J. B. (1990) Nucleic Acids Res. 18, 5019-5026. [DOI] [PMC free article] [PubMed] [Google Scholar]
- 19.Ferguson, N., Johnson, C. M., Macias, M., Oschkinat, H. & Fersht, A. R. (2001) Proc. Natl. Acad. Sci. USA 98, 13002-13007. [DOI] [PMC free article] [PubMed] [Google Scholar]
- 20.Mayor, U., Johnson, C. M., Daggett, V. & Fersht, A. R. (2000) Proc. Natl. Acad. Sci. USA 97, 13518-13522. [DOI] [PMC free article] [PubMed] [Google Scholar]
- 21.Levitt, M. (1990) encad, Computer Program for Energy Calculations and Dynamics (Molecular Applications Group, Palo Alto, CA).
- 22.Levitt, M., Hirshberg, M., Sharon, R. & Daggett, V. (1995) Comput. Phys. Commun. 91, 215-221. [Google Scholar]
- 23.Levitt, M., Hirshberg, M., Sharon, R., Laidig, K. E. & Daggett, V. (1997) J. Phys. Chem. B 101, 5051-5061. [Google Scholar]
- 24.Furukawa, K., Oda, M. & Nakamura, H. (1996) Proc. Natl. Acad. Sci. USA 93, 13583-13588. [DOI] [PMC free article] [PubMed] [Google Scholar]
- 25.Kell, G. S. (1967) J. Chem. Eng. 12, 66-68. [Google Scholar]
- 26.Nishikawa, T., Nagadoi, A., Yoshimura, S., Aimoto, S. & Nishimura, Y. (1998) Structure (London) 6, 1057-1065. [DOI] [PubMed] [Google Scholar]
- 27.Jackson, S. E. & Fersht, A. R. (1991) Biochemistry 30, 10428-10435. [DOI] [PubMed] [Google Scholar]
- 28.Tanford, C. (1968) Adv. Protein Chem. 23, 121-282. [DOI] [PubMed] [Google Scholar]
- 29.Plaxco, K. W., Simons, K. T., Ruczinski, I. & Baker, D. (2000) Biochemistry 39, 11177-11183. [DOI] [PubMed] [Google Scholar]
- 30.Muñoz, V. & Serrano, L. (1996) Folding Des. 1, 71-77. [DOI] [PubMed] [Google Scholar]
- 31.López-Hernández, E., Cronet, P., Serrano, L. & Muñoz, V., (1997) J. Mol. Biol. 266, 610-620. [DOI] [PubMed] [Google Scholar]
- 32.Muñoz, V. & Serrano, L. (1997) Biopolymers 41, 495-509. [DOI] [PubMed] [Google Scholar]
- 33.Fersht, A. R., Matouschek, A. & Serrano, L. (1992) J. Mol. Biol. 224, 771-782. [DOI] [PubMed] [Google Scholar]
- 34.Matouschek, A., Kellis, J. T., Jr., Serrano, L. & Fersht, A. R. (1989) Nature 340, 122-126. [DOI] [PubMed] [Google Scholar]
- 35.Fersht, A. R. (2000) Proc. Natl. Acad. Sci. USA 97, 1525-1529. [DOI] [PMC free article] [PubMed] [Google Scholar]
- 36.Otzen, D. E., Itzhaki, L. S., ElMasry, N. F., Jackson, S. E. & Fersht, A. R. (1994) Proc. Natl. Acad. Sci. USA 91, 10422-10425. [DOI] [PMC free article] [PubMed] [Google Scholar]
- 37.Fersht, A. R., Matouschek, A., Serrano, L. (1997) Curr. Opin. Struct. Biol. 7, 3-9. [DOI] [PubMed] [Google Scholar]
- 38.Day, R., Bennion, B. J., Ham, S. & Daggett, V. (2002) J. Mol. Biol. 322, 189-203. [DOI] [PubMed] [Google Scholar]
- 39.Li, A. & Daggett, V. (1994) Proc. Natl. Acad. Sci. USA 91, 10430-10434. [DOI] [PMC free article] [PubMed] [Google Scholar]
- 40.Li, A. & Daggett, V. (1996) J. Mol. Biol. 257, 412-429. [DOI] [PubMed] [Google Scholar]
- 41.Daggett, V., Li, A., Itzhaki, L. S., Otzen, D. E. & Fersht, A. R. (1996) J. Mol. Biol. 257, 430-440. [DOI] [PubMed] [Google Scholar]
- 42.Grantcharova, V. P., Riddle, D. S., Santiago, J. V. & Baker, D. (1998) Nat. Struct. Biol. 5, 714-720. [DOI] [PubMed] [Google Scholar]
- 43.Jager, M., Nguyen, H., Crane, J. C., Kelly, J. W. & Gruebele, M. (2001) J. Mol. Biol. 311, 373-393. [DOI] [PubMed] [Google Scholar]
- 44.Ferguson, N., Pires, J. R., Toepert, F., Johnson, C. M., Pan, Y. P., Volkmer-Engert, R., Schneider-Mergener, J., Daggett, V., Oschkinat, H. & Fersht, A. R. (2001) Proc. Natl. Acad. Sci. USA 98, 13008-13013. [DOI] [PMC free article] [PubMed] [Google Scholar]
- 45.Ferguson, N. & Fersht, A. R. (2003) Curr. Opin. Struct. Biol. 13, 75-81. [DOI] [PubMed] [Google Scholar]


