

Abstract
Motivation: Specific non-covalent binding of metal ions and ligands, such as nucleotides and cofactors, is essential for the function of many proteins. Computational methods are useful for predicting the location of such binding sites when experimental information is lacking. Methods that use structural information, when available, are particularly promising since they can potentially identify non-contiguous binding motifs that cannot be found using only the amino acid sequence. Furthermore, a prediction method that can utilize low-resolution models is advantageous because high-resolution structures are available for only a relatively small fraction of proteins.
Results: SitePredict is a machine learning-based method for predicting binding sites in protein structures for specific metal ions or small molecules. The method uses Random Forest classifiers trained on diverse residue-based site properties including spatial clustering of residue types and evolutionary conservation. SitePredict was tested by cross-validation on a set of known binding sites for six different metal ions and five different small molecules in a non-redundant set of protein–ligand complex structures. The prediction performance was good for all ligands considered, as reflected by AUC values of at least 0.8. Furthermore, a more realistic test on unbound structures showed only a slight decrease in the accuracy. The properties that contribute the most to the prediction accuracy of each ligand were also examined. Finally, examples of predicted binding sites in homology models and uncharacterized proteins are discussed.
Availability: Binding site prediction results for all PDB protein structures and human protein homology models are available at http://sitepredict.org/.
Contact: bordner.andrew@mayo.edu
Supplementary information: Supplementary data are available at Bioinformatics online.
1 INTRODUCTION
Many proteins rely on non-covalently bound metal ions or small molecules for their enzymatic function or regulation of their activity. The presence and location of these binding sites can therefore give useful clues for deducing the biochemical function of an uncharacterized protein. As the pace of protein sequence and structure determination quickens (Burley et al., 2008), the assignment of protein function is becoming an increasingly important task. Computational methods can assist in this search by generating experimentally verifiable predictions of ligand binding sites in proteins.
A number of successful methods have been developed for predicting ligand binding sites by finding characteristic sequence patterns (Andreini et al., 2004; Passerini et al., 2006; Shu et al., 2008; Sigrist et al., 2002). Such methods are particularly useful when there is no protein structure with detectable sequence similarity. Although ligands bind to residues that are localized in 3D space, the binding residues are generally not contiguous in the amino acid sequence. Because of this fact, methods that also utilize structure information, when it is available, are expected to perform better than those that use sequence information alone.
Several distinctive properties of metal ion binding sites can be used for their prediction. Metal ion binding sites were found to have an outer shell of hydrophobic atomic groups that contains the inner shell of hydrophilic groups that coordinate the ion (Yamashita et al., 1990). However, as pointed out in that study, this may simply be due to the fact that the coordinating atoms are covalently bound to hydrophobic carbon-containing groups in the protein rather than favorable enthalpic or entropic contributions to binding. It was also observed that metal binding sites often correspond to statistically significant clusters of negatively charged residues (Zhu and Karlin, 1996). Furthermore, divalent metal cations have characteristic preferences for coordinating groups (backbone carbonyl, specific side-chain groups or water molecules) and coordination number (Dudev and Lim, 2003; Harding, 2004). Finally, binding site residues are usually conserved in orthologous proteins, presumably because of their crucial role in the protein's function.
One early prediction method used the total electrostatic valence of oxygen ligands, calculated from the inter-atomic distances, in order to predict calcium ion binding sites (Nayal and Di Cera, 1994). Another study used the FEATURE method (Bagley and Altman, 1995), which calculates properties in concentric shells around a potential binding site, with a Bayesian score to predict calcium ion binding sites (Wei and Altman, 1998). A later study used a similar method to predict zinc ion binding sites and demonstrated its applicability to unbound structures (Ebert and Altman, 2008). Also properties of clustered triplets of residue types that commonly coordinate zinc ions were successfully used to predict transition metal ion binding sites in apo protein structures (Babor et al., 2008). Binding sites for several different metal ions were also identified using the Fold-X force field applied to the atomic structure of the protein (Schymkowitz et al., 2005). Finally, the method of Sodhi et al. (2004) used neural networks trained on PSI-Blast position-specific scoring matrices (PSSMs), secondary structure states, solvent accessible surface area (SASA) and the inter-residue distance matrix for neighboring residues to predict different metal ion binding sites.
The prediction of small molecule binding sites is facilitated by their tendency to bind in pockets on the surface of the protein, due to the requirement of forming sufficient energetically favorable contacts. A variety of algorithms that locate such surface pockets have been developed (An et al., 2005; Harris et al., 2008; Laurie and Jackson, 2005). Many structure-based binding site prediction methods use predicted pockets. One study combined pocket prediction with evolutionary conservation in order to predict binding sites for an arbitrary small molecule (Huang and Schroeder, 2006). Another study (Glaser et al., 2006), used an optimized pocket finding algorithm along with conservation to locate pockets that bind ligands. The study of Burgoyne and Jackson (2006) compared different properties for ligand binding prediction and found that the total electrostatic potential, desolvation energy and conservation were the best. One challenge with such methods for predicting general ligand binding sites, irrespective of the identity of the ligand, is that it is difficult to compile a reliable negative dataset of pockets that do not bind any small molecule.
Two papers, Guo et al. (2005) and Nebel et al. (2007), described methods that use 3D motifs to predict binding sites for adenosine triphosphate (ATP) and adenine-based ligands, respectively. Finally, Brylinski and Skolnick (2008) employed threading of the query sequence to identify similar structures in the PDB with bound ligands.
We have developed the SitePredict ligand binding site prediction method that can be applied, with minor modification, to both metal ion and small molecule binding sites. The primary difference is that only surface pockets are considered for small molecule binding sites whereas clusters of residues throughout the protein are considered as potential metal ion binding sites. A machine learning method, Random Forests, is used to make a prediction for a specific ligand based on a combination of diverse properties including evolutionary conservation, median SASA, counts of nearby residue pairs and statistically significant clustering of residue types in the site. This method was motivated by the success of a similar approach for predicting protein–protein interfaces (Bordner and Abagyan, 2005). Unlike many previous approaches, SitePredict does not rely on the exact positions of side chains contacting the ligand. This is critical since actual predictions are performed on unbound structures and the protein structure undergoes conformational changes upon binding. In fact, except for the median SASA, which is relatively insensitive, there is no dependence on side-chain conformations at all. This means that it can be applied to unrefined homology models or low-resolution structures. The method's performance was evaluated using cross-validation on comprehensive non-redundant sets of both holo and apo protein structures. Also the relative contribution of the different site properties to the prediction accuracy revealed specific determinants of binding for different ligands. Binding site predictions were made for all protein structures in the PDB and are available for searching or download at http://sitepredict.org/. Also, as a demonstration of the method's utility in functional annotation, novel binding sites in proteins of unknown function whose structures were solved by structural genomics projects were examined and several examples which corroborate independent functional assignments are discussed. Finally, SitePredict was applied to predict ligand binding sites in homology models of human proteins.
1.1 Non-redundant sets of protein structures and ligand binding sites
The data used to train the machine learning classifier and assess its prediction performance was derived from a non-redundant set of X-ray structures created for each ligand. Each set was generated by first clustering all protein chains in X-ray structures from the wwPDB database (Berman et al., 2003) at 25% sequence identity using the CD-HIT program (Li and Godzik, 2006). Next, each cluster was examined and a ligand-bound protein, if present, was selected and otherwise a protein without the bound ligand was selected. If multiple chains were found in a cluster then the highest resolution chain without breaks was chosen. This procedure resulted in a non-redundant set of proteins containing the largest number of ligand-bound structures. This is important for creating a good benchmark set with an adequate number of diverse ligand binding sites, since most proteins in the structure database do not have the particular ligand bound. Although the methodology may be easily extended to include the prediction of ligands that interact with multiple protein molecules, for simplicity we only considered structures in which the ligand interacts with a single protein molecule.
1.2 Overview of the SitePredict method
Small molecules usually bind in pockets on the protein surface where they can form sufficient energetically favorable interactions with the protein. Furthermore these pockets usually remain even in the apo structure (An et al., 2005). Metal ions are also coordinated by multiple chemical groups (Harding, 2004), however they do not bind to pre-existing pockets in the surface because of their small size. Because of this difference in binding proclivities, two different prediction procedures are employed for each class of ligand. For small molecules, only the binding pockets are considered as potential binding sites and a prediction is made for each pocket as to whether or not it binds a particular ligand, based on the properties of the pocket. In contrast, for metal ions, the predictions are made for approximately spherical regions of the protein, each comprised of a cluster of a fixed number of neighboring residues. The prediction aims to identify the residue clusters that significantly overlap with a binding site for the metal ion of interest.
1.3 Residue cluster properties used for metal ion binding site prediction
The overlapping residue clusters were defined by starting with each of the residues in the query protein as a central residue and adding the nine nearest residues to form 10-residue clusters. Increasing the size of the clusters did not significantly improve prediction performance (data not shown). The fractional overlap of a cluster with the binding site, which varies between 0 and 1, was defined by the ratio:
in which the numerator is the number of residues in common between the cluster and the binding site and the denominator is the least of either the number of cluster residues or the number of binding site residues. Clusters with an overlap fraction >0.5 were considered as positive instances, i.e. ligand binding site regions, whereas the remainder were considered as negative instances, i.e. non-binding site regions.
The following properties were calculated for each residue cluster: nearby residue pair counts, number of nearby backbone O atom pairs, residue propensity log P-values, evolutionary conservation log P-value and median-relative SASA. The residue pair counts were calculated by counting the total number of nearby cluster residue pairs of each residue type. Because there are 20 different standard residue types, the number of unordered pairs of residue types, and hence the number of residue pair counts, is 210. Nearby residue pairs were required to have Cβ atom, or Cα atom for glycine, separation <10 Å. The number of nearby backbone O atom pairs was calculated by first creating a graph in which nodes represent O atoms and are connected by an edge if the corresponding atoms are separated by <5 Å and then counting the number of nodes in the maximal clique. This procedure efficiently locates backbone O atom clusters. The residue propensity P-values were calculated for each of the 20 residue types by the statistical significance of observing as many residues of that type in the cluster versus what would be expected from a random arrangement of the protein's residues. The random probability is described by the hypergeometric cumulative distribution function as
in which Nicluster is the number of residues of type i in the cluster and Nitotal (Nj≠itotal) is the number of residues of type i (not of type i) in the protein. The log P-value is expected to be more robust than raw residue-type counts, since it accounts for the different distributions of residue types occurring in distinct proteins. In other words, the log P-value is high only if the fraction of residues of a particular type in a cluster is considerably higher than the fraction of the same residue type among all residues in the protein.
1.4 Pocket properties used for small molecule binding site prediction
As mentioned above, only surface pockets on the protein surface were considered as potential binding sites for small molecules. Also pockets that are too small to contain the ligands, with volumes <200 Å3, were excluded. Surface pockets were calculated using the PocketFinder algorithm (An et al., 2005) as implemented in the ICM program version 3.5 (Molsoft LLC). Properties were calculated for the set of residues lining each pocket, which are within 4 Å of the calculated pocket surface.
Properties that describe the size and shape of the surface pocket as well as some of the same properties used for the metal ion site prediction were used for small molecule site prediction. The following properties of each pocket were used for the prediction of small molecule binding sites: nearby residue pair counts, residue propensity log P-values, evolutionary conservation log P-value, pocket volume and pocket principal components. The properties not involving the pocket shape are the same as those defined for metal ion sites and described in Section 1.3, except that they were calculated using the set of pocket residues. The three principal components are the axis lengths of an ellipsoid that approximates the pocket boundary. They conveniently summarize the generally complicated shape of the pocket in a few numbers.
1.5 Random Forest classifiers
Binding site predictions are made using a supervised learning method called Random Forests (Breiman, 2001). The Random Forest method has many advantages compared with other machine learning methods including: high accuracy, speed, resistance to overfitting, the ability to use heterogeneous training data without rescaling, estimation of the generalization error during training, and the ability to estimate the contribution of each variable to the overall prediction accuracy. A Random Forest is a collection of classification trees that are randomized by training on a bootstrap sample of the training data and also using only a subset of M (<N) of the variables. A prediction is made based on the fraction of trees selecting each class. In this application the two classes are binding site and non-binding site. A cutoff is chosen and if the fraction of trees predicting the site to be a binding site is higher than the cutoff then the overall prediction is binding site, otherwise the site is predicted to be a non-binding site.
Because of bootstrap sampling, approximately one-third of the data samples are not used for training each tree. The importance of each variable to the prediction performance can be assessed by calculating the decrease in prediction accuracy for this so-called out-of-bag data upon permuting values for the variable.
1.6 Evaluation of prediction performance
The machine learning method requires a sufficient number of independent examples of known binding sites for a ligand in order to evaluate the prediction performance and avoid potential overfitting. Only ligands with least 40 independent binding sites in the non-redundant set of protein–ligand structures, described in Section 1.1, were considered. The following metal ions fulfilled this criterion: Ca, Cu, Fe, Mg, Mn and Zn. Fe ions annotated in both oxidation states Fe(III) and Fe(II), with PDB heterocompound codes FE and FE2, respectively, were grouped together. Because many small molecules are converted into another molecule by the enzymatic action of the protein in the binding pocket, both the reactant and product were considered together as a group. For example, ATP is often hydrolyzed to adenosine diphosphate (ADP) so that these two molecules are in one group. Also, structures of protein–ligand complexes are often solved with non-hydrolyzable analogs bound so that these structures are also included within the same group. Datasets were compiled for the following groups of small molecules:
adenosine monophosphate (AMP),
ATP, ADP and analogs (ACP, ANP, ATS, SAP and TAT),
flavin-adenine dinucleotide (FAD),
heme (HEM and HEB),
nicotinamide adenine dinucleotide (NAD) and derivatives (NAP, NDP and NAI).
The PDB heterocompound ID, which coincides with the usual abbreviations for some of the compounds, are shown in parentheses. Table 1 shows the total number of proteins and sites for each ligand.
Table 1.
Number of ligand binding proteins and sites in the non-redundant datasets for each ligand
| Ligand | Number of proteins in the training set | Number of sites in the training set |
|---|---|---|
| Ca | 273(355) | 434(536) |
| Cu | 33(45) | 51(67) |
| Fe | 84(95) | 105(123) |
| Mg | 433(479) | 549(575) |
| Mn | 148(172) | 232(239) |
| Zn | 401(541) | 517(687) |
| AMP | 48(71) | 48(83) |
| ATP, ADP+analogs | 172(269) | 173(299) |
| FAD | 52(85) | 52(105) |
| Heme | 53(123) | 57(208) |
| NAD, NADP, NADPH | 107(170) | 107(199) |
The values in parentheses are the numbers of proteins or sites before removing sites that contact multiple proteins.
Random Forest input datasets, which contain all of the properties described above, were then generated for each metal ion or group of small molecules. Missing conservation values, due to an insufficient number of related protein sequences (<20), were imputed as the median of all conservation values in the input dataset. This procedure results in the assignment of a neutral value, which does not bias the prediction, for evolutionary conservation in examples with missing data. Because there are many more negative examples (non-binding sites) in the data than positive examples (binding site residue cluster or pocket) it was necessary to randomly select only a subset of the negative data to obtain a balanced dataset. This is important since training on highly unbalanced data gives a predictor that is accurate only for the majority class. Datasets with twice as many negative as positive examples were used because they gave slightly better performance than evenly balanced (1:1 ratio) datasets (data not shown). All positive examples were included in the datasets.
To evaluate the performance of the Random Forest prediction, 10-fold cross-validation was used. The cross-validation sets were constructed so that the corresponding training and test sets contain data for proteins from different Pfam families (Finn et al., 2006). This insures the independence of the cross-validation sets, which is important for an accurate assessment of the actual prediction performance.
The overall cross-validation prediction performance was summarized by the total area under the receiver operating characteristic (ROC) curve, which plots sensitivity versus (1 - specificity). The ROC curves were generated by varying the Random Forest score cutoff. The area under the curve (AUC) can vary from 0.0 to 1.0. A random prediction is expected to yield an AUC of 0.5 and the closer the AUC value is to 1.0 the more accurate the prediction is. Furthermore, the AUC is proportional to the Wilcoxon rank-sum statistic and so can be associated with a P-value for discriminating the two classes.
1.7 Class likelihood ratio for prediction confidence
The Random Forest score, defined as the fraction of trees voting for the positive class, varies from 0.0 to 1.0. Potential sites with high scores, near 1.0, are expected to be more confidently predicted as binding sites than those with lower scores. Likewise, potential sites with low scores, near 0.0, are expected to be more confidently predicted as non-binding sites than those with higher scores. This implies that the Random Forest score contains more useful information than simply whether it is above or below the binary classification cutoff.
The confidence of each prediction was estimated as a class likelihood ratio calculated from class-dependent score distributions using a method similar to that described for support vector machine classification in Bordner and Abagyan (2005). First, the distributions of cross-validation prediction scores for negative and positive examples were estimated using kernel density estimation as implemented in R (R Development Core Team, 2008). The likelihood ratio R(score) was then calculated as the ratio of the distributions, i.e.
A high value for R (much greater than the fraction of all residues expected to bind the ligand) indicates that the site is confidently predicted as a binding site for the ligand, a low value indicates that the site is confidently predicted not to be a binding site for the ligand, and an intermediate value indicates an ambiguous prediction. The likelihood ratio is useful for prioritizing predictions for experimental validation. Residue-level scores and likelihood ratios for metal ion site predictions were calculated as the median values for all residue clusters containing a particular residue.
2 RESULTS
2.1 Prediction accuracy
The accuracy of the SitePredict method in predicting binding sites for different ligands, as assessed by the 10-fold cross-validation AUC values, is shown in Table 2. Results using both ligand-bound and ligand-unbound structures are given.
Table 2.
Area under the ROC curve for 10-fold cross-validation prediction of ligand binding sites using ligand-bound and ligand-unbound protein structures
| AUC |
||||
|---|---|---|---|---|
| Ligand | Bound structure | Only top 20 variables (bound structure) | Without conservation (bound structure) | Unbound structure |
| Ca | 0.861 | 0.850 | 0.856 | 0.813 |
| Cu | 0.952 | 0.784 | 0.952 | |
| Fe | 0.960 | 0.948 | 0.953 | |
| Mg | 0.823 | 0.809 | 0.794 | 0.763 |
| Mn | 0.897 | 0.884 | 0.879 | 0.895 |
| Zn | 0.964 | 0.958 | 0.958 | 0.913 |
| AMP | 0.799 | 0.842 | 0.797 | |
| ATP, ADP+analogs | 0.884 | 0.901 | 0.852 | 0.836 |
| FAD | 0.941 | 0.928 | 0.941 | |
| Heme | 0.971 | 0.955 | 0.971 | |
| NAD, NADP, | 0.959 | 0.959 | 0.959 | 0.876 |
| NADPH | ||||
AUC values are also given for predictions using only the top 20 most important variables and without evolutionary conservation.
The transferability and generality of SitePredict is demonstrated by the high AUC values for the cross-validation prediction because the prediction is made for proteins in different Pfam families than those used for training the Random Forest classifier. In other words, high cross-validation AUC values imply that the method is expected to perform well on proteins dissimilar to those used for training, such as those without any known binding sites.
Table 1 also shows the cross-validation AUC values for binding site predictions without using evolutionary conservation. There is only a relatively small decrease in prediction performance for all ligands. This is advantageous since the evolutionary conservation could not be calculated for about 20% of the proteins due to a lack of similar protein sequences. This shows that the accuracy does not appreciably degrade for such proteins. Other methods that rely on a multiple sequence alignment through, e.g. PSSMs, cannot be applied to the significant fraction of proteins with few or no known orthologs.
The prediction results for all PDB structures are available at the SitePredict website (http://sitepredict.org/). Results for individual PDB entries can be retrieved and visualized in 3D using the Jmol viewer (Jmol, 2008) or the complete prediction tables can be downloaded for analysis. The training datasets of binding sites for each ligand, including those for bound/unbound pairs, are provided as Supplementary Material.
2.2 Prediction results for unbound structures
The decrease in the AUC for unbound as compared with bound structures was relatively small (≤0.083) showing that SitePredict is insensitive to rearrangements in the protein structure induced by ligand binding. Only surface pockets are considered as potential binding sites for small molecules so that the lack of a pocket in the unbound structure that sufficiently overlaps the binding sites (O>0.5) results in a false negative prediction. All unbound structures for NAD retained pockets in the binding sites, however, pockets for two out of the 56 unbound structures (chain A of PDB entries 1BYI and 1I7N) for ATP had too little overlap with the binding site (O=0.47 and 0.28, respectively) so that the method missed these binding sites. As expected, this can be attributed to large conformational changes in loops near the binding site leading to relatively high RMSDs between binding site residues in bound and unbound structures of 3.0 Å and 2.3 Å, respectively. Interestingly, there is a surface pocket that sufficiently overlaps the ATP binding site (O=0.61) for chain B of PDB entry 1I7N, which is the same protein as chain A (C domain of rat synapsin II), and this gives a correctly predicted ATP binding site with a high likelihood ratio of 3.9. The structural differences between the chains A and B are mostly in the binding site loop, probably due to its flexibility in the apo protein. Overall, these results support the findings of An et al. (2005) that ligand binding pockets are almost always retained in unbound structures and furthermore that the prediction accuracy is not significantly degraded by differences in these pockets due to structural changes upon ligand binding.
2.3 Contribution of binding site properties to prediction performance
The top 20 properties that contribute the most to the prediction accuracy for ligand sites were calculated using the procedure described in Section 1.5 (see Supplementary Material for results). As can be seen in Table 2, the AUC changes little for all ligands except Cu if only these top 20 properties are used for prediction. The most important residue propensities for each metal ion include the most common coordinating residues for that particular ion according to the analysis of Harding (2004). Evolutionary conservation and SASA are also among the important variable for predicting metal ion binding sites since they appear in the top 20 properties for all ions examined. Metal ion binding sites are usually conserved and generally, but not always, on the protein surface.
In contrast, evolutionary conservation only appears among the most important properties for two small molecules, ATP and NAD. Also, residue propensities appear less among the top properties for the small molecules. This may be due to several factors: (i) metal ions are positively charged and bound by clusters of negatively charged residues, (ii) small molecule binding sites are larger so that the spatial arrangement of residues within the site is more important than for smaller ion binding sites and (iii) there are more residues in a typical binding pocket than in the 10-residue clusters used for metal ion prediction so that any clustering of residue types is less statistically significant. Residues that are present in previously identified sequence motifs are also contained in the important residue pairs. For instance, A, G, K and S are in both the important residue pair variables for ATP binding sites and also in the Walker A motif. Also glycine appears in most of the important residue pairs for NAD binding sites and a glycine-rich turn was found to be a determinant of such sites (Baker et al., 1992).
2.4 Discrimination between different ligands
The ability of a Random Forest classifier trained on one ligand to reject binding sites of different ligands was assessed by comparing Random Forest scores from 10-fold cross-validation for one ligand (ligand 1) with scores from training on all cross-validation data for ligand 1 and then predicting for data from a different ligand (ligand 2). The average scores, AUC values and associated Wilcoxon rank-sum P-values for all pairs of metal ions and small molecules are given Tables 1 and 2 in the Supplementary Materials. Figure 1 shows an example of the successful discrimination between distinct Ca and Cu ion binding sites in the same protein.
Fig. 1.
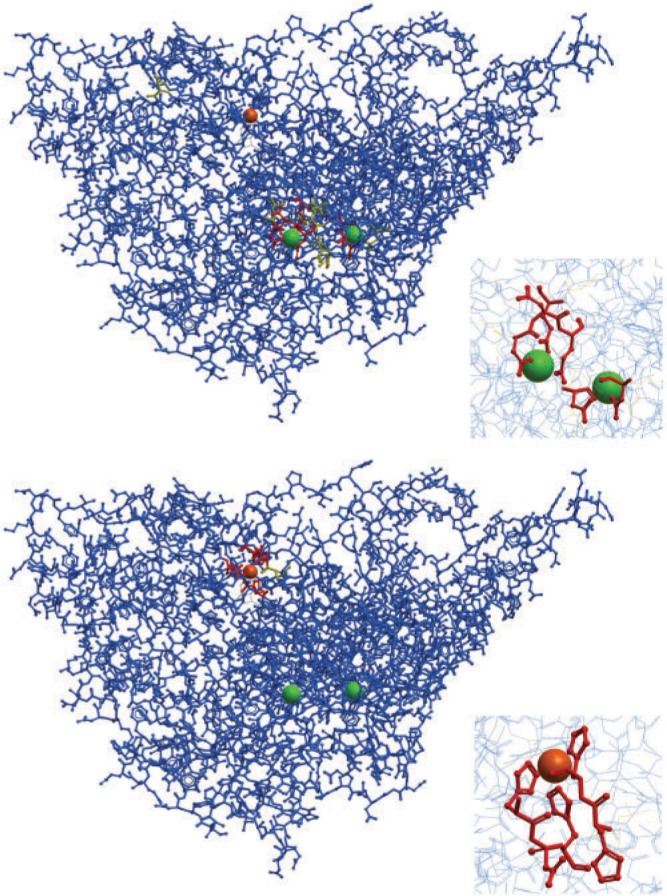
An example illustrating the successful discrimination between two different metal ions, which in this case bind to the same protein (fungal lysyl oxidase, PDB entry 1N9E). Calcium and copper binding site predictions are shown in the top and bottom figures, respectively. Predicted binding residues, with R>20, are colored red, predicted non-binding residues, with R<10, are colored blue, and residues with intermediate ambiguous values are colored yellow. The bound copper ion is orange and the calcium ions are green. The insets show a detailed view of the binding sites.
It is apparent from the tables that the discrimination performance is non-symmetric, i.e. a Random Forest trained on ligand 1 may have poor selectivity for ligand 2 but one trained on ligand 2 may be good at rejecting ligand 1 binding sites in favor of the correct ligand 2 sites. There are only two sets of ligands for which the method cannot discriminate in both reciprocal predictions: Ca and Mg ions and AMP and ATP.
It is known that one of the most prevalent Ca binding motifs, the EF-hand motif, can also bind Mg in some cases (Lewit-Bentley and Rety, 2000) and that both ions have similar coordination propensities (Kaufman-Katz et al., 1996). This is reflected by the fact that 15 out of the 20 top variables are shared by both Ca and Mg ion binding sites. More generally, predictors trained on Mg or Mn had lower specificity that those trained on other ions. The difficulty in differentiating between the binding of some metal ions, such as Mg and Mn, is also probably due in large part to the fact that many sites are known to actually bind different ions in vitro and may do so in vivo (Bock et al., 1999).
The difficulty in distinguishing binding sites for the ATP group ligands, which also include ADP, and AMP is due to the similar properties of the binding sites. Half of the 20 top variables contributing to the prediction accuracy are shared between these two ligands. One possible explanation for this similarity in the important binding site properties is the chemical similarity of the ligands; ADP and AMP differ only by a phosphate group. In addition, all small molecules considered, with the exception of heme, contain adenine moieties, which make their discrimination relatively difficult. In fact, none of the cases of poor ligand discrimination involve the chemically dissimilar heme.
2.5 Binding site predictions for modeled human proteins
Although current comparative modeling methods can usually accurately reproduce the core backbone geometry for proteins with available homologous template structures, they have difficulty in predicting the correct conformations of side chains and loops (Ginalski, 2006). Because SitePredict only requires backbone structural information it can locate ligand binding sites in homology models, even if they contain errors in side chain conformations. Furthermore, because the prediction procedure is fast it can be applied to homology models on a genome-wide scale for functional annotation. Typically, between 30% and 60% of proteins in sequenced genomes have a related protein of known structure and these percentages are increasing as new structures become available (Xiang, 2006).
The application of SitePredict to homology models was demonstrated by predicting ligand binding sites in a set of models for 688 human proteins downloaded from MODBASE (Pieper et al., 2006), a database of protein structures generated by an automated modeling pipeline using the MODELLER program (Sali and Blundell, 1993). Only models that are expected to be accurate [score>0.7 (Melo et al., 2002) and PSI-BLAST E-value<1×10⁻⁴] but that have low sequence identity to the template protein sequence (<25%), and thus potentially yield novel binding site predictions not inferable from sequence homology alone, were considered. Prediction results for all ligands are available on the SitePredict website.
Although the binding sites, or even which ligands bind, are unknown for most of the human proteins, high-resolution structures with bound ligands are available for comparison in a few cases. Structures with bound ATP group ligands (PDB entries 2GK6 and 2GT0, respectively) were available for human type 1 RNA helicase (Upf1) and nicotinamide riboside kinase 1 (NRK1). In both cases, the highest scoring predicted binding pockets in the model structures, with R=7.5 and 11.9, respectively, overlapped the actual binding sites. Also the structure of one human protein in the set with heme bound, prostacyclin synthase (PGIS, PDB entry 3B6H) is available. Again the highest scoring binding pocket (R=50) overlapped with the heme binding site. Even though the sequence similarity was low, the template structures for NRK1 and PGIS (2BBW and 1TQN) contained the corresponding ligands. No ligands are bound to the Upf1 template structure (1PJR).
2.6 Identifying new ligand binding sites in structures of uncharacterized proteins
In recent years, the number of new X-ray structures of proteins with no significant sequence similarity to those already solved has been rapidly increasing, largely due to structural genomics projects (Chandonia and Brenner, 2006). Even with available high-resolution structures, the biological function of many of these proteins remains unknown. Knowledge of what ligands bind to a protein and where they bind can help in inferring the function.
Binding site predictions were examined for a set of proteins with available X-ray structures but lacking functional annotation, downloaded from the PSI Structural Genomics Knowledgebase (http://kb.psi-structuralgenomics.org/KB/). Although the binding site predictions will require experimental verification there were some proteins for which independent evidence suggests that they are correct.
One example is a predicted NAD binding site in Haemophilus influenzae shikimate dehydrogenase-like protein HI0607 (PDB entry 1NPY). Phylogenetic analysis showed that this protein is in a distinct group from the two previously known functional classes (Singh et al., 2005). The protein was also shown to catalyze the NADP+-dependent oxidation of shikimate. In addition, mutagenesis of two conserved residues, D103 and K67, inactivated the enzyme, thus implying that they are important catalytic groups. Both of these residues are in the predicted NAD-binding pocket. Finally, the protein has 30% sequence identity to an AroE shikimate dehydrogenase (PDB entry 1NVT) that has the same fold and NADP bound in the predicted pocket region.
Another example is a predicted NAD-binding pocket in a mouse protein annotated as a putative NADPH-dependent oxidoreductase (PDB entry 1VJ1). A structural alignment revealed similarity to a quinone oxidoreductase (PDB entry 1QOR) even though the sequence identity is only 18% (Levin et al., 2004). Furthermore, the quinone oxidoreductase structure has an NADPH molecule bound in the pocket corresponding to the predicted NAD binding pocket in the 1VJ1 structure.
3 CONCLUSIONS
SitePredict was shown to perform well in predicting specific metal ion and small molecule binding sites in protein structures, with AUC≥0.80 for bound structures. Its performance on unbound structures was only slightly lower, demonstrating that the method is insensitive to most ligand-induced conformational changes in the benchmark set, which include side-chain reorganization and small to moderate backbone changes. SitePredict was also applied to predicting binding sites in uncharacterized proteins in PDB structures as well as automatically generated homology models of human proteins. Almost all of these predictions await experimental verification and potentially offer valuable clues to each protein's function.
There are several possible areas of future investigation. One is to extend the binding site predictions to additional small molecules for which there are not enough ligand–protein complexes in the PDB for adequate training and validation. This could be accomplished, for example, by either collecting independent experimental binding data or training the method on clusters of similar binding sites, which presumably bind the same or chemically similar ligands. Finally, it would be useful to train additional classifiers that are optimized for discrimination between difficult to distinguish ligands.
Funding: Mayo Clinic and a Biopilot project from the DOE Office of Advanced Scientific Computing Research; ERKP558 ‘An integrated knowledge base for the Shewanella Federation’ from the DOE Office of Biological and Environmental Research.
Conflict of Interest: none declared.
Supplementary Material
REFERENCES
- An J, et al. Pocketome via comprehensive identification and classification of ligand binding envelopes. Mol. Cell Proteomics. 2005;4:752–761. doi: 10.1074/mcp.M400159-MCP200. [DOI] [PubMed] [Google Scholar]
- Andreini C, et al. A hint to search for metalloproteins in gene banks. Bioinformatics. 2004;20:1373–1380. doi: 10.1093/bioinformatics/bth095. [DOI] [PubMed] [Google Scholar]
- Babor M, et al. Prediction of transition metal-binding sites from apo protein structures. Proteins. 2008;70:208–217. doi: 10.1002/prot.21587. [DOI] [PubMed] [Google Scholar]
- Bagley SC, Altman RB. Characterizing the microenvironment surrounding protein sites. Protein Sci. 1995;4:622–635. doi: 10.1002/pro.5560040404. [DOI] [PMC free article] [PubMed] [Google Scholar]
- Baker PJ, et al. Structural consequences of sequence patterns in the fingerprint region of the nucleotide binding fold. Implications for nucleotide specificity. J. Mol. Biol. 1992;228:662–671. doi: 10.1016/0022-2836(92)90848-e. [DOI] [PubMed] [Google Scholar]
- Berman H, et al. Announcing the worldwide Protein Data Bank. Nat. Struct. Biol. 2003;10:980. doi: 10.1038/nsb1203-980. [DOI] [PubMed] [Google Scholar]
- Bock CW, et al. Manganese as a replacement for magnesium and zinc: functional comparison of the divalent ions. J. Am. Chem. Soc. 1999;121:7360–7372. [Google Scholar]
- Bordner AJ, Abagyan R. Statistical analysis and prediction of protein-protein interfaces. Proteins. 2005;60:353–366. doi: 10.1002/prot.20433. [DOI] [PubMed] [Google Scholar]
- Breiman L. Random forests. Mach. Learn. 2001;45:5–32. [Google Scholar]
- Brylinski M, Skolnick J. A threading-based method (FINDSITE) for ligand-binding site prediction and functional annotation. Proc. Natl Acad. Sci. USA. 2008;105:129–134. doi: 10.1073/pnas.0707684105. [DOI] [PMC free article] [PubMed] [Google Scholar]
- Burgoyne NJ, Jackson RM. Predicting protein interaction sites: binding hot-spots in protein-protein and protein-ligand interfaces. Bioinformatics. 2006;22:1335–1342. doi: 10.1093/bioinformatics/btl079. [DOI] [PubMed] [Google Scholar]
- Burley SK, et al. Contributions to the NIH-NIGMS protein structure initiative from the PSI production centers. Structure. 2008;16:5–11. doi: 10.1016/j.str.2007.12.002. [DOI] [PMC free article] [PubMed] [Google Scholar]
- Chandonia JM, Brenner SE. The impact of structural genomics: expectations and outcomes. Science. 2006;311:347–351. doi: 10.1126/science.1121018. [DOI] [PubMed] [Google Scholar]
- Dudev T, Lim C. Principles governing Mg, Ca, and Zn binding and selectivity in proteins. Chem. Rev. 2003;103:773–788. doi: 10.1021/cr020467n. [DOI] [PubMed] [Google Scholar]
- Ebert JC, Altman RB. Robust recognition of zinc binding sites in proteins. Protein Sci. 2008;17:54–65. doi: 10.1110/ps.073138508. [DOI] [PMC free article] [PubMed] [Google Scholar]
- Finn RD, et al. Pfam: clans, web tools and services. Nucleic Acids Res. 2006;34:D247–D251. doi: 10.1093/nar/gkj149. [DOI] [PMC free article] [PubMed] [Google Scholar]
- Ginalski K. Comparative modeling for protein structure prediction. Curr. Opin. Struct. Biol. 2006;16:172–177. doi: 10.1016/j.sbi.2006.02.003. [DOI] [PubMed] [Google Scholar]
- Glaser F, et al. A method for localizing ligand binding pockets in protein structures. Proteins. 2006;62:479–488. doi: 10.1002/prot.20769. [DOI] [PubMed] [Google Scholar]
- Guo T, et al. A novel statistical ligand-binding site predictor: application to ATP-binding sites. Protein Eng. Des. Sel. 2005;18:65–70. doi: 10.1093/protein/gzi006. [DOI] [PubMed] [Google Scholar]
- Harding MM. The architecture of metal coordination groups in proteins. Acta Crystallogr. D Biol. Crystallogr. 2004;60:849–859. doi: 10.1107/S0907444904004081. [DOI] [PubMed] [Google Scholar]
- Harris R, et al. Automated prediction of ligand-binding sites in proteins. Proteins. 2008;70:1506–1517. doi: 10.1002/prot.21645. [DOI] [PubMed] [Google Scholar]
- Huang B, Schroeder M. LIGSITEcsc: predicting ligand binding sites using the connolly surface and degree of conservation. BMC Struct. Biol. 2006;6:19. doi: 10.1186/1472-6807-6-19. [DOI] [PMC free article] [PubMed] [Google Scholar]
- Jmol. Jmol: an open-source Java viewer for chemical structures in 3D. 2008. Available at http://www.jmol.org/ [Google Scholar]
- Kaufman-Katz A, et al. Calcium ion coordination: a comparison with that of beryllium, magnesium, and zinc. J. Am. Chem. Soc. 1996;118:5752–5763. [Google Scholar]
- Laurie AT, Jackson RM. Q-SiteFinder: an energy-based method for the prediction of protein-ligand binding sites. Bioinformatics. 2005;21:1908–1916. doi: 10.1093/bioinformatics/bti315. [DOI] [PubMed] [Google Scholar]
- Levin I, et al. Crystal structure of a putative NADPH-dependent oxidoreductase (GI: 18204011) from mouse at 2.10 A resolution. Proteins. 2004;56:629–633. doi: 10.1002/prot.20163. [DOI] [PubMed] [Google Scholar]
- Lewit-Bentley A, Rety S. EF-hand calcium-binding proteins. Curr. Opin. Struct. Biol. 2000;10:637–643. doi: 10.1016/s0959-440x(00)00142-1. [DOI] [PubMed] [Google Scholar]
- Li W, Godzik A. Cd-hit: a fast program for clustering and comparing large sets of protein or nucleotide sequences. Bioinformatics. 2006;22:1658–1659. doi: 10.1093/bioinformatics/btl158. [DOI] [PubMed] [Google Scholar]
- Melo F, et al. Statistical potentials for fold assessment. Protein Sci. 2002;11:430–448. doi: 10.1002/pro.110430. [DOI] [PMC free article] [PubMed] [Google Scholar]
- Nayal M, Di Cera E. Predicting Ca(2+)-binding sites in proteins. Proc. Natl Acad. Sci. USA. 1994;91:817–821. doi: 10.1073/pnas.91.2.817. [DOI] [PMC free article] [PubMed] [Google Scholar]
- Nebel JC, et al. Automatic generation of 3D motifs for classification of protein binding sites. BMC Bioinformatics. 2007;8:321. doi: 10.1186/1471-2105-8-321. [DOI] [PMC free article] [PubMed] [Google Scholar]
- Passerini A, et al. Identifying cysteines and histidines in transition-metal-binding sites using support vector machines and neural networks. Proteins. 2006;65:305–316. doi: 10.1002/prot.21135. [DOI] [PubMed] [Google Scholar]
- Pieper U, et al. MODBASE: a database of annotated comparative protein structure models and associated resources. Nucleic Acids Res. 2006;34:D291–D295. doi: 10.1093/nar/gkj059. [DOI] [PMC free article] [PubMed] [Google Scholar]
- R Development Core Team. R: A Language And Environment For Statistical Computing. Austria: Vienna; 2008. [Google Scholar]
- Sali A, Blundell TL. Comparative protein modelling by satisfaction of spatial restraints. J. Mol. Biol. 1993;234:779–815. doi: 10.1006/jmbi.1993.1626. [DOI] [PubMed] [Google Scholar]
- Schymkowitz JW, et al. Prediction of water and metal binding sites and their affinities by using the Fold-X force field. Proc. Natl Acad. Sci. USA. 2005;102:10147–10152. doi: 10.1073/pnas.0501980102. [DOI] [PMC free article] [PubMed] [Google Scholar]
- Shu N, et al. Prediction of zinc-binding sites in proteins from sequence. Bioinformatics. 2008;24:775–782. doi: 10.1093/bioinformatics/btm618. [DOI] [PubMed] [Google Scholar]
- Sigrist CJ, et al. PROSITE: a documented database using patterns and profiles as motif descriptors. Brief. Bioinform. 2002;3:265–274. doi: 10.1093/bib/3.3.265. [DOI] [PubMed] [Google Scholar]
- Singh S, et al. Crystal structure of a novel shikimate dehydrogenase from Haemophilus influenzae. J. Biol. Chem. 2005;280:17101–17108. doi: 10.1074/jbc.M412753200. [DOI] [PMC free article] [PubMed] [Google Scholar]
- Sodhi JS, et al. Predicting metal-binding site residues in low-resolution structural models. J. Mol. Biol. 2004;342:307–320. doi: 10.1016/j.jmb.2004.07.019. [DOI] [PubMed] [Google Scholar]
- Wei L, Altman RB. Recognizing protein binding sites using statistical descriptions of their 3D environments. Pac. Symp. Biocomput. 1998;3:497–508. [PubMed] [Google Scholar]
- Xiang Z. Advances in homology protein structure modeling. Curr. Protein Pept. Sci. 2006;7:217–227. doi: 10.2174/138920306777452312. [DOI] [PMC free article] [PubMed] [Google Scholar]
- Yamashita MM, et al. Where metal ions bind in proteins. Proc. Natl Acad. Sci. USA. 1990;87:5648–5652. doi: 10.1073/pnas.87.15.5648. [DOI] [PMC free article] [PubMed] [Google Scholar]
- Zhu ZY, Karlin S. Clusters of charged residues in protein three-dimensional structures. Proc. Natl Acad. Sci. USA. 1996;93:8350–8355. doi: 10.1073/pnas.93.16.8350. [DOI] [PMC free article] [PubMed] [Google Scholar]
Associated Data
This section collects any data citations, data availability statements, or supplementary materials included in this article.