

Abstract
Initial PACAP-regulated transcriptomes of PACAP-treated cultured chromaffin cells, and the adrenal gland of wild-type versus PACAP-deficient mice, have been assembled using microarray analysis. These were compared to previously acquired PACAP-regulated transcriptome sets from PC12 cells and mouse central nervous system, using the same microarray platform. The Ingenuity Pathways Knowledge Base was then employed to group regulated transcripts into common first and second messenger regulatory clusters. The purpose of our meta-analysis was to identify sets of genes regulated distinctly or in common by the neurotransmitter/neurotrophin PACAP in specific physiological contexts. Results suggest that PACAP participates in both the basal differentiated expression, and the induction upon physiological stimulation, of distinct sets of transcripts in neuronal and endocrine cells. PACAP in both developmental and acute regulatory paradigms acts on target genes regulated by either TNFα or TGFβ, two first messengers acting on transcription mainly through NFκB and Smads, respectively.
Keywords: adrenal gland, bovine chromaffin cells, Btg2, C/EBP, Ier3, meta-analysis, microarray, middle cerebral artery occlusion, PACAP, PC12, Scmh1, secretogranin, TGFβ, TNFα, YWAHZ
1. Introduction
Pituitary adenylate cyclase activating polypeptide (PACAP) is involved in neuroprotection, neurotransmission, glucohomeostasis, circadian rhythmicity, neuronal development, and cell proliferation and transformation [3, 4, 9, 16, 39, 48, 58]. To perform these roles, PACAP must influence the expression of multiple cohorts of genes. The concept of PACAP-dependent gene expression underlies previous work demonstrating a link between PACAP and glutamate-induced brain-derived neurotrophic factor (BDNF) expression [24, 52, 61], a role for PACAP in effects of lithium on cortical neurons [10], PACAP-dependent gene expression in response to cerebral ischemia [15], and impaired basal expression of specific genes in PACAP-deficient mice [14]. Some of these transcripts may be regulated not only by PACAP but by other agents and transmitters that elevate intracellular cAMP, a major downstream pathway for PACAP [13, 33, 38, 49]. PACAP is also a strong activator of ERK [7, 26, 34, 57], and some PACAP-dependent genes such as BDNF may be activated by other stimulators of this MAPK pathway, including therapeutic agents such as lithium [25]. Calcium elevation is a third known major mode of signaling to the nucleus through which PACAP, via the PAC1 receptor, might activate gene expression [6, 8, 29, 37, 40, 42, 53, 60, 62]. PACAP-specific regulation of particular target genes, including those encoding neuropeptides, may be due to the unique combinatorial elevation of cAMP, calcium and MAPK by PACAP [30].
PACAP-dependent genes may be either down-regulated or up-regulated directly in response to increased neuronal PACAP release during physiological or pathophysiological events. PACAP-dependent genes may also be regulated in less obvious ways, for example via the action of PACAP as a neurotrophin in development, or through basal rather than stimulated secretion of PACAP in vivo. Thus, strategies for identifying PACAP-dependent transcripts, or ‘PACAP target genes’ have involved microarray analysis in PACAP knock-out mice, in wild-type mice treated with PACAP [15], and in cultured neuroendocrine cells exposed to PACAP [28, 45, 57]. Meta-analysis of transcriptome profiles in these different conditions may help to identify ‘intrinsically’ PACAP-responsive genes. This type of analysis entails certain caveats, however. One is that exogenous PACAP may interact with receptors (VPAC1, VPAC2) for which vasoactive intestinal polypeptide (VIP) rather than PACAP is the endogenous ligand. For this reason, pharmacological treatment with PACAP will not always represent the mirror image of PACAP deficiency, with respect to transcriptome analysis. Data acquisition using different transcriptomic platforms, differences in the times of exposure and treatment, and differences in cell types within a tissue may also mask PACAP-dependent transcriptional regulation. Comparison of differentially complex systems, for example the adrenomedullary synapse at which PACAP is the only known neuropeptide slow transmitter, and the brain which contains many overlapping and redundant ones, is an additional factor. Despite these concerns, analysis of multiple transcriptome data sets relevant to PACAP’s role in gene regulation (meta-analysis) has the potential to reveal genes uniquely regulated by PACAP, and thus PACAP’s underlying physiological function. Conversely, meta-analysis can potentially reveal genes commonly regulated by PACAP in neuronal cells and by other signaling molecules in other cellular contexts, providing insight into potential common signal transduction pathways employed by PACAP and cytokines, growth factors, and other neurotransmitters.
Here, we created a data manifold to reveal patterns of PACAP-dependent gene transcription. Data were collated from the literature to create an ‘anchor set’ of PACAP-responsive genes. This was augmented from specific data sets obtained for this purpose from wild-type versus PACAP-deficient mouse endocrine tissue, and PACAP-treated versus untreated bovine chromaffin cells, reported herein. Filtering of these additional data sets through the anchor set revealed a set of PACAP-dependent genes as a basis for drug discovery, regulatory network hierarchical arrangement, and identification of new regulatory functions for known genes.
2. Materials and Methods
2.1. Sources of data for meta-analysis
Six data sets were compared in this analysis. The first two are reported here for the first time. The first set consists in a comparison of the adrenal gland transcriptome differentially expressed in wild-type compared to PACAP knock-out mice. Briefly, RNA was extracted from both adrenal glands of individual mice, and cDNA synthesized and used for hybridization to the NIMH 36K microarray all as previously described [15]. The second set consists in a comparison of the bovine chromaffin cell (BCC) transcriptome differentially expressed in untreated cultured chromaffin cells and those treated for six hours with 100 nM PACAP-27. Briefly, BCCs were cultured in T150 flasks (~50 million cells/flask) following differential plating in T150 flasks for 24 hours following isolation, as described [30]. PACAP or vehicle was introduced into each flask from a 100x concentrated stock solution in complete medium the day following re-plating. Cells were harvested 6 hours later by scraping into medium, collected by centrifugation at 1000 rpm in Eppendorf 5810 centrifuge for five minutes, washed with PBS by re-suspension and re-centrifugation, and RNA was extracted. cDNA was synthesized and labeled, and hybridization to the NIMH 36K microarray was carried out, all as previously described [15]. The third through fifth data sets were extracted from the literature for the PACAP transcriptome of PC12 cells. These data sets represented i) the differential transcriptome derived from PACAP treatment of PC12 cells for six hours in the presence of cycloheximide to detect transcripts up-regulated by PACAP from 0–6 h and whose expression returns to baseline by 6 h [45]; ii) the differential transcriptome derived from PACAP treatment of PC12 cells for six hours (the minimal time of exposure to PACAP leading to full differentiation 48 hours later [57]); and iii) transcripts up-regulated by PACAP after PC12 cell treatment for the full 48 hours leading to a full PACAP-induced neuritogenic response [28]. The sixth and final data set is a composite of transcripts regulated by middle cerebral artery occlusion (MCAO) in the mouse at 1 and 24 hours post-MCAO, in both wild-type and PACAP knock-out mice as originally described by Chen et al. [15]. The NIA15K mouse embryo-derived clone set ([54], and see http://lgsun.grc.nia.nih.gov/cDNA/15k.html) was used for PC12 cell microarray experiments [45, 57]. The NIMH 36K cDNA microarray containing NIA15K, and BMAP1 and BMAP2 brain-specific clone sets [59] was used for the mouse adrenal gland (MAG) and bovine chromaffin cell (BCC) microarray hybridization experiments reported here, as well as the MCAO data of Chen et al., [15], analyzed here. See also http://lgsun.grc.nia.nih.gov/cDNA/15k.html, http://clones.invitrogen.com/cloneinfo.php?clone=est, and http://genome.uiowa.edu/projects/BMAP/ for additional information on the clone sets comprising the NIMH 36K cDNA microarray.
Raw data from the BCC and MAG microarray experiments have been submitted to the GEO (gene expression omnibus) database and can be accessed using the GS series designations GSE7405 and GSE7406.
2.2. Extraction of data from published literature
In order to extract the data from the published literature for further analysis, tables containing the data in a given publication were saved in a PDF format using cutePDF (http://www.cutepdf.com/Products/CutePDF/writer.asp) and subsequently converted to an Excel table using PDF to Excel Converter (http://www.bluelabelsoft.de/index.htm). The GenBank accession numbers in each table were converted to Entrez GeneID (formerly known as LocusLink ID and gene symbols) using the SOURCE (http://genome-www5.stanford.edu/cgi-bin/source/sourceSearch) website. A few remaining unannotated expressed sequence tags (EST) were eliminated from further consideration in this report. The dataset extracted from each publication was then exported to Microsoft ACCESS for cross comparison using gene symbol as the common element. For comparison, the genes listed in multiple tables within each publication were combined to create a unique gene set for that condition (PC12 0-6 h, PC12 6 h, PC12 48 h, etc). The IMAGE and SSH (suppression subtractive hybridization) clones reported by Grumolato et al. [28] were also annotated in a similar manner. Data from Chen et al (2006) [15] were extracted using the same tools but without need for ID conversion, as GeneIDs and gene symbols were provided in the publication.
2.3. Acquisition of data from mAdb
The microarray data sets (adrenal gland wild-type vs. PACAP knock-out and the bovine chromaffin cells treated with PACAP) were analyzed as follows:
2.3.1. Creation of dataset
For the analysis of unpublished data (i.e. MAG and BCC), simple data extraction was done in the NIH Center for Information Technology’s mAdb, and data sets were stored as permanent files in mAdb for further analysis.
2.3.2. Group analysis for missing values
Genes with low quality values in more than 60% of the arrays per group were removed from analysis using the missing value filter tool in mAdb. The remaining genes were used for group statistical analysis as well as for SAM (Significance Analysis of Microarrays) [56].
2.3.3. SAM analysis
SAM was carried out using the resident SAM [56] tool in mAdb, setting the number of permutations to 1000, and the false discovery rate (FDR) to 10% or less, depending on whether input hybridization cDNA was obtained from mouse tissue or bovine cells (see Table 1).
Table 1.
Mouse Adrenal Gland and Bovine Chromaffin Cell Microarray Analysis.
| Source of Transcriptome | Number of Arrays | Clones per Array | FDR | Named Upregulated Genes | Named Upregulated Genes > 2-fold |
|---|---|---|---|---|---|
| MAG | 6 | 29686 | 0.014 | 1353 | 228 |
| BCC | 4 | 21795 | 0.100 | 340 | 187 |
cDNA from mouse adrenal gland (MAG) of wild-type versus PACAP-deficient animals was hybridized and represented as wild-type:PACAP-deficient ratio for each gene (i.e. up-regulation refers to greater transcript abundance in wild-type than in PACAP-deficient MAG). cDNA from bovine chromaffin cells (BCC) of 6-h PACAP-treated (100 nM PACAP-27) versus untreated cells hybridized and represented as PACAP-treated:untreated ratio for each gene (i.e. up-regulation refers to greater transcript abundance in PACAP-treated than in untreated cells). Each array consisted in a separate paired experiment. The number of clones per array shown above represents the gene targets passing the filter for signal quality in each set (see Materials and Methods). Significantly up-regulated transcripts were those determined using SAM (statistical analysis of microarrays) at the false discovery rates (FDR) shown, after filtration for named genes (Named Upregulated) and after further filtration to remove values less than two-fold upregulated (Named Upregulated Genes > 2-fold).
2.4. Cross comparison of different data sets
SAM-significant transcripts along with their values and gene annotation were exported from mAdb into an Excel format and then to Microsoft ACCESS. Only the clone IDs of the genes along with the fold change expression value were exported to eliminate the discrepancy in the gene annotation between different datasets. The latest clone annotation for the entire array set was then obtained from its mAdb GIPO file as a comprehensive report used to annotate the clones represented in both MAG and BCC microarrays. SAM-significant values were converted to linear scale and expressed in the form of fold change (see Section 2.7, below). Only the clone IDs of the genes along with the fold change expression value were exported to eliminate the discrepancy in the gene annotation between different datasets. The latest clone annotation for the entire array set was then obtained from its mAdb GIPO file as a comprehensive report used to annotate the clones represented in both MAG and BCC microarrays.
2.5. Resolution of data obtained from multiple clones for the same gene
In a few cases there were multiple clones (microarray hybridization targets) with the same GeneID but with divergent (conflicting) values. To authenticate each target, the available GenBank sequences of the clones were compared to the gene RefSeq sequence (http://www.ncbi.nlm.nih.gov/blast/bl2seq/wblast2.cgi). If the clone sequences on both the 5’ and 3’ ends matched to the RefSeq sequence, the target was deemed authentic. If there was a match only with the sequence on one side of the clone but not on the other side, it was considered a mixed clone and was rejected. Likewise, clones having sequence for only one end available were rejected, if in conflict, in favor of clones with both ends sequenced
2.6. Definitions and ontological values of terms used to cross-reference gene sets
The following terms and designations for cDNA clones on microarrays, and links to curated information about their gene loci, actual and hypothetical translation products, and relationship to other cDNA clones, are defined in detail at the following URL: http://atlasgeneticsoncology.org/extdef.html.
2.6.1 Clone ID
This designates a GIPO file accession number, and is the name given to a specific clone regardless of the gene content when it was cloned into a vector and then deposited in the GenBank database.
2.6.2. UniGene cluster ID
UniGene is an experimental system for automatically partitioning GenBank sequences into a non-redundant set of gene-oriented clusters. Each UniGene cluster contains sequences that represent a unique gene, as well as related information such as the tissue types in which the gene is expressed and map location.
2.6.3. Gene name
The Human Gene Nomenclature Database (HUGO) provides currently approved human gene symbols or names as maintained by the HUGO gene nomenclature committee.
2.6.4. GenBank accession number
GenBank is the NIH database of all deposited nucleotide and protein sequences. Each deposit gets a unique ID.
2.6.5. LocusLink/GeneID
Entrez_Gene is the primary identification for the genes in Entrez database and links to other databases such as RefSeq, maps, OMIM (Online Mendelian Inheritance in Man), UniGene and PubMed.
2.7. Network analysis of individual and composite data sets
Interaction networks for gene symbol lists of the up-regulated transcripts for BCC (188 transcripts), PC12 composite (168 transcripts), MCAO-1h (76 transcripts), MCAO-24 h (74 transcripts), and final composite (26 transcripts) were obtained employing the Ingenuity Pathways Knowledge Base (http://www.ingenuity.com/; see also [11]). A total of 29 networks were obtained [nine for BCC, ten for PC12 composite, four each for MCAO-1 and MCAO-24, and two for the final composite], using a threshold of at least eight focus genes (i.e. input genes, or genes up-regulated by PACAP or PACAP-dependent within the given set) per network assembled. Three networks were filtered out, based on a) reliance of entire network on a single reference (network 1, PC12 composite), b) containing a major component known not to be expressed in cells of interest (network 4, BCC, features CAMKIV not expressed in BCCs), and c) dominance by direct interactions (protein-protein interactions) dependent on post-translational modifications for which evidence was lacking in these studies (network 2, BCC, featuring multiple JAK-STAT protein-protein interactions not involving changes in mRNA levels for either encoded protein). All 23 remaining networks were considered in meta-analysis. For purposes of illustration, only the highest-ranked networks in each remaining set are shown as figures.
3. Results and Discussion
3.1. PACAP-responsive transcripts of mouse adrenal gland and bovine chromaffin cells
PACAP regulation of transcripts at six hours following treatment of primary post-mitotic bovine chromaffin cells in culture with 100 nM PACAP-27, and of mouse adrenal gland in wild-type compared to PACAP-deficient mice without additional treatment, was determined as summarized in Table 1. Different false discovery rates were applied to obtain the significant genes from SAM analysis (Table 1). For MAG, the FDR was set low while for BCC, it was set high to take into account the potential loss of signal due to cross-species hybridization. As a two-fold cut off was used to obtain the data in the published literature, a similar cut off was used for both of these data sets after SAM analysis.
First, transcripts were determined to be up-regulated by PACAP (down-regulated transcripts were not considered in this analysis) if their abundance was i) significantly higher by SAM in wild-type compared to PACAP-deficient adrenal gland or in PACAP-treated compared to non-treated bovine chromaffin cells, and ii) the difference between the two conditions was at least two-fold, based on the SAM-derived mean values of the ratio between the two respective sets of conditions. The number of transcripts regulated by this criterion was 228 in the MAG microarray data set, and these transcripts are listed in Supplementary Table S1. Some of the transcripts reported to be regulated in the rodent adrenal gland upon splanchnicoadrenomedullary synaptic activation were down-regulated by lack of PACAP expression (i.e. in PACAP-deficient mice) under quiescent conditions. Prominent among these was the neuropeptide precursor secretogranin II, which generates the neuroactive peptide secretoneurin, and is not regulated by splanchnic nerve activity at the protein level [21]. Transcripts for other characteristic products of the adrenal medulla including chromogranin A, chromogranin B, and tyrosine hydroxylase (TH) were not significantly decreased by the absence of PACAP, consistent with the apparent lack of effect of PACAP deficiency on adrenomedullary chromogranin A, TH, and phenylethanolamine N-methyltransferase (PNMT) at the protein level as previously reported [31]. Secretogranin III mRNA levels were also significantly decreased in the PACAP-deficient adrenal gland, while mRNA encoding neuropeptides known to be regulated by stimuli that release PACAP and ACh at the splanchnicoadrenomedullary synapse, including neuropeptide Y (NPY), neurotensin and substance P, were not altered in the basal state. This suggests either that the fast and slow co-transmitters ACh and PACAP may separately regulate the abundance of different classes of secretory products in the adrenal gland. Alternatively, regulation by PACAP for some neuropeptide-encoding genes may occur only under conditions in which stimulus-secretion-synthesis coupling is engaged by prolonged PACAP release, for example following splanchnic nerve stimulation by insulin, reserpine, or physiological stress. Among transcripts likely to be developmentally important, and likely to be expressed in the adrenal medulla as well as or in addition to adrenal cortex, Scmh1, Btg2, Jarid1c and BMPR2 were at least two-fold less abundant in PACAP-deficient compared to normal mouse adrenal.
In contrast, transcripts regulated in fully differentiated, mature chromaffin cells in culture by treatment with PACAP included substance P, enkephalin, and secretogranin II as reported previously in either PACAP-treated BCC [5, 29] or rodent adrenal in vivo after stimulation with insulin [2, 20, 22, 23]. In total, 187 transcripts were found to be PACAP-regulated in bovine chromaffin cells (Table S2). Ingenuity analysis was used to determine if the core set of genes regulated by PACAP are regulated by other signal transduction components, thus providing some clues to novel signaling pathways used by PACAP. Transcripts encoding YWHAZ (14-3-3-zeta) and several proteins interacting with it, are up-regulated by PACAP, suggesting that a 14-3-3 network may be fundamentally modulated by PACAP as part of its slow transmitter function at the adrenomedullary synapse (Figure 1a). Increased expression of YWHAZ activation may provide a molecular mechanism, in addition to direct phosphorylation of TH by adenylate cyclase, for the long-term PACAP-dependent activation of adrenomedullary TH in vivo subserving glucohomeostasis during metabolic stress [31]. Strikingly, as shown in Figures 1b and 1c, several PACAP target genes are also targets of TGFβ and TNFα in other cellular contexts, implicating Smads [19], and NFκB [27], respectively, in PACAP signaling in neuroendocrine cells.
Figure 1. Regulatory networks for PACAP-dependent transcripts in BCC (bovine chromaffin cells).
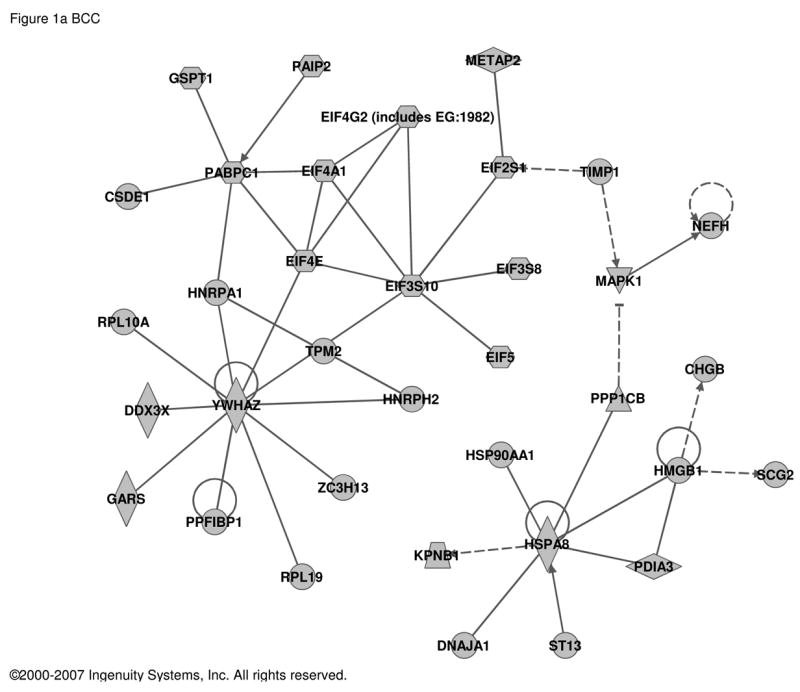
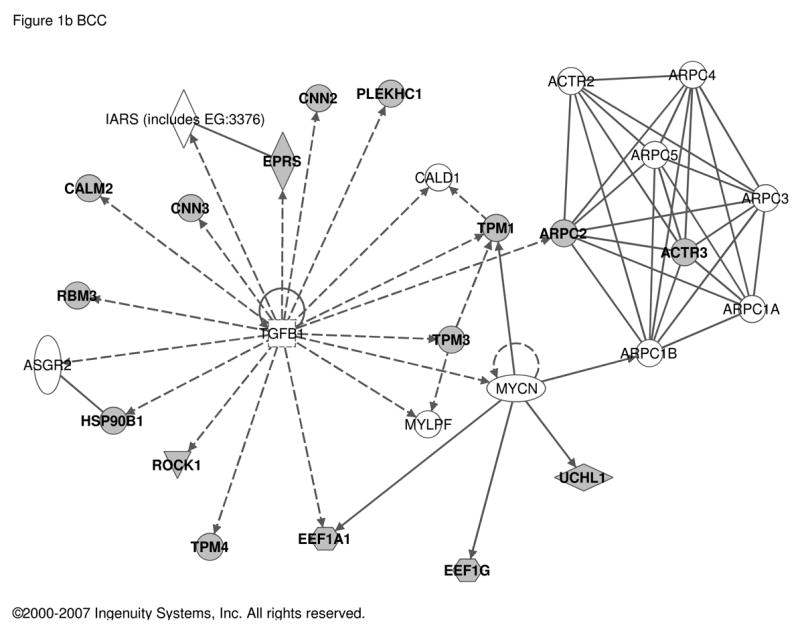
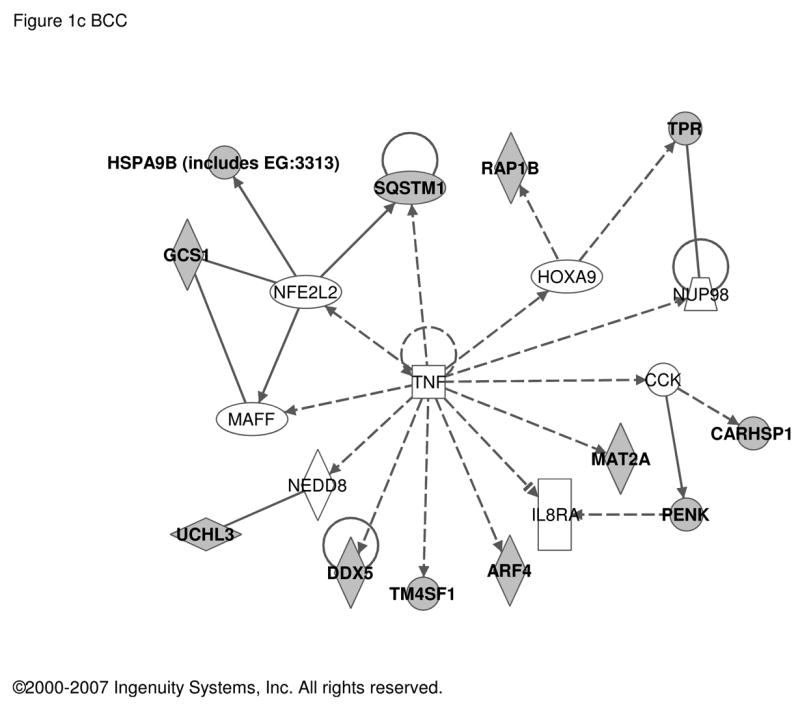
Transcripts with an abundance of two-fold or greater in PACAP-treated (6 h) compared to vehicle-treated bovine chromaffin cells by two-color microarray analysis (187 transcripts; see Supplementary Table S2) were used as the input for analysis of potential networks using the signal transduction knowledge environment of Ingenuity (http://www.ingenuity.com). a. Network solely involving 35 PACAP-regulated transcripts. b. Network involving 16 PACAP-regulated transcripts and 12 additional components with Ingenuity-confirmed direct or indirect links to them. c. Network involving 12 PACAP-regulated transcripts and 8 additional components with Ingenuity-confirmed direct or indirect links to them. PACAP-regulated transcripts are depicted in gray and linked components in white. Circular lines above symbols indicate auto-regulation; connecting lines without arrows indicate direct protein interaction deduced from either yeast two-hybrid, enzymatic, or immunoprecipitation assays; dashed and solid arrows indicate indirect (e.g. regulation of mRNA levels) and direct (e.g. enzymatic) activation, and lines ending in orthogonal dash indicate inhibition. Symbols and notations used by the Ingenuity Pathway Assistant in assembling of the networks shown in this and subsequent figures are as follows. The node shapes denote enzymes (
 ) , phosphatases (
 ) , kinases (
 ) , peptidases (
 ) , G-protein coupled receptor (
 ) , transmembrane receptor (
 ) , cytokines (
 ) , growth factor (
 ) , ion channel (
 ) , transporter (
 ) , translation factor (
 ) , nuclear receptor (
 ) , transcription factor (
 ) , and other (
 ).The edge labels (when included) are represented as follows: A, activation, deactivation; B, binding; E, expression; I, inhibition; L, proteolysis; M, biochemical modification; O, other; P, phosphorylation, dephosphorylation; T, transcription. Edge types include solid lines, direct interactions; dotted lines, indirect interactions; lines without arrows, binding only; arrows, factor acting upon factor nearest to arrowhead; lines terminating in short orthogonal line, inhibition of factor closest to orthogonal line; lines terminating in a combination of the last two edge types, both action upon and inhibition of factor closest to arrowhead. All gene products are defined in the glossary in Supplementary Table S5, which includes active links to Entrez Gene for each component.
3.2. Meta-analysis of transcripts regulated by PACAP in PC12 cells
Transcriptome changes in PC12 cells treated with PACAP presumably represent both regulation at the level of differentiation from a dividing cell to a growth-arrested one and stimulus-secretion-synthesis coupling during physiological activation of the adrenomedullary synapse under conditions of metabolic, psychogenic, or thermoregulatory stress. Consequently, we derived a composite set of regulated transcripts representing the ‘transitional transcriptomes’ for both development and mature functioning of the adrenal gland, by combining immediate-early response, differentiation response, and differentiated response periods of PACAP exposure (0–6, 6 and >24 hours of exposure) for comparison to the MAG and BCC data sets. Using our previous comprehensive analysis at these time points (for 0–6 h, a ‘CHX superinduction’ paradigm was used) yielded the data shown in Table S3. Ingenuity analysis suggests that TNFα- (Figure 2a) and TGFβ-like (Figure 2b) patterns of gene induction were also noted for the PACAP transcriptome of PC12 cells, linking the transcript set regulated by PACAP in fully differentiated chromaffin cells to a set of genes regulated by PACAP in PC12 cells (Figure 2).
Figure 2. Regulatory networks for PACAP-dependent transcripts in PC12 cells.
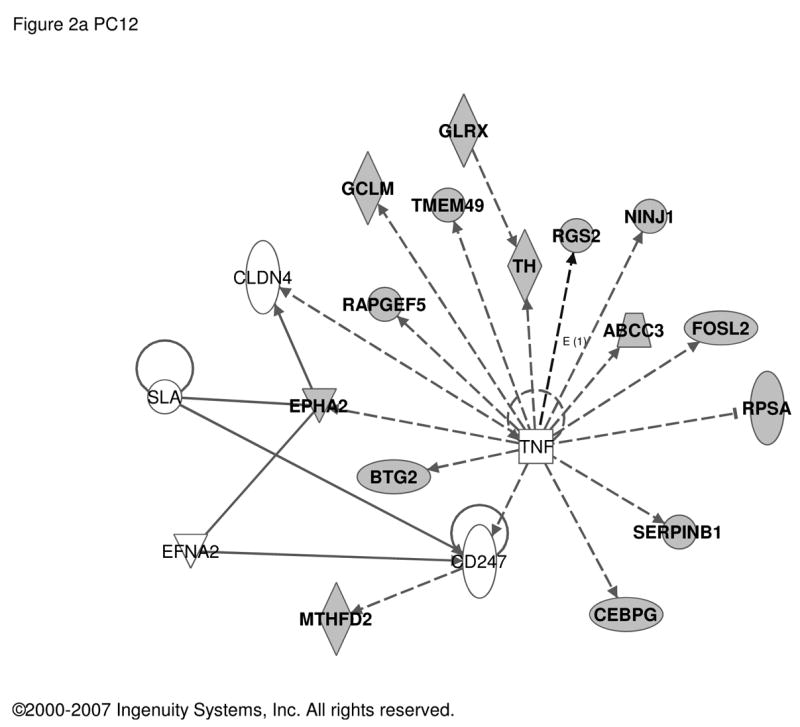
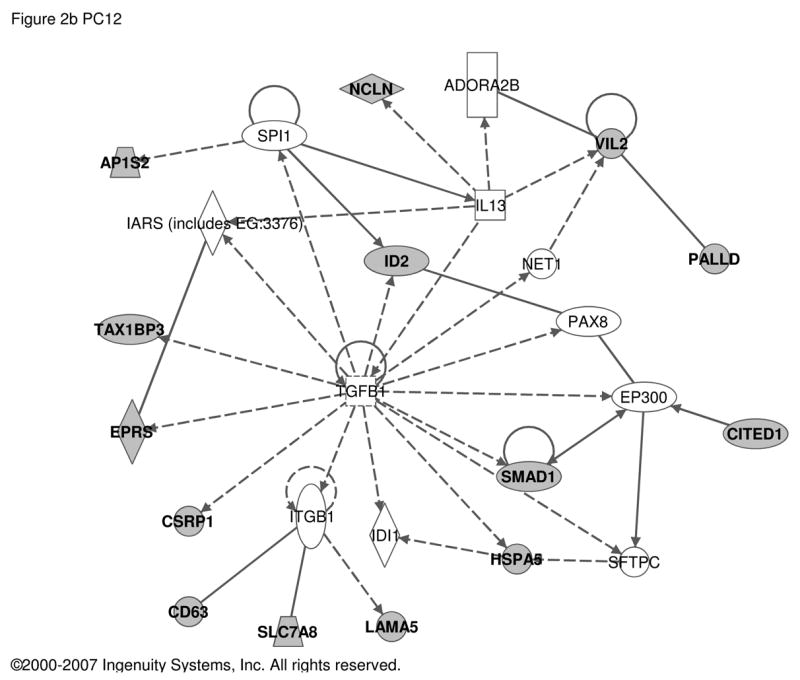
Transcripts with an abundance two-fold or greater in PACAP-treated PC12 cells at 0 to 6 h (deduced from cycloheximide superinduction at 6 h), 6 h, or 48 h (168 transcripts; see Supplementary Table S3 and references [28, 45, 57] respectively) were used as the input for analysis of regulatory networks using Ingenuity as described in Figure 1. a. Network involving 15 PACAP-regulated transcripts and 5 additional components with Ingenuity-confirmed direct or indirect links. b. Network involving 14 PACAP-regulated transcripts and 11 additional components with Ingenuity-confirmed direct or indirect links. Symbols and abbreviations are as described in Figure 1 and Supplementary Table S5.
3.3. Meta-analysis of transcripts regulated by PACAP following middle cerebral artery occlusion
PACAP is neuroprotective in stroke [46, 47], and the pathogenic and neurological sequelae of stroke are exacerbated in PACAP-deficient mice [14, 15, 41]. PACAP-dependent CNS genes defined in the context of response to ischemic injury (MCAO) were reported previously [15], and were re-analyzed here (Table S4) using Ingenuity (Figure 3). In CNS, PACAP-responsive transcripts appear to link PACAP signaling to both the immediate-early transcription factor Jun, and to the GSK-regulated signal transduction factor for transcription, beta-catenin.
Figure 3. Regulatory networks for PACAP-dependent transcripts in middle cerebral artery occlusion (MCAO).
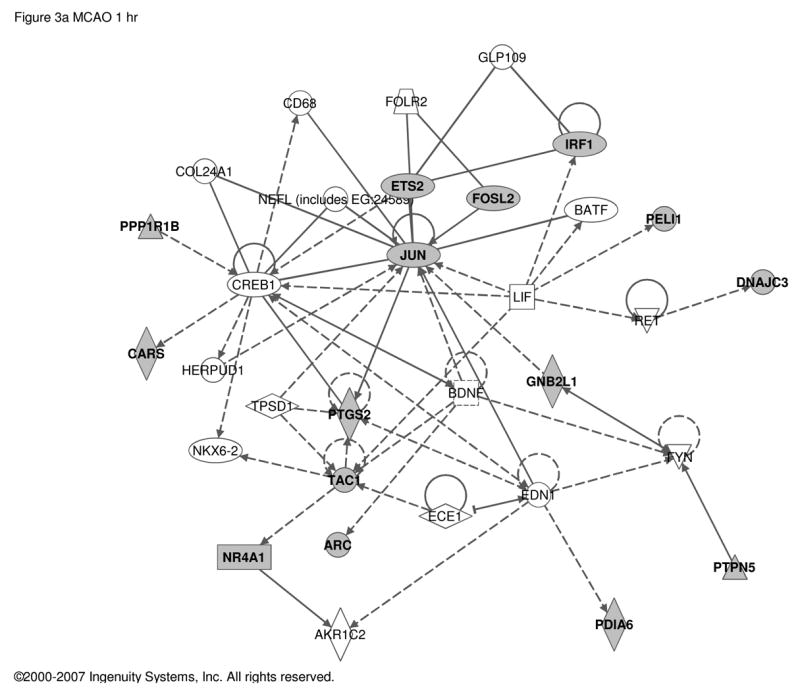
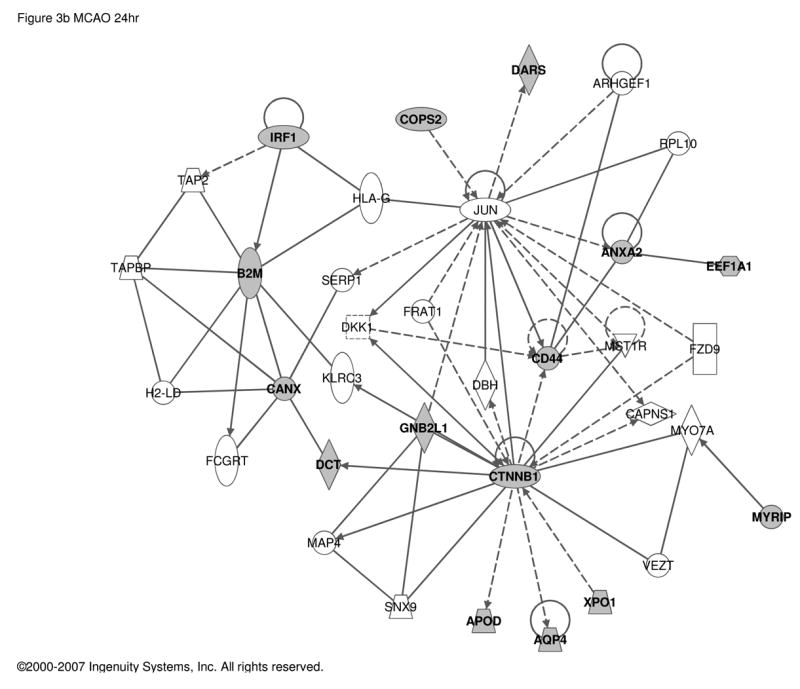
Up-regulated transcripts in wild-type compared to PACAP-deficient mice a. 1 h and b. 24 h after MCAO. 64 and 74 transcripts respectively (see Supplementary Table S4 and reference [15]) were used as the input for analysis of regulatory networks using Ingenuity as described in Figure 1. a. Network involving 15 PACAP-regulated transcripts and 17 additional components with Ingenuity-confirmed direct or indirect links. b. Network involving 15 PACAP-regulated transcripts and 20 additional components with Ingenuity-confirmed direct or indirect links. Symbols and abbreviations are as described in Figure 1 and Supplementary Table S5.
3.4. Composite transcriptome changes in MAG, BCC, PC12, and MCAO paradigms of PACAP gene regulation
A final analysis of common PACAP-responsive genes in MAG, BCC, PC12 cells, and the MCAO model yielded 26 transcripts regulated in the PC12 anchor set and at least one other (MAG, BCC, MCAO) (Table 2). Ingenuity analysis of this set (Figure 4) reveals a high density of PACAP-regulated genes that are also targets of TNFα and TGFβ, supporting the suggestion that PACAP may use NFκB and Smad pathways, in addition to its established signaling through cAMP, calcium and phospholipase C, in a wide variety of physiological responses and during development.
Table 2.
PACAP-dependent Transcripts in PC12 Cells and MAG, BCC or MCAO.
| GeneID | Gene Name | Gene Symbol | PC12 | MAG | BCC | MCAO |
|---|---|---|---|---|---|---|
| 12306 | Annexin A2 | Anxa2 | ||||
| 71994 | Calponin 3, acidic | Cnn3 | ||||
| 13205 | DEAD/H (Asp-Glu-Ala-Asp/His) box polypeptide 3, X-linked | Ddx3x | ||||
| 11789 | Adenomatosis polyposis coli | Apc | ||||
| 12227 | B-cell translocation gene 2, anti- proliferative | Btg2 | ||||
| 67579 | Cytoplasmic polyadenylation element binding protein 4 | Cpeb4 | ||||
| 20321 | Ferric-chelate reductase 1 | Frrs1 | ||||
| 52118 | Poliovirus receptor | Pvr | ||||
| 83486 | RNA binding motif protein 5 | Rbm5 | ||||
| 19735 | Regulator of G-protein signaling 2 | Rgs2 | ||||
| 29871 | Sex comb on midleg homolog 1 | Scmh1 | ||||
| 11843 | ADP-ribosylation factor 4 | Arf4 | ||||
| 54375 | Antizyme inhibitor 1 | Azin1 | ||||
| 12653 | Chromogranin B | Chgb | ||||
| 239528 | Eukaryotic translation initiation factor 2C, 2 | Eif2c2 | ||||
| 13684 | Eukaryotic translation initiation factor 4E | Eif4e | ||||
| 107508 | Glutamyl-prolyl-tRNA synthetase | Eprs | ||||
| 319448 | Fibronectin type III domain containing 3a | Fndc3a | ||||
| 18148 | Nucleophosmin 1 | Npm1 | ||||
| 20848 | Signal transducer and activator of transcription 3 | Stat3 | ||||
| 326618 | Tropomyosin 4 | Tpm4 | ||||
| 50770 | ATPase, class VI, type 11A | Atp11a | ||||
| 12512 | Cd63 antigen | Cd63 | ||||
| 14284 | Fos-like antigen 2 | Fosl2 | ||||
| 15937 | Immediate early response 3 | Ier3 | ||||
| 75909 | Transmembrane protein 49 | Tmem49 |
PACAP-responsive transcripts identified in the six data sets described in Table 1 and Tables S1-S4 and regulated in both the anchor set (PC12 cells; Table S4) and at least one other (mouse adrenal gland, MAG; bovine chromaffin cells, BCC; mouse middle cerebral artery occlusion model, MCAO) are depicted . Filled square, transcript elevated at least 2-fold; empty square, transcript not significantly elevated.
Figure 4. Regulatory networks for PACAP-dependent transcripts in PC12 cells and MAG, BCC or MCAO.
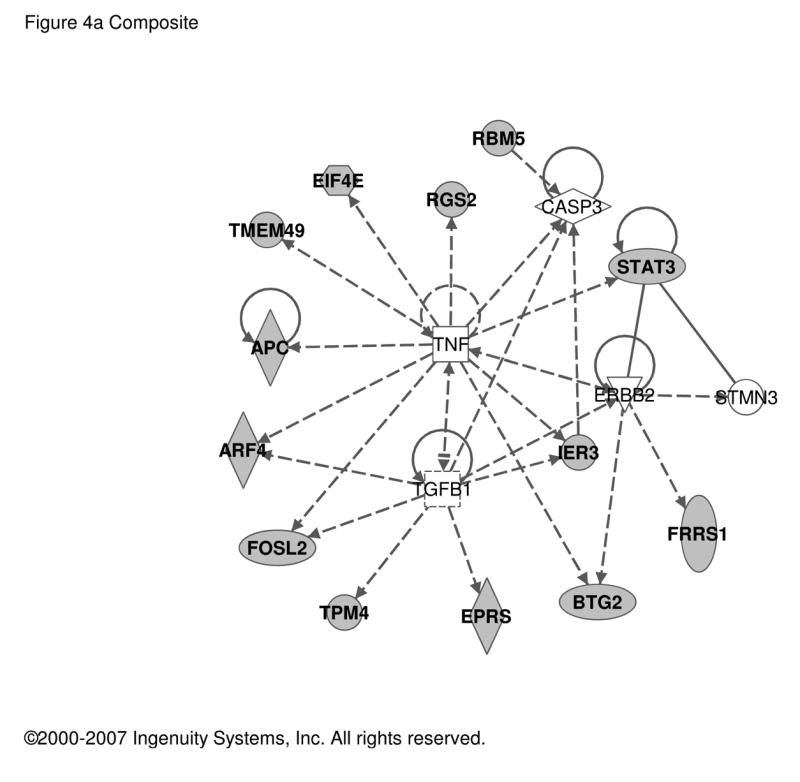
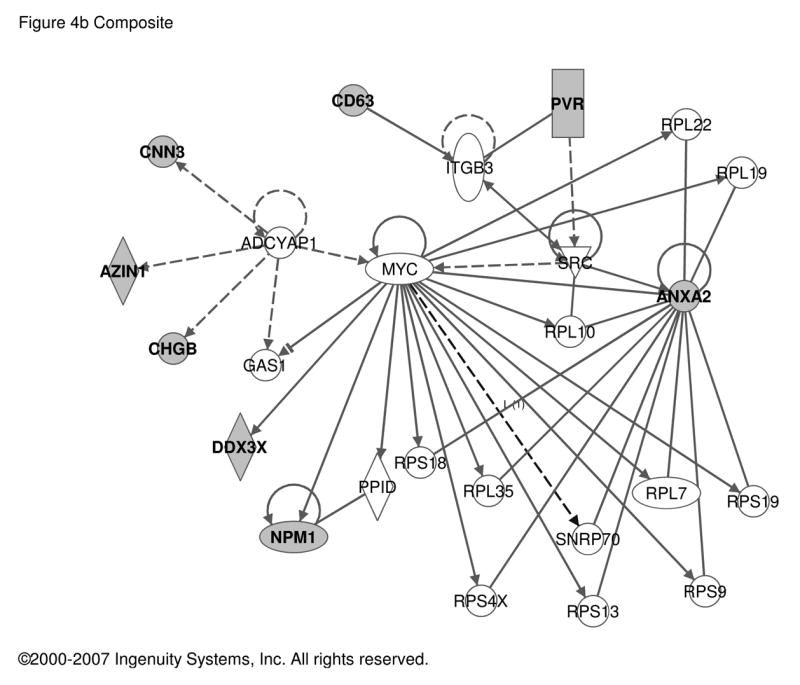
PACAP-regulated transcripts common to PC12 cells and either MAG, BCC or cerebral cortex in MCAO as listed in Table 2 were used as input for analysis of regulatory networks using Ingenuity as described in Figure 1. a. Network involving 13 PACAP-regulated transcripts and 5 additional components with Ingenuity-confirmed direct or indirect links. b. Network involving 8 PACAP-regulated transcripts and 17 additional components with Ingenuity-confirmed direct or indirect links. Symbols and abbreviations are as described in Figure 1 and Supplementary Table S5.
Meta-analysis, whose final results are shown in Table 2 and Figure 4, has revealed several key points about PACAP-responsive genes mobilized for adrenomedullary function in peripheral nervous system (PNS) and for neuroprotection in central nervous system (CNS). First, there appears to be three distinct types of gene regulation of PACAP-responsive transcripts in PC12 cells that correspond most closely to developmental (wild-type versus PACAP-deficient MAG), physiological (PACAP-stimulated chromaffin cells) and pathophysiological (mouse MCAO) roles for PACAP. Of immediate interest is the finding that of the 26 PACAP-regulated transcripts that span these arenas of PACAP action, at least four encode translational regulators, and these fall into two categories. Cpeb4 expression in quiescent MAG appears to require PACAP, i.e. is related to ‘basal’ or developmental actions of PACAP. Eif2c2, Eif4e and Eprs expression are enhanced by PACAP in mature BCCs, and might therefore be regulatory loci for slow transmitter function related to cell plasticity. Transcripts up-regulated by PACAP in PC12 cells are largely those that require endogenous PACAP for full expression in adrenal gland in vivo or are induced by PACAP in bovine chromaffin cells. The lack of overlap between PC12 composite transcripts which are also decreased in PACAP-deficient MAG, and up-regulated by PACAP in BCCs suggests that the neurotrophic and neurotransmitter roles of PACAP are largely distinct. Genes regulated pathophysiologically, e.g. in MCAO, appear to be a third category of PACAP-responsive genes also up-regulated by PACAP in PC12 cells. The abundance of the previously reported PACAP-responsive transcript Ier3 (a.k.a. PACAP-regulated gene-1, or PRG-1) [51] is increased in both PC12 cells upon PACAP exposure [57], and in a PACAP-dependent manner after MCAO [15], but is not dependent on PACAP in the unstimulated MAG, or in BCCs treated with PACAP (Table 2). It will be of interest to determine if other adrenomedullary stimuli, such as metabolic or psychogenic stress, elicit a PACAP-dependent activation of Ier3 or related immediate-early genes as occurs in pathophysiological conditions, such as ischemia, in the brain. Anxa2 was the single transcript found up-regulated by PACAP in all paradigms examined here. Anxa2 is required for generation of plasmin during NGF-initiated neuritogenesis in PC12 cells [32]. The role of the plasminogen activator system in both catecholamine secretion [50] and ischemia [35] may link PACAP function to this transcriptional target in these diverse physiological contexts.
Second, overlap of transcriptional targets of TNFα and TGFβ, and PACAP, suggests alternative modes of transcriptional signaling for PACAP in addition to cAMP, i.e. NFκB and Smad. TGFβ-like signaling initiated by PACAP, i.e. proceeding through Smad transactivation, has not been explored. However, the VIP gene, a major target of PACAP signaling in vivo and in BCCs and neuroblastoma cells, contains responsive elements for Smads and is stimulated by TGFβ in NBFL neuroblastoma cells [44]. With respect to TNFα-like signaling by PACAP, it is clear that TNFα itself can activate several genes in common with PACAP in chromaffin cells via activation of the TNFα type 2 receptor, including secretogranin II and galanin [1]. It will be worthwhile to explore whether this signaling also proceeds through NFκB following elevation in intracellular calcium, as suggested for cerebellar neurons [36].
Third, we have noticed that at least four of the 26 PACAP-dependent transcripts listed in Table 2 are also known to be targets for the transcription factor C/EBP in various cell types including PC12 cells. These include Btg2, involved in PC12 cell differentiation by NGF; Ier3, a regulator of apoptosis whose human homolog is called Dif-2; Rgs2, which is highly up-regulated by PACAP in PC12 cells; and APC, like Btg2 important in PC12 cell differentiation by NGF [12, 17, 18, 43, 55]. Thus C/EBP, in addition to CREB, may be a trans-activator for PACAP signaling in neuroendocrine cells.
In summary, meta-analysis suggests that PACAP might share signaling pathways with TNFα and TGFβ. In addition, it may utilize a converging trans-activator, C/EBP in addition to its known activation of MAP kinases, PKA, calcineurin, PKA, and CREB, to exert its pleiotropic effects on neuronal differentiation and slow transmission.
Supplementary Material
Entrez GeneID, Gene Symbol, Gene Description and Fold Change. The Fold Change is the linear SAM mean value for the red:green ratio (wild-type:PACAP-deficient) for the 228 transcripts up-regulated in wild-type versus PACAP-deficient mouse adrenal gland.
Entrez GeneID, Gene Symbol, Gene Description and Fold Change. The Fold Change is the linear SAM mean value for the red:green ratio (PACAP-treated BCC:vehicle-treated BCC) for the 187 transcripts up-regulated in PACAP-treated versus vehicle- treated BCCs.
Entrez GeneID, Gene Description, Gene Symbol for the 168 transcripts previously reported to be up-regulated in either 6-h cycloheximide plus PACAP-treated PC12 cells but not by PACAP alone during this time period (PC12—0 to 6 h: see [45]), or in PC12 cells treated with PACAP at 6 h versus untreated cells (PC12—6 h: see [57]), or in PC12 cells treated with PACAP for 48 hours (PC12—48 h: see [28] Filled cells: up-regulation of this transcript under the given condition; unfilled cells-no up-regulation of this transcript under the given condition.
Entrez Gene ID, Gene Symbol, Gene Description of transcripts up-regulated in wild-type but not in PACAP-deficient mouse cortex 1 h or 24 h following MCAO (see [15]).
Gene Symbol, Synonyms, Gene Description, Encoded Protein Location, Protein Family, and Human, Mouse and Rat GeneIDs for the 212 components of Figures 1–4.
Acknowledgments
This work was supported by the NIMH Intramural Research Program. The authors gratefully acknowledge the assistance of Dr. Yun Chen with initial chromaffin cell and adrenal gland microarray experiments. Dr. John Powell and Esther Asaki of CIT’s mAdb are thanked for their bioinformatic support of this project and of the NHGRI-NIMH-NINDS Microarray Core Facility on the NIH campus. We are thankful to Kathleen Meyer for help in submitting the datasets to GEO.
Abbreviations used
- ACh
acetylcholine
- BCC
bovine chromaffin cells
- BDNF
brain-derived neurotrophic factor
- BMAP1/2
Brain Molecular Anatomy Project clone sets 1 and 2
- BMPR2
bone morphogenic protein receptor, type II (serine/threonine kinase)
- Btg2
B-cell translocation gene 2, anti-proliferative
- cAMP
3'-5'-cyclic adenosine monophosphate
- cDNA
complementary DNA (deoxyribonucleic acid)
- CHX
cycloheximide
- CNS
central nervous system
- DNA
deoxyribonucleic acid
- ERK
Extracellular signal-regulated protein kinase
- EST
expressed sequence tag
- FDR
false discovery rate
- GIPO
gene in position order
- GSK
glycogen synthase kinase
- HUGO
Human Genome Organisation
- Jarid1c
jumonji, AT rich interactive domain 1C
- mAdb
microArray database
- MAG
mouse adrenal gland
- MAPK
Mitogen-activated protein kinase
- MCAO
middle cerebral artery occlusion
- mRNA
messenger ribonucleic acid
- NFκB
nuclear factor of kappa light chain gene enhancer in B-cells 1, p105
- NHGRI
National Human Genome Research Insitute
- NIA
National Institute on Aging
- NIH
National Institutes of Health
- NIMH
National Institute of Mental Health
- NINDS
National Institute of Neurological Disorders and Stroke
- NPY
neuropeptide tyrosine
- OMIM
Online Mendelian Inheritance in Man
- PACAP
pituitary adenylate cyclase-activating polypeptide
- PBS
phosphate-buffered saline
- PC12
rat pheochromocytoma cells
portable document format
- PNMT
phenylethanolamine N-methyltransferase
- PNS
peripheral nervous system
- RNA
ribonucleic acid
- SAM
Significance Analysis of Microarrays
- SCMH1
sex comb on midleg homolog 1
- Smad
MAD homolog 1
- SSH
suppression subtractive hybridization
- STAT
signal transducer and activator of transcription
- TFGβ
transforming growth factor, beta 1
- TH
tyrosine hydroxylase
- TNFα
tumor necrosis factor, alpha
- VIP
vasoactive intestinal polypeptide
- YWHAZ
tyrosine 3-monooxygenase/tryptophan 5-monooxygenase activation protein, zeta polypeptide
Footnotes
Publisher's Disclaimer: This is a PDF file of an unedited manuscript that has been accepted for publication. As a service to our customers we are providing this early version of the manuscript. The manuscript will undergo copyediting, typesetting, and review of the resulting proof before it is published in its final citable form. Please note that during the production process errors may be discovered which could affect the content, and all legal disclaimers that apply to the journal pertain.
Note: Abbreviations for molecules in the Abbreviation Table above obtained from http://www.ihop-net.org/UniPub/iHOP/. Supplementary Table S5 is a glossary for all additional abbreviations found in Figures 1–4.
References
- 1.Ait-Ali D, Turquier V, Grumolato L, Yon L, Jourdain M, Alexandre D, Eiden LE, Vaudry H, Anouar Y. The proinflammatory cytokines tumor necrosis factor-alpha and interleukin-1 stimulate neuropeptide gene transcription and secretion in adrenochromaffin cells via activation of extracellularly regulated kinase 1/2 and p38 protein kinases, and activator protein-1 transcription factors. Mol Endocrinol. 2004;18(7):1721–1739. doi: 10.1210/me.2003-0129. [DOI] [PubMed] [Google Scholar]
- 2.Anouar Y, Eiden LE. Rapid and long-lasting increase in galanin mRNA levels in rat adrenal medulla following insulin-induced reflex splanchnic nerve stimulation. Neuroendocrinology. 1995;62(6):611–618. doi: 10.1159/000127057. [DOI] [PubMed] [Google Scholar]
- 3.Arimura A. Perspectives on pituitary adenylate cyclase activating polypeptide (PACAP) in the neuroendocrine, endocrine, and nervous systems. Jap J Physiol. 1998;48:301–331. doi: 10.2170/jjphysiol.48.301. [DOI] [PubMed] [Google Scholar]
- 4.Arimura A, Shioda S. Pituitary adenylate cyclase activating polypeptide (PACAP) and its receptors: neuroendocrine and endocrine interaction. Front Neuroendocrinol. 1995;16(1):53–88. doi: 10.1006/frne.1995.1003. [DOI] [PubMed] [Google Scholar]
- 5.Babinski K, Bodart V, Roy M, De Léan A, Ong H. Pituitary adenylate-cyclase activating polypeptide (PACAP) evokes long-lasting secretion and de novo biosynthesis of bovine adrenal medullary neuropeptides. Neuropeptides. 1996;30:572–582. doi: 10.1016/s0143-4179(96)90041-4. [DOI] [PubMed] [Google Scholar]
- 6.Barnhart DC, Sarosi GA, Jr, Mulholland MW. PACAP-38 causes phospholipase C-dependent calcium signaling in rat acinar cell line. Surgery. 1997;122:465–475. doi: 10.1016/s0039-6060(97)90040-4. [DOI] [PubMed] [Google Scholar]
- 7.Barrie AP, Clohessy AM, Buensuceso CS, Rogers MV, Allen JM. Pituitary adenylyl cyclase-activating peptide stimulates extracellular signal-regulated kinase 1 or 2 (ERK1/2) activity in a ras-independent, mitogen-activated protein kinase/ERK kinase 1 or 2-dependent manner in PC12 cells. J Biol Chem. 1997;272:19666–19671. doi: 10.1074/jbc.272.32.19666. [DOI] [PubMed] [Google Scholar]
- 8.Braas KM, May V. Pituitary adenylate cyclase-activating polypeptides directly stimulate sympathetic neuron neuropeptide Y release through PAC(1) receptor isoform activation of specific intracellular signaling pathways. J Biol Chem. 1999;274(39):27702–10. doi: 10.1074/jbc.274.39.27702. [DOI] [PubMed] [Google Scholar]
- 9.Brabet P, Jamen F, Rodriguez-Henche N, Bertrand G, Bockaert J. PACAP receptor knockout and transgenics. What have we learnt? In: Vaudry H, Arimura A, editors. Pituitary Adenylate Cyclase-Activating Polypeptide. Kluwer Academic Publishers; Norwell, MA: 2003. pp. 323–346. [Google Scholar]
- 10.Brandish PE, Su M, Holder DJ, Hodor P, Szumiloski J, Kleinhanz RR, Forbes JE, McWhorter ME, Duenwald SJ, Parrish ML, Na S, Liu Y, Phillips RL, Renger JJ, Sankaranarayanan, Simon AJ, Scolnick EM. Regulation of gene expression by lithium and depletion of inositol in slices of adult rat cortex. Neuron. 2005;45:861–872. doi: 10.1016/j.neuron.2005.02.006. [DOI] [PubMed] [Google Scholar]
- 11.Calvano SE, Xiao W, Richards DR, Felciano RM, Baker HV, Cho RJ, Chen RO, Brownstein BH, Cobb JP, Tschoeke SK, Miller-Graziano C, Moldawer LL, Mindrinos MN, Davis RW, Tompkins RG, Lowry SF. A network-based analysis of systemic inflammation in humans. Nature. 2005;437(7061):1032–1037. doi: 10.1038/nature03985. [DOI] [PubMed] [Google Scholar]
- 12.Cammenga J, Mulloy JC, Berguido FJ, MacGrogan D, Viale A, Nimer SD. Induction of C/EBPalpha activity alters gene expression and differentiation of human CD34+ cells. Blood. 2003;101(6):2206–2214. doi: 10.1182/blood-2002-05-1546. [DOI] [PubMed] [Google Scholar]
- 13.Campard PK, Crochemore C, René F, Koch B, Loefflet JP. PACAP type I receptor activation promotes cerebellar neuron survival through the cAMP/PKA signaling pathway. DNA Cell Biol. 1997;16:323–333. doi: 10.1089/dna.1997.16.323. [DOI] [PubMed] [Google Scholar]
- 14.Chen Y, Hamelink C, Vaudry D, Xiang C, Brownstein M, Chen Y, Hallenbeck J, Eiden LE. Expression profiling of cerebrocortical transcripts during middle cerebral artery occlusion and treatment with pituitary adenylate cyclase-activating polypeptide (PACAP) in the mouse. In: Krieglstein J, Klumpp S, editors. Pharmacology of cerebral ischemia. Medpharm Scientific Publishers Stuttgart; Stuttgart, Germany: 2004. pp. 267–277. [Google Scholar]
- 15.Chen Y, Samal B, Hamelink CR, Xiang CC, Chen Y, Chen M, Vaudry D, Brownstein MJ, Hallenbeck JM, Eiden LE. Neuroprotection by endogenous and exogenous PACAP following stroke. Regul Pept. 2006;137(1–2):4–19. doi: 10.1016/j.regpep.2006.06.016. [DOI] [PMC free article] [PubMed] [Google Scholar]
- 16.Dickinson T, Fleetwood-Walker SM. VIP and PACAP: very important in pain? TIPS. 1999;20:324–329. doi: 10.1016/s0165-6147(99)01340-1. [DOI] [PubMed] [Google Scholar]
- 17.Dobashi Y, Katayama K, Kawai M, Akiyama T, Kameya T. APC protein is required for initiation of neuronal differentiation in rat pheochromocytoma PC12 cells. Biochem Biophys Res Commun. 2000;279(2):685–691. doi: 10.1006/bbrc.2000.4015. [DOI] [PubMed] [Google Scholar]
- 18.el-Ghissassi F, Valsesia-Wittmann S, Falette N, Duriez C, Walden PD, Puisieux A. BTG2(TIS21/PC3) induces neuronal differentiation and prevents apoptosis of terminally differentiated PC12 cells. Oncogene. 2002;21(44):6772–6778. doi: 10.1038/sj.onc.1205888. [DOI] [PubMed] [Google Scholar]
- 19.Feng XH, Derynck R. Specificity and versatility in tgf-beta signaling through Smads. Annu Rev Cell Dev Biol. 2005;21:659–693. doi: 10.1146/annurev.cellbio.21.022404.142018. [DOI] [PubMed] [Google Scholar]
- 20.Fischer-Colbrie R, Eskay RL, Eiden LE, Maas D. Transsynaptic regulation of galanin, neurotensin, and substance P in the adrenal medulla: combinatorial control by second-messenger signaling pathways. J Neurochem. 1992;59:780–783. doi: 10.1111/j.1471-4159.1992.tb09440.x. [DOI] [PubMed] [Google Scholar]
- 21.Fischer-Colbrie R, Gutierrez J, Hsu C-M, Iacangelo A, Eiden LE. Sequence analysis, tissue distribution and regulation by cell depolarization and second messengers of bovine secretogranin II (chromogranin C) messenger RNA. J Biol Chem. 1990;265:9208–9213. [PubMed] [Google Scholar]
- 22.Fischer-Colbrie R, Iacangelo A, Eiden LE. Neural and humoral factors separately regulate neuropeptide Y, enkephalin, and chromogranin A and B mRNA levels in rat adrenal medulla. Proc Natl Acad Sci USA. 1988;85:3240–3244. doi: 10.1073/pnas.85.9.3240. [DOI] [PMC free article] [PubMed] [Google Scholar]
- 23.Fischer-Colbrie R, Laslop A, Kirchmair R. Secretogranin II: molecular properties, regulation of biosynthesis and processing to the neuropeptide secretoneurin. Prog Neurobiol. 1995;46(1):49–70. doi: 10.1016/0301-0082(94)00060-u. [DOI] [PubMed] [Google Scholar]
- 24.Frechilla D, Garcia-Osta A, Palacios S, Cenarruzabeitia E, Del Rio J. BDNF mediates the neuroprotective effect of PACAP-38 on rat cortical neurons. Neuroreport. 2001;12(5):919–923. doi: 10.1097/00001756-200104170-00011. [DOI] [PubMed] [Google Scholar]
- 25.Frey BN, Andreazza AC, Cereser KM, Martins MR, Valvassori SS, Reus GZ, Quevedo J, Kapczinski F. Effects of mood stabilizers on hippocampus BDNF levels in an animal model of mania. Life Sci. 2006;79(3):281–6. doi: 10.1016/j.lfs.2006.01.002. [DOI] [PubMed] [Google Scholar]
- 26.Frödin M, Peraldi P, Van Obberghen E. Cyclic AMP activates the mitogen-activated protein kinase cascade in PC12 cells. J Biol Chem. 1994;269:6207–6214. [PubMed] [Google Scholar]
- 27.Grivennikov SI, Kuprash DV, Liu ZG, Nedospasov SA. Intracellular signals and events activated by cytokines of the tumor necrosis factor superfamily: From simple paradigms to complex mechanisms. Int Rev Cytol. 2006;252:129–61. doi: 10.1016/S0074-7696(06)52002-9. [DOI] [PubMed] [Google Scholar]
- 28.Grumolato L, Elkahloun AG, Ghzili H, Alexandre D, Coulouarn C, Yon L, Salier JP, Eiden LE, Fournier A, Vaudry H, Anouar Y. Microarray and suppression subtractive hybridization analyses of gene expression in pheochromocytoma cells reveal pleiotropic effects of pituitary adenylate cyclase-activating polypeptide on cell proliferation, survival, and adhesion. Endocrinology. 2003;144(6):2368–2379. doi: 10.1210/en.2002-0106. [DOI] [PubMed] [Google Scholar]
- 29.Hahm SH, Hsu C-M, Eiden LE. PACAP activates calcium influx-dependent and -independent pathways to couple met-enkephalin secretion and biosynthesis in chromaffin cells. J Mol Neurosci. 1998;11:1–15. doi: 10.1385/JMN:11:1:43. [DOI] [PubMed] [Google Scholar]
- 30.Hamelink C, Lee H-W, Grimaldi M, Eiden LE. Coincident elevation of cyclic AMP and calcium influx by PACAP-27 synergistically regulates VIP gene transcription through a novel PKA-independent signaling pathway. J Neurosci. 2002;22:5310–5320. doi: 10.1523/JNEUROSCI.22-13-05310.2002. [DOI] [PMC free article] [PubMed] [Google Scholar]
- 31.Hamelink C, Tjurmina O, Damadzic R, Young WS, Weihe E, Lee H-W, Eiden LE. Pituitary adenylate cyclase activating polypeptide is a sympathoadrenal neurotransmitter involved in catecholamine regulation and glucohomeostasis. Proc Natl Acad Sci USA. 2002;99:461–466. doi: 10.1073/pnas.012608999. [DOI] [PMC free article] [PubMed] [Google Scholar]
- 32.Jacovina AT, Zhong F, Khazanova E, Lev E, Deora AB, Hajjar KA. Neuritogenesis and the nerve growth factor-induced differentiation of PC-12 cells requires annexin II-mediated plasmin generation. J Biol Chem. 2001;276(52):49350–49358. doi: 10.1074/jbc.M106289200. [DOI] [PubMed] [Google Scholar]
- 33.Journot L, Waeber C, Pantaloni C, Holsboer F, Seeburg PH, Bockaert J, Spengler D. Differential signal transduction by six splice variants of the pituitary adenylate cyclase-activating peptide (PACAP) receptor. Biochem Soc T. 1995;23:133–137. doi: 10.1042/bst0230133. [DOI] [PubMed] [Google Scholar]
- 34.Lazarovici P, Jiang H, Fink D., Jr The 38-amino-acid form of pituitary adenylate cyclase-activating polypeptide induces neurite outgrowth in PC12 cells that is dependent on protein kinase C and extracellular signal-regulated kinase but not on protein kinase A, nerve growth factor receptor tyrosine kinase, p21ras G protein, and pp60c-src cytoplasmic tyrosine kinase. Mol Pharmacol. 1998;54:547–558. doi: 10.1124/mol.54.3.547. [DOI] [PubMed] [Google Scholar]
- 35.Liao H, Hyman MC, Lawrence DA, Pinsky DJ. Molecular regulation of the PAI-1 gene by hypoxia: contributions of Egr-1, HIF-1{alpha}, and C/EBP{alpha} Faseb J. 2006 doi: 10.1096/fj.06-6285com. [DOI] [PubMed] [Google Scholar]
- 36.Lilienbaum A, Israel A. From calcium to NF-kappa B signaling pathways in neurons. Mol Cell Biol. 2003;23(8):2680–2698. doi: 10.1128/MCB.23.8.2680-2698.2003. [DOI] [PMC free article] [PubMed] [Google Scholar]
- 37.Martinez-Fuentes AJ, Castano JP, Malagon MM, Vazquez-Marinez R, Gracia-Navarro F. Pituitary adenylate cyclase-activating polypeptides 38 and 27 increase cytosolic free Ca2+ concentration in porcine somatotropes through common and distinct mechanisms. Cell Calcium. 1998;23:369–378. doi: 10.1016/s0143-4160(98)90093-8. [DOI] [PubMed] [Google Scholar]
- 38.Miyata A, Arimura A, Dahl RR, Minamino N, Uehara A, Jiang L, Culler MD, Coy DH. Isolation of a novel 38 residue-hypothalamic polypeptide which stimulates adenylate cyclase in pituitary cells. Biochem Biophys Res Commun. 1989;164:567–574. doi: 10.1016/0006-291x(89)91757-9. [DOI] [PubMed] [Google Scholar]
- 39.Mustafa T, Eiden LE. The Secretin Superfamily: PACAP, VIP and Related Peptides. In: Lim R, editor. Handbook of Neurochemistry and Molecular Neurobiology: Neuroactive Peptides and Proteins. Springer; Heidelberg: 2006. pp. 1–36. [Google Scholar]
- 40.O'Farrell M, Marley PD. Multiple calcium channels are required for pituitary adenylate cyclase-activating polypeptide-induced catecholamine secretion from bovine cultured adrenal chromaffin cells. Naunyn Schmiedebergs Arch Pharmacol. 1997;356:536–542. doi: 10.1007/pl00005088. [DOI] [PubMed] [Google Scholar]
- 41.Ohtaki H, Nakamachi T, Dohi K, Aizawa Y, Takaki A, Hodoyama K, Yofu S, Hashimoto H, Shintani N, Baba A, Kopf M, Iwakura Y, Matsuda K, Arimura A, Shioda S. Pituitary adenylate cyclase-activating polypeptide (PACAP) decreases ischemic neuronal cell death in association with IL-6. Proc Natl Acad Sci USA. 2006;103(19):7488–7493. doi: 10.1073/pnas.0600375103. [DOI] [PMC free article] [PubMed] [Google Scholar]
- 42.Osipenko ON, Barrie AP, Allen JM, Gurney AM. Pituitary adenylyl cyclase-activating peptide activates multiple intracellular signaling pathways to regulate ion channels in PC12 cells. J Biol Chem. 2000;275:16626–16631. doi: 10.1074/jbc.M909636199. [DOI] [PubMed] [Google Scholar]
- 43.Pietzsch A, Buchler C, Schmitz G. Genomic organization, promoter cloning, and chromosomal localization of the Dif-2 gene. Biochem Biophys Res Commun. 1998;245(3):651–657. doi: 10.1006/bbrc.1998.8500. [DOI] [PubMed] [Google Scholar]
- 44.Pitts RL, Wang S, Jones EA, Symes AJ. Transforming growth factor-beta and ciliary neurotrophic factor synergistically induce vasoactive intestinal peptide gene expression through the cooperation of Smad, STAT, and AP-1 sites. J Biol Chem. 2001;276(23):19966–19973. doi: 10.1074/jbc.M011759200. [DOI] [PubMed] [Google Scholar]
- 45.Ravni A, Eiden LE, Vaudry H, Gonzalez BJ, Vaudry D. Cycloheximide treatment to identify components of the transitional transcriptome in PACAP-induced PC12 cell differentiation. J Neurochem. 2006;98:1229–1241. doi: 10.1111/j.1471-4159.2006.03962.x. [DOI] [PMC free article] [PubMed] [Google Scholar]
- 46.Reglödi D, Somogyvari-Vigh A, Vigh S, Kozicz T, Arimura A. Delayed systemic administration of PACAP38 is neuroprotective in transient middle cerebral artery occlusion in the rat. Stroke. 2000;31:1411–1417. doi: 10.1161/01.str.31.6.1411. [DOI] [PubMed] [Google Scholar]
- 47.Reglodi D, Tamas A, Somogyvari-Vigh A, Szanto Z, Kertes E, Lenard L, Arimura A, Lengvari I. Effects of pretreatment with PACAP on the infarct size and functional outcome in rat permanent focal cerebral ischemia. Peptides. 2002;23(12):2227–2234. doi: 10.1016/s0196-9781(02)00262-0. [DOI] [PubMed] [Google Scholar]
- 48.Said SI. VIP and PACAP in pain and inflammation. Trends Pharmacol Sci. 2000;21(2):57. doi: 10.1016/s0165-6147(99)01427-3. [DOI] [PubMed] [Google Scholar]
- 49.Schadlow VC, Barzilai N, Deutsch PJ. Regulation of gene expression in PC12 cells via an activator of dual second messengers: Pituitary adenylate cyclase activating polypeptide. Mol. Biol Cell. 1992;3:941–951. doi: 10.1091/mbc.3.8.941. [DOI] [PMC free article] [PubMed] [Google Scholar]
- 50.Schaefer U, Machida T, Vorlova S, Strickland S, Levi R. The plasminogen activator system modulates sympathetic nerve function. J Exp Med. 2006;203(9):2191–200. doi: 10.1084/jem.20060077. [DOI] [PMC free article] [PubMed] [Google Scholar]
- 51.Schafer H, Trauzold A, Siegel EG, Folsch UR, Schmidt WE. PRG1: a novel early-response gene transcriptionally induced by pituitary adenylate cyclase activating polypeptide in a pancreatic carcinoma cell line. Cancer Res. 1996;56(11):2641–2648. [PubMed] [Google Scholar]
- 52.Shintani N, Suetake S, Hashimoto H, Koga K, Kasai A, Kawaguchi C, Morita Y, Hirose M, Sakai Y, Tomimoto S, Matsuda T, Baba A. Neuroprotective action of endogenous PACAP in cultured rat cortical neurons. Regul Pept. 2005;126(1–2):123–128. doi: 10.1016/j.regpep.2004.08.014. [DOI] [PubMed] [Google Scholar]
- 53.Tanaka K, Shibuya I, Nagamoto T, Yamasha H, Kanno T. Pituitary adenylate cyclase-activating polypeptide causes rapid Ca2+ release from intracellular stores and long lasting Ca2+ influx mediated by Na+ influx-dependent membrane depolarization in bovine adrenal chromaffin cells. Endocrinol. 1996;137:956–966. doi: 10.1210/endo.137.3.8603609. [DOI] [PubMed] [Google Scholar]
- 54.Tanaka TS, Jaradat SA, Lim MK, Kargul GJ, Wang X, Grahovac MJ, Pantano S, Sano Y, Piao Y, Nagaraja R, Doi H, Wood WH, 3rd, Becker KG, Ko MS. Genome-wide expression profiling of mid-gestation placenta and embryo using a 15,000 mouse developmental cDNA microarray. Proc Natl Acad Sci USA. 2000;97(16):9127–9132. doi: 10.1073/pnas.97.16.9127. [DOI] [PMC free article] [PubMed] [Google Scholar]
- 55.Tavor S, Park DJ, Gery S, Vuong PT, Gombart AF, Koeffler HP. Restoration of C/EBPalpha expression in a BCR-ABL+ cell line induces terminal granulocytic differentiation. J Biol Chem. 2003;278(52):52651–52659. doi: 10.1074/jbc.M307077200. [DOI] [PubMed] [Google Scholar]
- 56.Tusher VG, Tibshirani R, Chu G. Significance analysis of microarrays applied to the ionizing radiation response. Proc Natl Acad Sci U S A. 2001;98(9):5116–21. doi: 10.1073/pnas.091062498. [DOI] [PMC free article] [PubMed] [Google Scholar]
- 57.Vaudry D, Chen Y, Ravni A, Hamelink C, Elkahloun AG, Eiden LE. Analysis of the PC12 cell transcriptome after differentiation with pituitary adenylate cyclase-activating polypeptide (PACAP) J Neurochem. 2002;83(6):1272–1284. doi: 10.1046/j.1471-4159.2002.01242.x. [DOI] [PMC free article] [PubMed] [Google Scholar]
- 58.Waschek JA. VIP and PACAP receptor-mediated actions on cell proliferation and survival. Ann NY Acad Sci. 1996;805:290–300. doi: 10.1111/j.1749-6632.1996.tb17491.x. [DOI] [PubMed] [Google Scholar]
- 59.Xiang CC, Kozhich OA, Chen M, Inman JM, Phan QN, Chen Y, Brownstein MJ. Amine-modified random primers to label probes for DNA microarrays. Nat Biotechnol. 2002;20(7):738–42. doi: 10.1038/nb0702-738. [DOI] [PubMed] [Google Scholar]
- 60.Yada T, Sakurada M, Nakata M, Yaekura K, Kikuchi M. PACAP as low as 10(-13) M raises cytosolic Ca2+ activity in pancreatic B-cells by augmenting Ca2+ influx through L-type Ca2+ channels to trigger insulin release. In: Soria, editor. Physiology and Pathophysiology of the Islets of Langerhans. Plenum Press; New York: 1997. pp. 165–171. [DOI] [PubMed] [Google Scholar]
- 61.Yaka R, He DY, Phamluong K, Ron D. Pituitary adenylate cyclase-activating polypeptide (PACAP(1–38)) enhances N-methyl-D-aspartate receptor function and brain-derived neurotrophic factor expression via RACK1. J Biol Chem. 2003;278(11):9630–8. doi: 10.1074/jbc.M209141200. [DOI] [PubMed] [Google Scholar]
- 62.Zhou CJ, Yada T, Kohno D, Kikuyama S, Suzuki R, Mizushima H, Shioda S. PACAP activates PKA, PKC and Ca(2+) signaling cascades in rat neuroepithelial cells. Peptides. 2001;22(7):1111–1117. doi: 10.1016/s0196-9781(01)00437-5. [DOI] [PubMed] [Google Scholar]
Associated Data
This section collects any data citations, data availability statements, or supplementary materials included in this article.
Supplementary Materials
Entrez GeneID, Gene Symbol, Gene Description and Fold Change. The Fold Change is the linear SAM mean value for the red:green ratio (wild-type:PACAP-deficient) for the 228 transcripts up-regulated in wild-type versus PACAP-deficient mouse adrenal gland.
Entrez GeneID, Gene Symbol, Gene Description and Fold Change. The Fold Change is the linear SAM mean value for the red:green ratio (PACAP-treated BCC:vehicle-treated BCC) for the 187 transcripts up-regulated in PACAP-treated versus vehicle- treated BCCs.
Entrez GeneID, Gene Description, Gene Symbol for the 168 transcripts previously reported to be up-regulated in either 6-h cycloheximide plus PACAP-treated PC12 cells but not by PACAP alone during this time period (PC12—0 to 6 h: see [45]), or in PC12 cells treated with PACAP at 6 h versus untreated cells (PC12—6 h: see [57]), or in PC12 cells treated with PACAP for 48 hours (PC12—48 h: see [28] Filled cells: up-regulation of this transcript under the given condition; unfilled cells-no up-regulation of this transcript under the given condition.
Entrez Gene ID, Gene Symbol, Gene Description of transcripts up-regulated in wild-type but not in PACAP-deficient mouse cortex 1 h or 24 h following MCAO (see [15]).
Gene Symbol, Synonyms, Gene Description, Encoded Protein Location, Protein Family, and Human, Mouse and Rat GeneIDs for the 212 components of Figures 1–4.