Abstract
The current study reports the facile design of quantum dot (QD)-conjugated lipids and their application to high-speed tracking experiments on cell surfaces. CdSe/ZnS core/shell QDs with two types of hydrophilic coatings, 2-(2-aminoethoxy)ethanol (AEE-coating) and a 60:40 molar mixture of 1,2-dipalmitoyl-sn-glycero-3-phosphocholine and 1,2-dipalmitoyl-sn-glycero-3-phosphoethanolamine-N-[methoxy(polyethyleneglycol-2000] (LIPO-coating), are conjugated to sulfhydryl lipids via maleimide reactive groups on the QD surface. Prior to lipid conjugation, the colloidal stability of both types of coated QDs in aqueous solution is confirmed using fluorescence correlation spectroscopy. A sensitive assay based on single lipid tracking experiments on a planar solid-supported phospholipid bilayer is presented that establishes conditions of monovalent conjugation of QDs to lipids. The QD lipids are then employed as single molecule tracking probes in plasma membranes of several cell types. Initial tracking experiments at a frame rate of 30 fps corroborate that QD-lipids diffuse like dye-labeled lipids in the plasma membrane of COS-7, HEK-293, 3T3, and NRK cells, thus confirming monovalent labeling. Finally, QD-lipids are applied for the first time to high-speed single molecule imaging by tracking their lateral mobility in the plasma membrane of NRK fibroblasts with up to 1000 fps. Our high-speed tracking data, which are in excellent agreement to previous tracking experiments with larger 40nm Au labels, not only push the time resolution in long-time, continuous fluorescence-based single molecule tracking, but also show that highly photostable, photoluminescent nanoprobes of 10nm size can be employed (AEE-coated QDs). These probes are also attractive because, unlike Au nanoparticles, they facilitate complex multicolor experiments.
Introduction
The present surge in life science is linked intimately to the development of new experimental tools that allow the study of biological processes at the molecular level. In particular, optical single molecule imaging techniques have emerged as powerful tools to detect heterogeneities below the diffraction limit of optical microscopy and to study dynamic processes in cellular systems at the single molecule level because these techniques enable individual molecules to be tracked with a spatial resolution of 20-30nm and a time resolution in the microsecond range. For example, single molecule imaging techniques have been instrumental in changing our view of plasma membranes from a featureless lipid bilayer with embedded membrane proteins1 to a complex, compartmentalized system exhibiting a wide variety of length scale-dependent dynamic processes.2 Interestingly, not only labeled membrane proteins, but also lipid-based single molecule tracking probes have emerged as powerful tools in the in-depth characterization of membrane heterogeneities.3,4 Traditionally, the detection of single biomolecules has been accomplished via conjugated colloidal gold or fluorescent latex spheres using nanovid microscopy and single-particle tracking.5-11 The main limitations of these traditional probes for single molecule imaging is their relatively large size (gold: 40-50nm, latex: 0.1-1μm), which considerably exceeds that of the biomolecules labeled, and the difficulty to avoid crosslinking of biomolecules. These limitations motivated the development of single molecule imaging using fluorescent dye labels. Single fluorophores were first successfully imaged at very low temperature using an intensified CCD camera.12 Diffusion studies of membrane constituents became possible after the time resolution of individual dye tracking was increased into the millisecond range.13 Although dyes overcome limitations of colloidal Au probes in terms of size and monovalent labeling of biomolecules, their application to single molecule tracking remains limited due to poor photostability, thus limiting the length of individual trajectories.
More recently, photoluminescent quantum dots have emerged as an attractive alternative for fluorescence-based imaging because they combine small size, brightness, high photostability, and broad absorption and narrow, size-tunable emission bands.14-16 In particular, the superior brightness and photostability make QDs powerful probes for the single molecule tracking with very high time/spatial resolution. Due to their unique absorbance and emission properties, QDs are also particularly beneficial for multi-color experiments because just one laser excitation wavelength is needed to excite QDs of different emission properties. To allow biological imaging applications, QDs need to be made water-soluble using hydrophilic surface coatings.17,18 Initially, this was achieved by replacing the coordinating solvent trioctylphosphine oxide (TOPO) with monothiols containing hydrophilic terminal moieties, such as 3-mercaptoproprionic acid (MPA) and mercaptoethanol (MEtOH).19-23 Although these coatings are very thin, they show limited stability.24 Therefore, several alternative coatings strategies have been developed, which are based on silanes forming a stable shell via crosslinking,16,25,26 peptides, 27 polyelectrolytes,28 polysaccharides,29 avidin,30 and QD-encapsulating amphiphilic molecules, such as hydrophilic polymers with hydrophobic side chains or mixtures of phospholipids and lipopolymers.31 The encapsulation with amphiphiles is interesting because the protecting coordinating solvent layer does not need to be replaced, thus preventing oxidative damage. Since their introduction as biological imaging probes in 1998,32,33 QDs have found widespread application in biological imaging at the in vitro and in vivo levels.14-16 Dahan and coworkers first successfully demonstrated that QDs are excellent imaging probes for single molecule tracking experiments.34 In their initial work, QDs were employed to study the lateral diffusion of glycine receptors and their entry into neuronal synapses. Meanwhile, QDs have been employed as single molecule tracking probes to analyze the lateral mobility of several membrane receptors, including EGF,35 GABA,36 and Kv2.1.37 In these applications, streptavidin-coated QDs were conjugated to either biotinylated membrane receptors or receptor ligands. Streptavidin or avidin coatings are attractive because they allow for the strong, specific binding of QDs to biotinylated biomolecules. Their disadvantages, however, are the relatively large coating thickness leading to probes sizes of more than 15nm and the difficulty to monovalently label biomolecules (each streptavidin or avidin molecules binds up to 4 biotins).
Here we report for the first time the successful monovalent conjugation of 2-(2-aminoethoxy)ethanol (AEE)- and phospholipid/lipopolymer (LIPO)-capped CdSe/ZnS quantum dots (QDs) to phospholipids and their application in lipid tracking experiments on the cell surface using high-speed single molecule fluorescence microscopy. The thicker LIPO coating was chosen because it is very stable and was already successfully applied in long-term cellular imaging studies.38 The thinner AEE coating was pursued because the overall probe size can be reduced and because a similar coating, which is based on short poly(ethylene oxide) chains of just two ethylene oxide segments, was shown to prevent the non-specific adsorption of proteins quite effectively.39 As reported recently, confocal fluorescence correlation spectroscopy (FCS) is employed to verify the colloidal stability of AEE- and LIPO-coated QDs and to determine their hydrodynamic radii.40 QD conjugation to lipids is achieved by incorporating a well-adjusted amount of maleimide-containing crosslinker molecules into the QD coatings and by reacting QDs with sulfhydryl lipids. To evaluate the inertness of the QD probes in the presence of a membrane and to confirm the monovalent labeling of QDs to lipids, the lateral diffusion of QD-conjugated lipids is first examined in a solid-supported phospholipid bilayer and compared to diffusion data obtained using dye-labeled lipids. QD lipids are then incorporated into plasma membranes of several cell types, including COS-7, HEK-293, 3T3, and NRK fibroblasts and their lateral diffusion behavior is examined using a frame rate of 30 fps. Finally, high-speed imaging experiments on NRK fibroblasts are presented, where QD-lipids are tracked with frame rates of up to 1000 fps. The results from these experiments are in very good agreement with previous single particle tracking data using notably larger colloidal Au probes. By pushing the time resolution in fluorescence-based wide-field single molecule imaging, we show that QD lipids are promising imaging probes in state-of-the-art high-speed single molecule tracking experiments on cell surfaces.
Experimental Section
Materials
Cadmium acetate and elemental selenium powder were purchased from Strem Chemicals (Newburyport, MA). Trioctylphosphine (TOP), trioctylphosphine oxide (TOPO), hexadecylamine (HDA), 3-mercaptopropionic acid (MPA), 2-(2-aminoethoxy)ethanol (AEE), di-tert-butyl dicarbonate (DiBOC), trifluoroacetic acid (TFA), zinc nitrate hexahydrate, potassium ethylxanthate and HPLC grade solvents were purchased from Aldrich Chemical (Milwaukee, WI). The heterobifunctional crosslinker reagent N-[p-maleimidophenyl]isocyanate (PMPI) and amide bond catalyst 1-ethyl-3-[3-dimethylaminopropyl]carbodiimide hydrochloride (EDC) were obtained from Pierce Biotechnology (Rockford, IL). The phospholipids 1-stearoyl-2-oleoyl-sn-glycero-3-phosphocholine (SOPC), 1,2-dipalmytoyl-sn-glycero-3-phosphocholine (DPPC), 1,2- dioleoyl-sn-glycero-3-phosphoethanolamine (DOPE), and 1,2-dipalmytoyl-sn-glycero-3-phsphothioethanol (DHPTE), as well as the lipopolymers 1,2-dipalmitoyl-sn-glycero-3-phosphoethanolamine-N-[methoxy(polyethylene glycol)-2000] (DPPEPEG2000) and 1,2-distearoyl-sn-glycero-3-phosphoethanolamine-N-[maleimide(polyethylene glycol)2000] (ammonium salt) (DSPE-PEG2000-MAL) were purchased from Avanti Polar Lipids (Alabaster, AL).The fluorescent lipid probe N-(6-tetramethylrhodaminethiocarbamoyl)-1,2-dihexadecanoyl-sn-glycero-3-phosphoethanolamine (TRITC-DHPE) was acquired from Invitrogen/Molecular Probes (Eugene, OR). Water utilized was purified using a Milli-Q Water Purification System (Millipore, Milford, MA).
Methodology
(a) Synthesis of CdSe/ZnS QDs
CdSe/ZnS core/shell QDs were synthesized using a facile sonochemical approach, as reported previously.40 In short, trioctylphosphine oxide (TOPO)-coated CdSe QDs were synthesized in a one pot synthesis using hexadecylamine (HDA), Cd(OAc)2, and TOPO. The ZnS shell was added using zinc ethyl xanthate. CdSe/ZnS core shell QDs synthesized using this procedure were found to show high crystallinity, quantum yields of 50-60%, narrow emission spectra (fwhm ∼25nm), and size distributions of ∼10%.40
(b)Formation of 2-(2-aminoethoxy)ethanol (AEE)-coated CdSe/Zn QDs
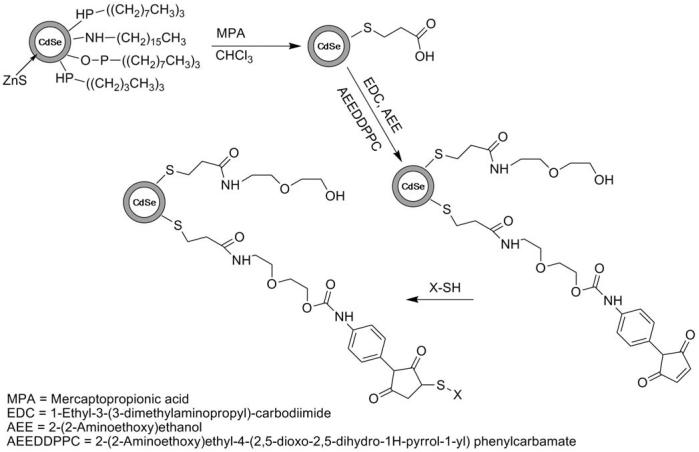
Reaction Scheme 1 illustrates the synthesis steps for the formation of AEE-coated CdSe/ZnS QDs. The weakly bound TOPO coating of TOPO-CdSe/ZnS QDs was first replaced with the more tightly binding mercaptopropionic acid (MPA). In a typical preparation, 0.5g of the crude, shelled sample was washed and precipitated 3x with a solution of 50/50 methanol/acetone and dissolved in 12ml of chloroform with 0.25g of MPA. The solution was stirred under Argon for 24 hours and centrifuged to separate out the hydrophilic nanocrystals. The nanocrystals were washed in hexane (3x) and dried under vacuum at room temperature. The dry product was then dispersed in water. The pH of the aqueous nanoparticle solution was then adjusted to pH6.5 and 30mg of 2-(2-aminoethoxy)ethanol (AEE) was added as the solution stirred in an ice bath. The amide bond formation between MPA and AEE was catalyzed by the addition of 10mg 1-Ethyl-3-[3-dimethylaminopropyl]carbodiimide hydrochloride (EDC). To facilitate the linkage to phospholipids, AEE was mixed with the heterobifunctional crosslinker 2-(2- aminoethoxy)ethyl 4-(2,5-dioxo-2,5-dihydro-1H-pyrrol-1-yl) phenylcarbamate (AEE to crosslinker molar mixing ratio, 100:1). Some control experiments were conducted using lower and higher molar crosslinker concentrations. To complete this reaction, the solution was stirred for 1 hour at 5°C. The solution was then centrifuged at 15000rpm and decanted to remove any excess AEE/crosslinker as well as any nanoparticle aggregates. The synthesis of the heterobifunctional crosslinker is described below.
Scheme 1.
Reaction scheme illustrating the synthesis steps for the design of AEE-coated QDs.
(c) Synthesis of Heterobifunctional Amine-Maleimide Crosslinker
First, the primary amine of AEE was protected with di-tert-butyl dicarbonate (DiBOC). Here 2.5 grams of AEE was dissolved in 30 ml of water with 2 equivalents (4.04g) of sodium bicarbonate. A second solution containing 5.19 grams of DiBOC dissolved in 10ml of dioxane was prepared and added to the AEE solution. The mixture stirred for 24 hours, under argon upon which time the protected AEE was extracted 3x with 25ml of ethyl acetate. The ethyl acetate solution was condensed to product via rotovap. The resulting protected AEE product was dissolved in dry chloroform and reacted with the heterobifunctional crosslinker N-[p-maleimidophenyl]isocyanate (PMPI) in a 1:2 ratio over 24 hours. After completion of the reaction, the chloroform was vacuumed off. To remove the DiBOC protecting group, the orange, oily product was dissolved in 10ml of a 5:1 dichloromethane (DCM):trifluoroacetic acid (TFA) solution and stirred for 2 hours. The DCM:TFA mixture was vacuumed off giving a dry product. As verified by NMR, this final product is the carboxyl and sulfhydryl reactive heterobifunctional crosslinker 2-(2-aminoethoxy)ethyl 4-(2,5-dioxo-2,5-dihydro-1H-pyrrol-1-yl) phenylcarbamate.
(d) Formation of Lipopolymer (LIPO) Encapsulated CdSe/Zn QDs
By adapting the coating procedure by Dubertet et al.,31 crude, shelled QDs were first washed and precipitated 3x with a solution of 50/50 methanol/acetone to remove any excess coordinating solvent. The hydrophobic TOPO-capped nanoparticles were then dispersed in chloroform containing 5.5×10⁻⁶ mol of 40mol% 1,2-dipalmitoyl-snglycero-3-phosphoethanolamine-N-[methoxy(polyethylene glycol)-2000] (DPPE-PEG2000), 59mol% 1,2-dipalmitoyl-sn-glycero-3-phosphocholine (DPPC), and 0.04mol% 1,2-distearoyl-sn-glycero-3-phosphoethanolamine-N-[maleimide(polyethylene glycol)2000] (ammonium salt) (DSPE-PEG2000-MAL). Some control experiments were also conducted using lower and higher DSPE-PEG2000-MAL molar concentrations. The chloroform was removed via evaporation and the residue was heated to 80°C before 1ml of distilled water was added, resulting in an optically transparent solution of LIPO-coated QDs.
(e) Formation of QD-Conjugated Lipids in Solid-Supported Phospholipid Bilayer
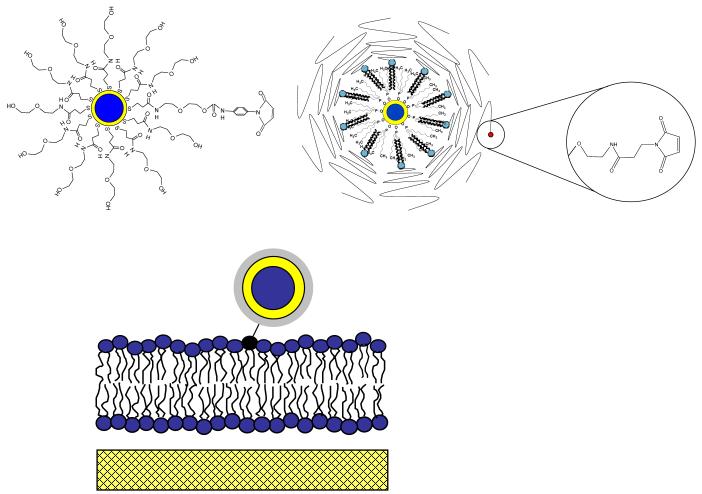
Solid-supported phospholipid bilayers were formed via successive Langmuir-Blodgett (LB) and Schaefer (LS) film transfer steps following standard procedures described before.41,42 Specifically, microscopy coverslips were cleaned by baking at 515°C for 1 hour followed by sonication for 30 min each in the following solutions: 1% SDS, methanol saturated with NaOH, and 0.1%HCl using a bath sonicator.42 After each washing step, the microscopy coverslips were rinsed in Milli-Q water. To form the first (LB) monolayer, a chloroform solution of 1-stearoyl-2-oleoyl-sn-glycero-3-phosphocholine (SOPC) was spread at the air-water interface of a film balance with dipper (Labcon, Darlington, UK). Prior to film transfer the lateral pressure of the SOPC monolayer was adjusted at 30mN/m. To form the second (LS) monolayer, a chloroform solution containing SOPC and 1,2-dipalmytoyl-sn-glycero-3-phsphothioethanol (DHPTE) 10-8 mol% was spread on the air-water interface and compressed to 30mN/m. In the case of dye experiments, DHPTE was replaced by the fluorescent N-(6-tetramethylrhodaminethiocarbamoyl)-1,2-dihexadecanoyl-sn-glycero-3-phosphoethanolamine (TRITCDHPE). After completion of the LB/LS transfer, the bilayer-containing cover glass was assembled as the bottom part of a cuvette with a glass cylinder perched atop it. In this open geometry, QD conjugation was achieved by adding maleimide-functionalized QDs to the cuvette and by rinsing of the excess (unbound) QDs. To achieve monovalent labeling of QDs to lipids, the maleimide surface concentration on AEE- and LIPO-coated QDs was systematically increased and their binding to a solid-supported SOPC bilayer containing 10-8mol% DHPTE was studied using wide-field single molecule fluorescence microscopy. For both the AEE and LIPO QDs, the required ratio of maleimide to inert surface molecules was determined to be 1:100. In addition, SOPC membranes containing no DHPTE were incubated with both maleimide-functionalized QD systems, and no specific binding was observed. Fig. 1 illustrates schematics of AEE- (top, left) and LIPO-coated (top, right) QD-conjugated lipids and the design of QD-conjugated lipids in a solid-supported bilayer (bottom).
Figure 1.
Schematic illustration of AEE- (top, left) and LIPO-coated QDs (top, right) and QD-conjugated lipids in a solid-supported phospholipid bilayer (bottom).
(f) Reconstitution of QD-lipids into Plasma Membranes
A vesicle fusion technique was used to incorporate QD-labeled lipids into living cell membranes. Small unilamellar vesicles (SUVs) were created in PBS buffer by a commonly used rod sonication technique, with the composition being a 3:1 ratio of SOPC:DOPE, as this mixture is known to be fusogenic with the plasma membrane of cells.43,44 In addition, the vesicles also contained a small quantity (10-3%) of the thiol functionalized lipid, DHPTE. Based upon the number of DHPTE molecules in the vesicle solution, an order of magnitude fewer maleimide functionalized QDs were added to the solution to bind the vesicles. As verified by FCS, this procedure ensured that there were no excess functionalized QDs in the vesicle solution which could potentially bind to proteins or other cysteine containing biomolecules in the cell membrane. Upon binding the maleimide functionalized QDs to the SUVs, they were allowed to fuse with the cells for 15-20 minutes before the excess vesicles were rinsed off and the cells were imaged. Quantum dots were only tracked if they remained in focus during lateral diffusion, thus excluding tracking artifacts due to either unfused or internalized imaging probes.
(g) Cell Culture
NRK fibroblasts were cultured in Dubelco’s Minimum Essential Medium (DMEM) with 10% FetalPlex Animal Serum Complex (Gemini Bioproducts). Cells were plated on 18 mm diameter coverslips for single fluorophore imaging, and used the next day. COS-7, HEK-293 and Swiss-3T3 cells were cultured by standard procedures and plated on 18 mm diameter coverslips for single fluorophore imaging, and used the next day.
Detailed information about the experimental methods (confocal fluorescence correlation spectroscopy, wide-field single molecule fluorescence microscopy, and oblique angle fluorescence microscopy) is provided in Supporting Information.
Results and Discussion
Prior to conjugation of QDs to lipids, the colloidal stability and the photophysical properties of capped QDs were determined in aqueous solution. Because FCS is a powerful method to obtain the necessary information,40,45,46 Fig. 2 illustrates corresponding FCS autocorrelation curves of rhodamine dyes and of CdSe/ZnS QDs with MPA, AEE, and LIPO coatings obtained after t = 10 min (left) and t = 1week (right).41 Using Eq. 2.3 (in Supporting Information), the autocorrelation curves in Fig. 2A provide the following hydrodynamic radii after 10min: (i) r(rhodamine) = 0.6nm,(ii) r(MPA) = 3.3nm, (iii) r(AEE) = 4.5nm, and (iv) r(LIPO) = 14.6nm . As expected, the obtained radii indicate that AEE-coated QDs are smaller than LIPO-coated systems. The obtained radii also suggest that AEE- and LIPO-QDs exist in solution as individual, colloidally stable nanocrystals. The colloidal stability is evaluated more rigorously by comparing hydrodynamic radii determined the QD samples after t=10min (Fig. 2, left) and t=1week (Fig. 2, right). While the hydrodynamic radius of the MPA QD sample, which was employed as a negative control, increased significantly to r(MPA) = 12.1nm, those of the AEE-and LIPO-QDs samples remain largely unchanged with r(AEE) = 5.3nm and r(LIPO) = 16.3nm. These findings not only verify the excellent colloidal stability of LIPO QDs, which already have been applied successfully in long-term cellular studies,31 but also highlight the promising properties of the smaller AEE QDs. The very good colloidal stability of AEE-coated QDs observed is reasonable because similar ultrathin poly(ethylene oxide) (PEO) coatings consisting of not more than three EO segments were effective in preventing the non-specific adsorption of proteins.38
Figure 2.
FCS autocorrelation curves of MPA, AEE, and LIPO QDs in 0.1M PBS buffer, pH 7.0 after sample preparation at t=10min (left) and after one week (right). The rhodamine data are added as a reference.
The quality of the surface coatings was further evaluated by monitoring the photoluminescence properties of capped QDs in aqueous solution. Specifically, FCS was applied to determine the photon counts per particle of MPA-, AEE-, and LIPO-coated QDs over a time period of one week, which provided 550-690 (MPA-coated QDs), 530-640 (AEE-coated QDs), and 850-1000 (LIPO-coated QDs). Most importantly, for all three coatings, no drop in the counts per particle was observed over the time period of one week. The lower counts per particle of MPA and AEE QDs relative to LIPO QDs are caused partially by the fluorescence-reducing effect of the thiol exchange reaction employed in both cases. In addition, the reduced emission observed could result from the thinner barrier between the nanocrystal surface and water (relative to LIPO QDs). If water does reach the nanoparticle surface, it can oxidize the nanocrystal, which decreases the emission efficiency. We have demonstrated this phenomenon by intentionally stripping off the dynamic surface exchanged nanoparticle coatings with repeated washings, or dialysis, resulting in quenched fluorescence (data not shown).
After AEE- and LIPO-coated QDs were verified to show good colloidal stability and photophysical properties in aqueous solution, their properties in a solid-supported phospholipid bilayer were studied. Initially, the inertness of maleimide-functionalized AEE and LIPO QDs was explored qualitatively by monitoring their non-specific adsorption to a bilayer without sulfhydryl lipids using wide-field single molecule fluorescence microscopy. These control experiments verified no non-specific binding of QDs on the bilayer for both types of coated QDs (data not shown). In the next step, QDs were conjugated to sulfhydryl lipids in the lipid bilayer. To achieve monovalent labeling, which is essential for single molecule imaging, the surface of the QD must exhibit the proper concentration of maleimide. In particular, too elevated maleimide concentrations may cause individual QDs to bind to multiple sulfhydryl lipids. To determine conditions, where QDs are monovalently labeled to lipids, QDs with systematically varied maleimide concentrations were added to a solid-supported SOPC bilayer containing 10-8 mol % of maleimide-reactive DHPTE and their binding behavior was analyzed using single molecule fluorescence microscopy. Specifically, four samples of maleimide-functionalized QDs were created for both the heterobifunctional linker and the maleimide lipopolymer. The ratio of maleimide linker to AEE, or maleimide lipopolymer to lipopolymer was increased for each subsequent QD sample. The linker:passive molecule ratios used were 1:10000, 1:1000, 1:100 and 1:10. Starting with the QD sample containing the lowest amount of maleimide groups, the samples were screened in order of increasing concentration for binding to DHPTE-containing membranes via single molecule fluorescence microscopy. Monovalent labeling is expected at the lowest ratio of maleimide to inert surface molecules leading to QD binding, which was found to be 1:100 for AEE and LIPO coatings.
After verification of the inertness of AEE and LIPO QDs in the presence of a phospholipid bilayer and after identification of the appropriate maleimide concentration on the QD surface for lipid tracking experiments, maleimide-functionalized QDs were tested as lipid tracking probes for single molecule imaging on model membranes and were compared to dye tracking probes (TRITC-DHPE). Fig. 3 represents comparing square displacement r2 histograms of TRITC-DHPE and LIPO QDs conjugated lipids in a solid-supported SOPC bilayer for a tlag=50ms. Notably, statistically identical mean-square displacement ⟨r2⟩ values of ⟨r2⟩dye = 0.19 ± 0.05μm2 and ⟨r2⟩QD = 0.20 ± 0.05μm2 can be derived from both histograms. This excellent agreement between QD and dy probes is important because it shows that QDs did not crosslink multiple lipids and that monovalent labeling of QDs to sulfhydryl lipids was achieved. It should be emphasized that single and crosslinked lipids show different diffusion behavior.7
Figure 3.
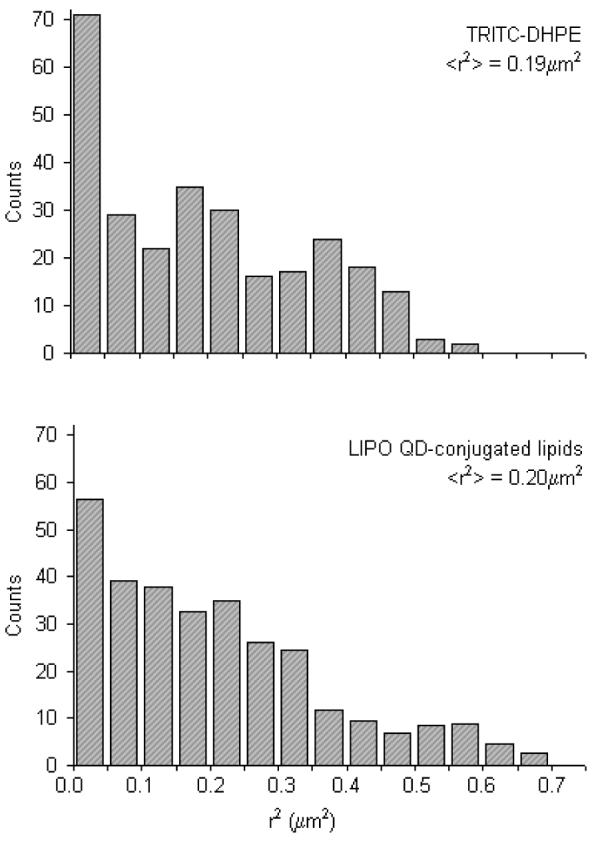
Representative square-displacement r2 histograms obtained from single lipid tracking experiments on dye-labeled (TRITC-DHPE) and LIPO QD-conjugated lipids in a solid-supported phospholipid bilayer. The resulting mean-square displacements of ⟨r2⟩ = 0.19 ± 0.01μm2 (dye) and ⟨r2⟩ = 0.20 ± 0.01μm2 (QD) are statistically identical and suggest that QD lipids diffuse like their dye-labeled counterparts. The ⟨r2⟩ data are based on a time lag of tlag = 50ms.
The great similarity of QD- and dye-based lipid tracking results in Fig. 3 also corroborates the lack of nonspecific binding between lipid-conjugated QD probes and the SOPC bilayer. Of course, to investigate the inertness of lipid-conjugated QDs more rigorously, the diffusion properties need to be analyzed over a larger range of different time lags. Unlike dyes, individual QDs can be tracked over longer time periods due to their superior photostability. Fig. 4 illustrates ⟨r2⟩ — time plots of AEE and LIPO QDs conjugated to a solid-supported SOPC bilayer which span a time period of 2sec. Both plots and are well-described by linear fits, thus verifying Brownian diffusion of QD-conjugated lipids in the SOPC bilayer. Furthermore, the almost identical slopes of the two plots also show that AEE and LIPO QD-conjugated lipids are characterized by the same lateral mobility. Overall, the conducted model membrane experiments successfully identified conditions of monovalent QD labeling of lipids, thus facilitating single molecule tracking studies of these probes on cell surfaces.
Figure 4.
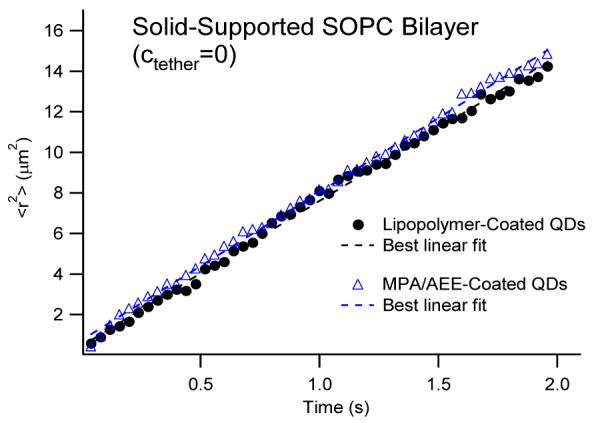
⟨r2⟩-time plots of LIPO- and AEE-coated QDs conjugated to thiolipids in the top monolayer of 2 seconds. The dashed lines show the best linear fits associated with the Brownian diffusion model. The identical slopes of both plots verify that LIPO- and AEE-coatings result in identical lipid diffusion properties.
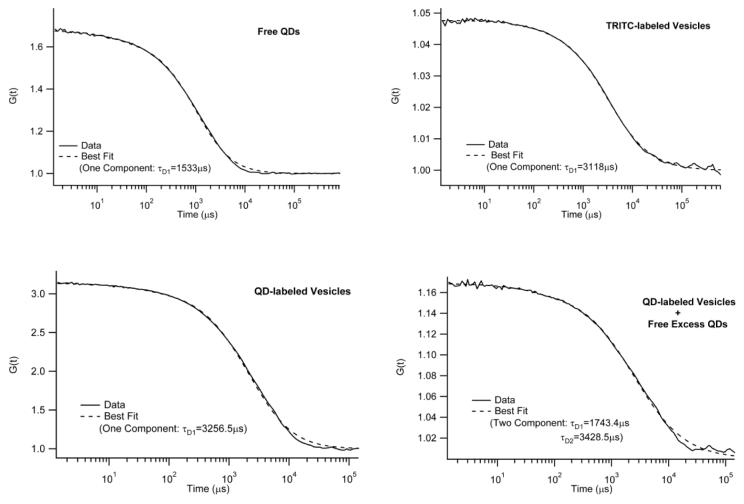
To incorporate QD lipids into plasma membranes, maleimide-functionalized AEE QDs were bound to DHPTE in fusogenic, small unilamellar vesicles (SUVs) composed of a mixture of SOPC and 1-palmitoyl-2-oleoyl-sn-glycero-3-phosphoethanolamine (DOPE) (molar ratio: 3/1) containing 10-3mol% DHPTE. Again, to assure monovalent binding of QDs to DHPTE, the linker to passive molecule ratio on the QD surface was set to 1:100. Furthermore, to avoid an excess of unbound QDs in the vesicle solution, the amount of QDs added was kept one order of magnitude lower than the amount of DHPTE. Fig. 5 shows FCS autocorrelation data and best fitting curves of free QDs (top, left), vesicles labeled with dye-lipid TRITC-DHPE (top, right), QDs bound to vesicles (bottom, left), and QDs bound to vesicles + free excess QDs (bottom, right). Not surprisingly, free QDs and TRITC-labeled vesicles are best described by one-component fits with notably different diffusion times of τD1=1533μs and τD1=3118μs, respectively. When all maleimide-functionalized QDs are bound to DHPTE-containing vesicles, the FCS data match those obtained using TRITC-containing vesicles. Again, the FCS curve is best described by a one-component fit. Furthermore, the diffusion time of τD1=3256.5μs is indistinguishable (within the experimental error of 5%) from the value determined using TRITC-containing vesicles. A two-component fit did not improve the fit quality and resulted in almost identical diffusion times of τD1=3247μs and τD2=3249μs, respectively. In contrast, with an excess of QDs, the FCS data are best described using a two-component model. Here the diffusion times of τD1=1743μs and τD2=3428μs are in good agreements with corresponding results obtained using free QDs and QDs bound to vesicles, respectively. Overall, these experiments provide experimental evidence that samples of QD-labeled vesicles can be prepared, where free, excess QDs are statistically insignificant.
Figure 5.
FCS autocorrelation data and corresponding best fits of free AEE QDs (top, left), vesicles labeled with the dye lipid TRITC-DHPE (top, right), maleimide-functionalized AEE QDs bound to DHPTE-containing vesicles (bottom, left), and DHPTE-containing vesicles with bound and unbound maleimide-functionalized AEE QDs (bottom, right). The data illustrate that QD-labeled vesicles can be prepared without free, excess QDs.
Upon verifying the proper conjugation of QDs to vesicles, the QD-containing SUVs were fused to the plasma membrane of cells. As already mentioned in the Experimental Section, QD lipids were only tracked as long as they remained in the focus of the microscope, thus excluding tracking artifacts due to either unfused or internalized imaging probes. Fig. 6 illustrates diffusion coefficient histograms of QD-conjugated lipids obtained from tracking experiments on COS7, 3T3, and HEK293 cells using a frame rate of 30 fps. Tab. 1 summarizes the average diffusion coefficients from these studies, together with previously reported data obtained using dye-labeled lipids. The good agreement between QD and dye data, particularly for COS-7 and 3T3 cells, indicates that individual QD-conjugated lipids were tracked on the cell surface. Only the HEK293 data show a moderate discrepancy. However, Murase and coworkers reported a large variation of diffusion coefficients among individual dye-labeled lipids tracked, resulting in an SD of ±0.18μm2/s.4 Overall, Fig. 6 and Tab. 1 demonstrate that QDs conjugated to lipids maintain their inertness as tracking probes on the cell surface.
Figure 6.
Diffusion coefficient histograms for QD labeled lipids in three cell lines, COS 7, 3T3, and HEK293.
Table 1.
Diffusion coefficients of dye- and QD-lipids in COS-7, 3T3, and HEK293.
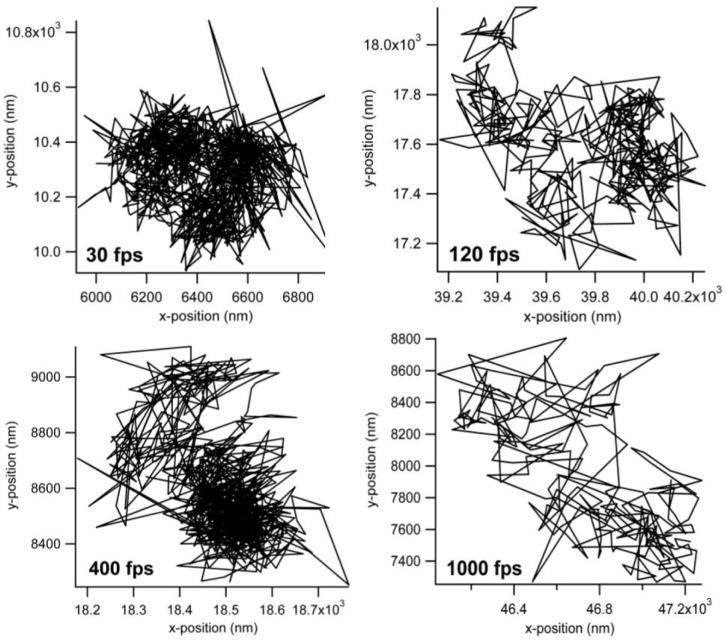
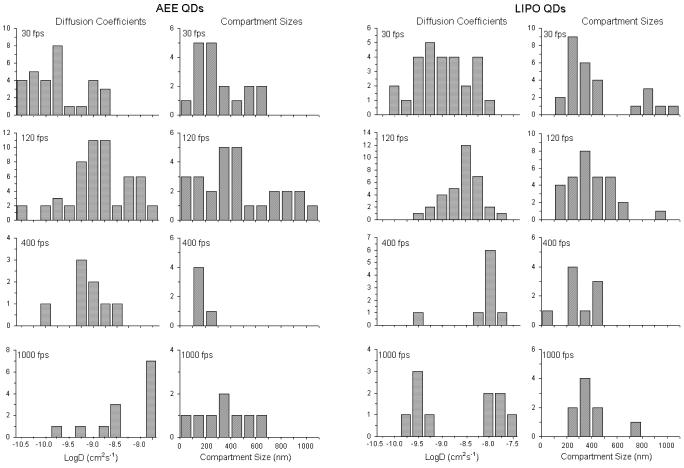
The main advantage of QD probes over their dye counterparts is expected in the case of fluorescence high-speed imaging. The higher brightness of the QD-lipids in comparison to dye labeled lipids makes them particularly suited for faster than video rate fluorescence microscopy. Further, the use of organic dyes in high speed imaging requires increased excitation laser powers which decreases the lifetime of the organic dyes. In comparison, the photostability of the QD probes allows for long time, high speed single particle imaging. Fig. 7 presents typical trajectories from high-speed tracking experiments on the plasma membrane of NRK fibroblasts using QD-lipids with AEE coatings. These trajectories demonstrate the high photostability of QDs and the ability to conduct long-term tracking experiments with these fluorescent probes. Fig. 8 illustrates lateral diffusion and compartment size data from high speed tracking experiments of AEE- (left) and LIPO-coated (right) QD-conjugated lipids in the plasma membrane of NRK fibroblasts. Here tracking was conducted using four different frame rates of 30, 120, 400, and 1000 fps. Regardless of the type of QD coating, the analysis shows that the membrane consists of two sizes of compartments, consistent with those observed previously with 40nm diameter gold-labeled lipids.48 As the frame rate increases, the measured diffusion coefficient of QD lipids increases as expected and the smaller compartments dominate in the analysis. For comparison, the diffusion coefficient determined with 40nm diameter gold-labeled lipids viewed at 500 fps was 1.6μm2/s,47 which agrees well with this study AEE and LIPO QD-lipids at 400 fps, where 0.85 ± 0.15 μm2/s was obtained. Overall, the tracking data in Fig. 8 illustrate that AEE and LIPO QD-lipids show very similar diffusion properties on the cell surface. The current studies also demonstrated that fluorescence-based single molecule tracking experiments can be conducted with frame rates of up to 1000 fps, which currently is the maximum frame rate of our imaging system. At 1000 fps, the signal to noise, measured as the ratio of the background subtracted signal to the standard deviation in the fluctuations of the background subtracted signal, ranged from 2-2.5 on live cells. What is perhaps most important is that the photostability of the QD probes allows imaging at these high frame rates for over a second long. Such long trajectories will allow for quantitative analysis of structure and interactions in the membrane. The access to higher frame rates is intriguing because it improves the spatial resolution of the imaging approach.48 The improved spatial resolution is particularly advantageous to probe subdiffraction limit-size heterogeneities in cellular systems, which have been previously only been possible to study using much larger Au-labels.
Figure 7.
Representative trajectories of AEE-coated QDs bound to DHPTE in the plasma membrane of NRK cells determined at different frames rates of 30, 120, 400, and 1000fps.
Figure 8.
Frame rate-dependent change in histograms of the diffusion coefficient and compartment size obtained using AEE- (left) and LIPO-QD lipids (right) in the plasma membrane of NRK cells. The data illustrate the features of hop diffusion at high frame rates.
Conclusion
Previous single molecule tracking experiments on lipids have been limited by either a probe size notably exceeding that of the labeled biomolecule (colloidal Au) or poor photostability (fluorescent dyes). In the current study, these limitations are overcome by conjugating CdSe/ZnS QDs with bioinert surface properties to lipids and tracking their lateral mobility in planar model membranes and in plasma membranes. Our studies show that highly photoluminescent, capped CdSe/ZnS with a size of less than 10nm can be applied as powerful tracking probes in single lipid tracking applications. The results presented herein highlight their particular strength in state-of-the-art high-speed single molecule imaging. This experimental approach is very attractive to obtain information about heterogeneities of biomolecules with a spatial resolution of less than 100nm, which, so far, only have been detectable using 40-50nm colloidal Au probes. Since molecular crowding is a common feature of many cellular regions, the smaller size QDs are expected to outperform their colloidal Au counterparts in many imaging applications. QDs are also advantageous because, unlike Au probes, they can be employed in multicolor experiments where different types of biomolecules can be monitored at the same time. Although the current work has focused on QD-conjugated lipids, the presented technology is easily applicable to the long-term, high-speed tracking of individual proteins. For example, as will be described in a future paper, conjugation of QDs to proteins was easily accomplished by replacing maleimide functional groups on the QD surface with succinimidyl ester, which is reactive to amine groups of proteins (data not shown).
Supplementary Material
Acknowledgment
This research was supported in part by the National Science Foundation (grant: MCB-0416779) and the National Institute of Health (grant: R21 DK77051-01).
Footnotes
Supporting Information Available
Detailed information about the methodology is provided (confocal fluorescence correlation spectroscopy, wide-field single molecule fluorescence microscopy, oblique angle fluorescence microscopy, single molecule tracking analysis). The information is available free of charge via the internet at http://pubs.acs.org/.
References
- (1).Singer SJ, Nicolson GL. Science. 1972;175:720–731. doi: 10.1126/science.175.4023.720. [DOI] [PubMed] [Google Scholar]
- (2).Kusumi A, Nakada C, Ritchie K, Murase K, Suzuki K, Murakoshi H, Kasai RS, Kondo J, Fujiwara T. Annu. Rev. Biophys. Biomol. Struct. 2005;34:351–378. doi: 10.1146/annurev.biophys.34.040204.144637. [DOI] [PubMed] [Google Scholar]
- (3).Fujiwara T, Ritchie K, Murakoshi H, Jacobson K, Kusumi A. J. Cell Biol. 2002;157:1071–1082. doi: 10.1083/jcb.200202050. [DOI] [PMC free article] [PubMed] [Google Scholar]
- (4).Murase K, Fujiwara T, Umemura Y, Suzuki K, Iino R, Yamashita H, Saito M, Murakoshi H, Ritchie K, Kusumi A. Biophys. J. 2004;86:4075–4093. doi: 10.1529/biophysj.103.035717. [DOI] [PMC free article] [PubMed] [Google Scholar]
- (5).Geerts H, De Brabander M, Nuydens R, Geuens S, Moeremans M, De Mey J, Hollenbeck P. Biophys. J. 1987;52:775–782. doi: 10.1016/S0006-3495(87)83271-X. [DOI] [PMC free article] [PubMed] [Google Scholar]
- (6).Sheetz MP, Turney S, Qian H, Elson EL. Nature. 1989;340:284–288. doi: 10.1038/340284a0. [DOI] [PubMed] [Google Scholar]
- (7).Lee GM, Ishihara A, Jacobson KA. Proc. Natl. Acad. Sci. U.S.A. 1991;88:6274–6278. doi: 10.1073/pnas.88.14.6274. [DOI] [PMC free article] [PubMed] [Google Scholar]
- (8).Ghosh RN, Webb WW. Biophys. J. 1994;66:1301–1318. doi: 10.1016/S0006-3495(94)80939-7. [DOI] [PMC free article] [PubMed] [Google Scholar]
- (9).Qian H, Sheetz MP, Elson EL. Biophys. J. 1991;60:910–921. doi: 10.1016/S0006-3495(91)82125-7. [DOI] [PMC free article] [PubMed] [Google Scholar]
- (10).Fein M, Unkeless J, Chuang FYS, Sassaroli M, da Costa R, Väänänen H, Eisinger J. J. Membr. Biol. 1993;135:83–92. doi: 10.1007/BF00234654. [DOI] [PubMed] [Google Scholar]
- (11).Kusumi A, Sako Y, Yamamoto M. Biophys. J. 1993;65:2021–2140. doi: 10.1016/S0006-3495(93)81253-0. [DOI] [PMC free article] [PubMed] [Google Scholar]
- (12).Güttler F, Irmgartinger T, Plakhotnik T, Renn A, Wild UP. Chem. Phys. Lett. 1994;217:393–397. [Google Scholar]; Moerner WE, Plakhotnik T, Irmgartinger T, Croci M, Palm V, Wild UW. J. Phys. Chem. 1994;98:7382–7389. [Google Scholar]
- (13).Schmidt T, Schuetz GJ, Baumgartner W, Gruber HJ, Schindler H. Proc. Natl. Acad. Sci. U.S.A. 1996;93(7):2926–2929. doi: 10.1073/pnas.93.7.2926. [DOI] [PMC free article] [PubMed] [Google Scholar]
- (14).Alivisatos AP, Gu WW, Larabell C. Ann. Rev. Biomed. 2005;7:55–76. doi: 10.1146/annurev.bioeng.7.060804.100432. [DOI] [PubMed] [Google Scholar]
- (15).Chan WCW. Biol. Blood Marrow Transplant. 2006;12(1 Suppl 1):87–91. doi: 10.1016/j.bbmt.2005.10.004. [DOI] [PubMed] [Google Scholar]
- (16).Michalet X, Pinaud FF, Bentolila LA, Tsay JM, Doose S, Li JJ, Sundaresan G, Wu AM, Gambhir SS, Weiss S. Science. 2005;307:538–544. doi: 10.1126/science.1104274. [DOI] [PMC free article] [PubMed] [Google Scholar]
- (17).Parak WJ, Gerion D, Pellegrino T, Zanchet D, Micheel C, Williams SC, Boudreau R, Le Gros M, Larabell CA, Alivisatos AP. Nanotechnol. 2003;14:15–27. [Google Scholar]
- (18).Murcia MJ, Naumann CA. Biofunctionalization of fluorescent nanoparticles. In: Kumar C, editor. Biofunctionalization of Nanoparticles. Wiley-VCH; Weinheim: 2005. pp. 1–40. [Google Scholar]
- (19).Peng X, Schlamp MC, Kadavanich AV, Alivisatos AP. J. Am. Chem. Soc. 1997;119:7019–7029. [Google Scholar]
- (20).Passow T, Leonardi K, Hommel D. Phys. Stat. Sol. 2001;224:143–146. [Google Scholar]
- (21).Pathak S, Choi SK, Arnheim N, Thompson ME. J. Am. Chem. Soc. 2001;123:4103–4104. doi: 10.1021/ja0058334. [DOI] [PubMed] [Google Scholar]
- (22).Mattoussi H, Mauro JM, Goldman ER, Anderson GP, Sundar VC, Mikulec FV, Bawendi MG. J. Am. Chem. Soc. 2000;122:12142–12150. [Google Scholar]
- (23).Mattoussi H, Mauro JM, Goldman ER, Green TM, Anderson GP, Sundar VC, Bawendi MG. Phys. Stat. Sol. 2001;224:277–283. [Google Scholar]
- (24).Aldana J, Wang YA, Peng XG. J. Am. Chem. Soc. 2001;123:8844–8850. doi: 10.1021/ja016424q. [DOI] [PubMed] [Google Scholar]
- (25).Gerion D, Pinaud F, Williams SC, Parak WJ, Zanchet D, Weiss S, Alivisatos AP. J. Phys. Chem. 2001;105:8861–8871. [Google Scholar]
- (26).Parak WJ, Gerion D, Zanchet D, Woerz AS, Pellegrino T, Micheel C, Williams SC, Seitz M, Bruehl RE, Bryant Z, Bustamante C, Bertozzi CR, Alivisatos AP. Chem. Mater. 2002;14:2113–2119. [Google Scholar]
- (27).Lagerholm BC, Wang M, Ernst LA, Ly DH, Liu H, Bruchez MP, Waggoner AS. Nano Letters. 2004;4:2019–2022. [Google Scholar]
- (28).Jaffar S, Nam KT, Khademhosseini A, Xing J, Langer RS, Belcher AM. Nano Letters. 2004;4:1421–1425. [Google Scholar]
- (29).Xie M, Liu HH, Chen P, Zhang ZL, Wang XH, Xie ZX, Du YM, Pan BQ, Pang DW. Chem. Comm. 2005;44:5518–5520. doi: 10.1039/b509781a. [DOI] [PubMed] [Google Scholar]
- (30).Goldmann ER, Balighian ED, Mattoussi H, Kuno MK, Mauro JM, Tran PT, Anderson GP. J. Am. Chem. Soc. 2002;124:6378–6382. doi: 10.1021/ja0125570. [DOI] [PubMed] [Google Scholar]
- (31).Dubertret B, Skourides P, Norris DJ, Noireaux V, Brivanlou AH, Libchaber Science. 2002;298:1759–1762. doi: 10.1126/science.1077194. [DOI] [PubMed] [Google Scholar]
- (32).Brunchez MJ, Moronne M, Gin P, Weiss S, Alivisatos AP. Science. 1998;281:2013–2016. doi: 10.1126/science.281.5385.2013. [DOI] [PubMed] [Google Scholar]
- (33).Chan WCW, Nie S. Science. 1998;281:2016–2018. doi: 10.1126/science.281.5385.2016. [DOI] [PubMed] [Google Scholar]
- (34).Dahan M, Levi S, Luccardini C, Rostaing P, Riveau B, Triller A. Science. 2003;302:442–445. doi: 10.1126/science.1088525. [DOI] [PubMed] [Google Scholar]
- (35).Lidke DS, Nagy P, Heintzmann R, Arndt-Jovin DJ, Post JN, Grecco HE, Jares-Erijman EA, Jovin TM. Nat. Biotechnol. 2004;22:198–203. doi: 10.1038/nbt929. [DOI] [PubMed] [Google Scholar]
- (36).Bouzigues Cedric, Morel Mathieu, Triller Antoine, Dahan Maxime. Proc. Natl. Acad. Sci. U.S.A. 2007;104:11251–11256. doi: 10.1073/pnas.0702536104. [DOI] [PMC free article] [PubMed] [Google Scholar]
- (37).Tamkun MM, O’Connell KMS, Rolig AS. J. Cell Sci. 2007;120:2413–2423. doi: 10.1242/jcs.007351. [DOI] [PubMed] [Google Scholar]
- (38).Chapman RG, Ostuni E, Liang MN, Meluleni G, Kim E, Yan L, Pier G, Warren HS, Whitesides GM. Langmuir. 2001;17:1225–1233. [Google Scholar]
- (39).Murcia MJ, Shaw DL, Long EL, Naumann CA. Opt. Comm. 2008;281:1771–1780. doi: 10.1016/j.optcom.2007.07.069. [DOI] [PMC free article] [PubMed] [Google Scholar]
- (40).Murcia MJ, Shaw DL, Woodruff H, Naumann CA, Young BY, Long EL. Chem. Mater. 2006;18:2219–2225. [Google Scholar]
- (41).Deverall MA, Gindl E, Sinner E-K, Besir H, Ruehe J, Saxton MJ, Naumann CA. Biophys. J. 2005;88:1875–1886. doi: 10.1529/biophysj.104.050559. [DOI] [PMC free article] [PubMed] [Google Scholar]
- (42).Garg S, Ruehe J, Luedtke K, Jordan R, Naumann CA. Biophys. J. 2007;92:1263–1270. doi: 10.1529/biophysj.106.091082. [DOI] [PMC free article] [PubMed] [Google Scholar]
- (43).Farhood H, Serbina N, Huang L. Biochim. Biophys. Acta. 1995;1235:289–295. doi: 10.1016/0005-2736(95)80016-9. [DOI] [PubMed] [Google Scholar]
- (44).Miller CR, Bondurant B, McLean SD, McGovern KA, O’Brien DF. Biochemistry. 1998;37:12875–12883. doi: 10.1021/bi980096y. [DOI] [PubMed] [Google Scholar]
- (45).Pellegrino T, Manna L, Kudera S, Liedl T, Koktysh D, Rogach AL, Keller S, Raedler J, Natile G, Parak WJ. Nano letters. 2004;4:703–707. [Google Scholar]
- (46).Zhang P, Li L, Dong C, Qian H, Ren J. Anal. Chim. Acta. 2005;546(1):46–51. doi: 10.1016/j.aca.2005.05.034. [DOI] [PubMed] [Google Scholar]
- (47).Fujiwara T, Ritchie K, Murakoshi H, Jacobson K, Kusumi A. J. Cell Biol. 2002;157:1071–1081. doi: 10.1083/jcb.200202050. [DOI] [PMC free article] [PubMed] [Google Scholar]
- (48).Ritchie K, Shan X-Y, Kondo J, Iwasawa K, Fujawara T, et al. Biophys. J. 2005;88:2266–2277. doi: 10.1529/biophysj.104.054106. [DOI] [PMC free article] [PubMed] [Google Scholar]
- (49).Goodwin JS, Drake KR, Remmert CL, Kenworthy AK. Biophys. J. 2005;89:1398–1410. doi: 10.1529/biophysj.104.055640. [DOI] [PMC free article] [PubMed] [Google Scholar]
- (50).Metcalf TN, Wang JL, Schindler M. Proc Natl. Acad. Sci. 1986;83:95–99. doi: 10.1073/pnas.83.1.95. [DOI] [PMC free article] [PubMed] [Google Scholar]
Associated Data
This section collects any data citations, data availability statements, or supplementary materials included in this article.


