

Abstract
Human parainfluenza virus type 1 (HPIV1) is an important respiratory pathogen in children and the most common cause of viral croup. We performed a microarray-based analysis of gene expression kinetics to examine how wild-type (wt) HPIV1 infection altered gene expression in human respiratory epithelial cells and what role beta interferon played in this response. We similarly evaluated HPIV1-P(C−), a highly attenuated and apoptosis-inducing virus that does not express any of the four C proteins, and HPIV1-CF170S, a less attenuated mutant that contains a single point mutation in C and, like wt HPIV1, does not efficiently induce apoptosis, to examine the role of the C proteins in controlling host gene expression. We also used these data to investigate whether the phenotypic differences between the two C mutants could be explained at the transcriptional level. Mutation or deletion of the C proteins of HPIV1 permitted the activation of over 2,000 cellular genes that otherwise would be repressed by HPIV1 infection. Thus, the C proteins profoundly suppress the response of human respiratory cells to HPIV1 infection. Cellular pathways targeted by the HPIV1 C proteins were identified and their transcriptional control was analyzed using bioinformatics. Transcription factor binding sites for IRF and NF-κB were overrepresented in some of the C protein-targeted pathways, but other pathways were dominated by less-known factors, such as forkhead transcription factor FOXD1. Surprisingly, the host responses to the P(C−) and CF170S mutants were very similar, and only subtle differences in the expression kinetics of caspase 3 and TRAIL receptor 2 were observed. Thus, changes in host cell transcription did not reflect the striking phenotypic differences observed between these two viruses.
Human parainfluenza virus type 1 (HPIV1) is the principal cause of laryngotracheobronchitis, or croup, and HPIV1, -2, and -3 are collectively the second most common cause of pediatric respiratory hospitalizations, surpassed only by respiratory syncytial virus (14, 45). The clinical manifestations of HPIV1 range from mild disease, including rhinitis, pharyngitis, and otitis media, to severe disease, including croup, bronchiolitis, and pneumonia (7). Licensed vaccines against any of the HPIVs are currently not available, but ongoing efforts to develop HPIV3 vaccines that employ cDNA-derived live attenuated viruses have progressed to phase 1/2 clinical evaluation (31-33).
HPIV1 is an enveloped, negative-sense, nonsegmented RNA virus. The viral genome, 15.6 kb in length, consists of six genes (3′-N-P/C-M-F-HN-L-5′), which encode the nucleoprotein (N), phosphoprotein (P), C proteins (C), matrix protein (M), fusion protein (F), hemagglutinin-neuraminidase protein (HN), and large polymerase protein (L). The C proteins comprise a nested set of four carboxy-coterminal proteins, designated C′, C, Y1, and Y2, that are expressed from individual start sites in a second open reading frame within the P/C gene and are thought to play an important role in HPIV1 virulence (47). The C proteins of Sendai virus (SeV), or murine PIV1, are the best studied of the paramyxovirus C proteins, and there is considerable sequence conservation between the SeV and HPIV1 C proteins. However, the P/C gene organization of SeV differs from that of HPIV1 in that SeV expresses a second accessory protein, the V protein, in addition to the C proteins. There are also phenotypic differences between SeV and HPIV1 C protein mutants. SeV mutants that do not express any of the C proteins (SeV C knockouts) could be recovered using reverse genetics, which identified the C proteins as nonessential viral proteins (39). However, SeV C knockouts are restricted in replication in vitro and in vivo, which reflects the observation that the C proteins are multifunctional (16, 27, 44, 53). SeV C proteins have been shown to regulate viral replication (8), promote viral assembly (23), confer virulence in mice (28), suppress apoptosis in HEp-2 cells (38), and interfere with antiviral host defense through interferon (IFN) antagonism (19, 35). Recent studies evaluating the HPIV1 C proteins have also identified them as nonessential (4) and demonstrated an important role for the HPIV1 C proteins as IFN antagonists following infection of A549 and MRC-5 human respiratory epithelial cells (6, 66). Specifically, the HPIV1 C proteins inhibit the induction and signaling of IFN in the host cell.
The induction of IFN synthesis following virus infection depends on a number of pattern recognition receptors that recognize conserved pathogen-associated molecular patterns and initiate downstream signaling cascades (29). The IFN antiviral pathway can be activated by double-stranded RNA (dsRNA), 5′-triphosphate single-stranded RNA, or viral infection. The presence of dsRNA, an intermediate of viral replication, is recognized as a pathogen-associated molecular pattern by Toll-like receptor 3 and two caspase recruitment domain (CARD)-containing RNA helicases, retinoic acid-inducible protein I (RIG-I) and melanoma-associated differentiation protein 5 (MDA-5), which are constitutively expressed and act as intracytoplasmic sensors of dsRNA (2, 63, 73). RIG-I also specifically binds single-stranded RNA with 5′-triphosphate ends to distinguish self from nonself RNA (24, 51, 63, 72). Toll-like receptor 3 uses the adaptor TIR domain-containing adaptor inducing IFN-β (TRIF), while RIG-I and MDA-5 recruit another CARD-containing adaptor, mitochondrial antiviral signaling protein (MAVS, also referred to as IPS-1, Cardif, or VISA), to relay the signal to the kinases TBK1 and IKK-i, which phosphorylate IRF3 (IFN regulatory factor 3), and to IKKβ, which activates the NF-κB pathway (13, 37, 48, 60, 70). Once activated, IRF3 translocates into the nucleus and binds the positive regulatory domain III (PRDIII) of the IFN-β promoter. RIG-I and MDA-5 can distinguish between different RNA viruses (36). IFN production in response to SeV infection is specifically dependent on RIG-I expression, whereas IFN production in response to picornavirus infection is dependent on MDA-5 expression (36). IRF-3 and NF-κB, together with ATF-2/c-Jun, form an enhanceosome that binds to the IFN-β promoter, inducing transcription of the IFNB gene. IFN-β, in turn, controls the expression of a broad array of antiviral genes (71). Transcriptional activation of type I IFN is biphasic. One gene encodes the prototypical IFN-β, while more than a dozen IFN species comprise the IFN-α family (64). Recognition of viral infection results in the phosphorylation of constitutively expressed IRF3 to induce IFN-β and IFN-α1 expression in human cells as part of the early response to virus infection. Once early type I IFN is produced and secreted, it binds to the type I IFN receptor on the surface of the infected and neighboring cells, activates the JAK-STAT signal transduction cascade, and induces the formation of IFN-stimulated gene factor 3 (ISGF3), which consists of a heterotrimeric complex of STAT1, STAT2, and IRF9. ISGF3 binds to the IFN-stimulated response elements (ISRE) within the promoter regions of several hundred IFN-inducible genes, including 2′-5′-oligoadenylate synthetase (OAS), dsRNA-dependent protein kinase (PKR), and IRF7. The de novo-produced IRF7 is phosphorylated and can then activate production of additional type I IFNs, including IFN-β and the full set of IFN-α's (58). Thus, immediate-early expression of IFN-β and IFN-α1, induced by IRF3, NF-κB, and ATF-2, occurs soon after viral infection is detected, while delayed expression of the entire type I IFN family, induced by IRF7, occurs only after IFN-β and IFN-α1 secretion, receptor binding, and signaling to amplify a robust feed-forward antiviral response (43, 64).
Our laboratory has established a reverse-genetics system for HPIV1 that allows the generation of infectious virus from cDNA (46). By use of this system, a number of HPIV1 mutants containing mutations in the C gene have been generated to investigate C protein function and to generate novel live attenuated experimental vaccines that are attenuated by disturbing the IFN antagonistic function of the C gene (66). Previously, a phenylalanine-to-serine substitution of amino acid 170 of SeV was shown to significantly attenuate a highly virulent SeV strain, increasing the 50% lethal dose 20,000-fold in mice (17). This CF170S mutation, which affects all four C proteins without affecting the P protein, was introduced into the P/C gene of recombinant HPIV1 (rHPIV1) by reverse genetics (46). This mutant, designated rHPIV1-CF170S and referred to here as CF170S, was previously found to be defective in inhibiting IFN-β induction and signaling in vitro and to be attenuated for replication in the respiratory tracts of hamsters and African green monkeys (AGMs) (3, 66). Whereas wild-type (wt) HPIV1 infection abrogated IRF3 dimerization and nuclear translocation, infection with rHPIV1-CF170S resulted in IRF3 activation and IFN-β production (66). The wt HPIV1 C proteins were also shown to inhibit IFN signaling by blocking STAT1 and STAT2 nuclear translocation, and wt HPIV1 could overcome a preexisting IFN-β-induced antiviral state in MRC-5 cells (6). In contrast to wt HPIV1, rHPIV1-CF170S did not inhibit the establishment of an antiviral state (66).
More recently, we constructed a mutant HPIV1 that does not express any of the four C proteins, which is designated rHPIV1-P(C−) and is referred to here as P(C−) (4). In this virus, the C′ start codon was deleted, the C start codon was mutated, and several stop codons were inserted to ensure that the C′, C, Y1, and Y2 proteins could not be expressed. All of the above-described mutations were designed to be silent in the P open reading frame. Interestingly, the P(C−) and CF170S mutant viruses differ in their in vitro and in vivo phenotypes. The P(C−) mutant is highly attenuated in vivo in AGMs, whereas the CF170S mutant is only moderately attenuated. In addition, infection with the P(C−) mutant leads to early and significant induction of apoptosis, while CF170S and wt HPIV1 are very weak inducers of apoptosis (4).
Microarray-based analyses are increasingly being used in virology and have helped to elucidate virus-host interactions for a number of viruses (reviewed in reference 30). In the present study, we used a microarray-based analysis of the kinetics of gene expression to examine (i) how wt HPIV1 infection altered human respiratory epithelial cell gene expression, (ii) what role IFN-β played in this response, (iii) how the response to infection with the C mutant viruses CF170S and P(C−) compared to the response to infection with wt HPIV1, and (iv) whether the phenotypic differences between the two C mutant viruses (levels of attenuation and apoptosis phenotypes) could be explained on a transcriptional level. We compared the mRNA levels in A549 cells treated with IFN-β or infected with wt HPIV1, CF170S, or P(C−) by using a microarray that represented the full complement of known human genes. To examine the function of the C proteins in the infected cell, the expression patterns of cells infected with HPIV1 C mutant viruses were compared to that of cells infected with wt HPIV1. We show that the C proteins of HPIV1 profoundly suppress the innate response of human respiratory cells to infection with this important pediatric respiratory virus.
MATERIALS AND METHODS
Cell culture and viruses.
A549 human respiratory epithelial cells (catalog number CCL-185; ATCC, Manassas, VA) were maintained in F-12 medium supplemented with 0.1 mg/ml gentamicin sulfate, 4 mM l-glutamine (Gibco-Invitrogen, Carlsbad, CA), and 5% fetal bovine serum (HyClone, Logan, UT). LLC-MK2 cells (ATCC) were maintained in Opti-MEM I (Gibco-Invitrogen) supplemented with 0.1 mg/ml gentamicin sulfate and 5% fetal bovine serum.
Recombinant wt HPIV1 and CF170S and P(C−) mutants were each recovered from cDNA as previously described (4, 46, 47). All viral infections were carried out at 32°C in media containing 1.2% recombinant trypsin TrypLE Select (Gibco-Invitrogen) without fetal bovine serum. Virus stocks were generated by infecting LLC-MK2 cells at a multiplicity of infection (MOI) of 0.01 50% tissue culture infectious doses (TCID50) per cell and by harvesting supernatant on day 7 postinfection (p.i.). Virus particles in the supernatant were purified by centrifugation in a discontinuous 30%/60% sucrose gradient in 0.05 M HEPES and 0.1 M MgSO4 (Sigma-Aldrich, St. Louis, MO) at 120,000 × g for 90 min at 4°C. This purification was performed to minimize contamination of virus suspensions used to infect cells with cellular proteins, including IFN. Virus titers were determined by infecting LLC-MK2 cell monolayers with serial 10-fold dilutions of virus, and infected cultures were detected 7 days p.i. by hemadsorption with guinea pig erythrocytes (61). The titers of sucrose-purified wt HPIV1, CF170S, and P(C−) were determined at 8.9, 9.1, and 8.5 log10 TCID50 per ml, respectively.
Viral genomic RNA was isolated from the sucrose-purified stocks for sequence analysis by use of a QIAamp viral RNA minikit (Qiagen, Valencia, CA) and then reverse transcribed using a Superscript II first-strand synthesis system (Invitrogen), amplified using an Advantage high-fidelity PCR kit (Clontech, Mountain View, CA), and purified using a High Pure PCR purification kit (Roche, Indianapolis, IN) per the manufacturers' protocols and as previously described (47). The identity of each virus was confirmed by sequencing the entire viral genome using BigDye Terminator v1.1 on a DNA analyzer 3730 (Applied Biosystems, Foster City, CA) and analysis with Sequencher 4.7 (Gene Codes Corporation, Ann Arbor, MI).
Microarray sample preparation and expression analysis.
A549 cells were mock infected or infected in triplicate at an MOI of 5 TCID50 per cell with wt HPIV1, CF170S, or P(C−) for 6, 12, 24, and 48 h. In an independent experiment, additional A549 cell cultures were treated in triplicate with 300 pg/ml (60 IU/ml) of IFN-β (Avonex; Biogen Inc., Cambridge, MA) for 6 or 24 h. We chose this concentration because we previously found that infection of A549 cells with CF170S and P(C−) led to IFN secretion that resulted in an IFN concentration of approximately 300 pg/ml in the cell supernatant (4, 66). Thus, four treatment groups, i.e., IFN-β treatment, as well as infection with wt HPIV1, CF170S, and P(C−), were analyzed separately (IFN-β treatment at two time points and each of the three virus infections at four time points).
Cellular RNA was extracted from infected/treated cells by use of an RNeasy minikit and treated with an RNase-free DNase set (Qiagen). RNA from virus-infected and IFN-β-treated A549 cells was labeled with Cy5 while RNA from mock-infected samples was labeled with Cy3 using a two-color, low-RNA-input linear amp kit plus (Agilent Technologies, Foster City, CA) per the manufacturer's protocol. Labeled RNA was hybridized onto whole-human-genome 44K oligonucleotide microarrays (Agilent catalog number G4112F) and was scanned with a DNA microarray scanner (Agilent Technologies) per the manufacturer's protocol. This microarray detects the expression of over 41,000 genes and expressed sequence tags, representing all known genes in the human genome. Spot detection, signal quantitation, dye normalization by Lowess regression, and quality control assessment of control RNA spike-ins were performed using Feature Extraction software v9.5 (Agilent Technologies). Data were then loaded into GeneSpring GX 7.3.1 (Agilent Technologies) for signal normalization, statistical tests, and hierarchical clustering. Relative gene expression ratios for virus-infected and IFN-β-treated cells compared to mock-infected cells were calculated by dividing the intensity of the Cy5 signal by the Cy3 signal intensity. Each array was normalized to the median signal ratio of all probes on the array. Genes were defined as being differentially expressed between two samples if they were flagged as present in at least one sample and exhibited at least a fourfold difference that was statistically significant after multiple testing correction with a Benjamini-Hochberg false discovery rate of P of <0.01. The fourfold cutoff was chosen to minimize false positives and increase confidence in our data interpretation. Wei et al. give sample sizes required for detecting differential gene expression with 1.5-fold-, 2-fold-, and 4-fold-change cutoffs; lower cutoffs lead to a greater rate of false positives and a requirement for much larger sample sizes to detect significant changes by statistical tests (68). The phenotypic differences between the C mutant viruses were striking and were expected to be associated with large changes in expression that could be detected above fourfold. A total of 2,612 genes were identified as significantly differentially expressed compared to levels with mock infection in at least one of the four infection/treatment groups. To identify differences in gene expression among wt HPIV1, CF170S, and P(C−), we selected 1,314 of the 2,612 genes that demonstrated significant differential expression in at least one pairwise comparison between virus infections at the same time point and/or between IFN-β treatment and mock treatment. Hierarchical clustering was performed on individual samples based on the expression ratios at each time point using a Pearson correlation as a measure of similarity between expression profiles. These clusters are groups of genes that share similarities in the patterns with which their levels of expression vary over all sampling time points (11).
Functional genomic bioinformatics.
The clusters identified as described above were further examined for commonalities in functional characteristics, including overrepresentation of biological pathways and overrepresentation of transcription factor binding sites (TFBSs) within each respective cluster. Overrepresented functional pathways within each cluster of genes were searched against the Agilent whole-human-genome reference set using Ingenuity Pathway Analysis 5.5.1 (Ingenuity Systems, Redwood City, CA). Statistically overrepresented functional pathways (P < 0.05 using a right-tailed Fisher exact test) were retained for further analysis. A P value of less than 0.05 in the Fisher exact test indicates that the proportion of probes in the cluster, compared to every other probe on the Agilent whole-genome array, involved in a pathway is greater than would be expected by chance. TFBSs that were overrepresented within each cluster were identified using oPOSSUM single-site analysis software to search the 2,000-bp upstream sequence of each gene in the cluster against the JASPAR database (25, 57, 67). JASPAR is an open-access, curated, nonredundant database of 123 sequence motif matrices of experimentally defined TFBSs. Genes with assigned Entrez Gene identifiers were loaded into oPOSSUM to examine upstream sequences in all of the genes within each respective cluster of genes. oPOSSUM retrieves upstream promoter sequences from Ensembl (www.ensembl.org); uses phylogenetic footprinting to identify conserved, functional, noncoding DNA; and aligns sequences to position-specific scoring sequence matrices in JASPAR in order to identify high-quality, predicted, evolutionarily conserved TFBSs. We used an 85% matrix match threshold, a Z score of >10, and a Fisher exact test P value of <0.05 to select for TFBSs within each cluster that were statistically overrepresented compared to the background values for all genes in oPOSSUM. These criteria have been shown by testing randomly generated gene lists to yield a specificity of 86% (25).
Real-time quantitative PCR (RT-qPCR) expression analysis.
Total RNA was reverse transcribed using a high-capacity cDNA reverse transcription kit (Applied Biosystems, Foster City, CA) and amplified using TaqMan universal PCR master mix (Applied Biosystems). TaqMan gene expression assays (Applied Biosystems) for IFNB1 (Applied Biosystems assay identification code Hs01077958_s1), IRF7 (Hs00242190_g1), MX1 (Hs00182073_m1), NFKB1 (Hs00231653_m1), TRAF1 (Hs01090170_m1), and GAPDH (glyceraldehyde-3-phosphate dehydrogenase) (Hs99999905_m1) were chosen to validate microarray expression profiles, and samples were prepared for analysis per the manufacturer's protocol. The microarray analysis verified that GAPDH was an appropriate endogenous control since GAPDH expression was constant throughout all conditions and time points. Samples were run on a 7900HT fast real-time PCR system (Applied Biosystems). Quantitative PCR analysis was performed using SDS 2.3 and RQ Manager 1.2 (Applied Biosystems). All expression values were normalized against the GAPDH endogenous control and then normalized against values for mock-infected samples to obtain relative gene expression ratios using the Pfaffl method (50).
Microarray data accession number.
All of the microarray data were deposited according to MIAME standards in the Gene Expression Omnibus database at http://www.ncbi.nlm.nih.gov/geo/, with accession number GSE12664.
RESULTS
Differential gene expression following wt HPIV1 infection goes beyond modulation of the type I IFN response.
In order to better understand the host cell response to HPIV1 infection, A549 human respiratory epithelial cells were infected with wt HPIV1 at an MOI of 5 TCID50 per cell or were mock infected, and total cellular RNA was extracted at 6, 12, 24, and 48 h p.i. RNA was reverse transcribed, and changes in gene expression were compared to levels for mock-infected cells by use of a two-color, 60-mer cDNA microarray platform representing more than 41,000 human genes and expressed sequence tags. To directly identify IFN-inducible genes in A549 cells for comparison to the wt HPIV1-induced genes, additional A549 cells were treated with 300 pg/ml (60 IU/ml) of IFN-β or left untreated and analyzed in the same way as the wt HPIV1-infected cells. This dose of IFN-β was chosen because it approximates the concentration previously shown to be induced in this cell line by infection with the CF170S and P(C−) viruses (4, 66). An overview of this data set is depicted in Fig. 1, column I. Each treatment group (i.e., wt HPIV1 or IFN-β) at each time point consists of three replicates. A considerable number of known IFN-inducible genes, e.g., IRF7 and MX1, were upregulated late in the course of wt HPIV1 infection, i.e., at 48 h p.i., even though wt HPIV1 is known to inhibit type I IFN production and signaling in A549 cells (66). A total of 343 genes were differentially expressed (i.e., a fourfold or greater change compared to levels for mock infection; P < 0.01) at one or more time points following infection with wt HPIV1 and/or IFN-β treatment; overall, 284 genes were differentially expressed for HPIV1 and 191 genes for IFN-β (Fig. 2).
FIG. 1.

Comparison of A549 cellular genes responsive to infection with wt HPIV1 or treatment with IFN-β. (Column I) Hierarchical clustering of the 343 genes that were differentially expressed (fourfold or greater change relative to mock infection, P < 0.01 with multiple testing correction) following wt HPIV1 infection and/or IFN-β treatment, with the changes indicated in color. Each colored row represents an individual transcript, with representative genes identified immediately to the right. Each colored column consists of three replicates, side by side, with the treatment condition/time point (in hours p.i.) identified at the bottom. The genes were clustered into five groups (A through E, demarcated to the right) according to the levels of similarity of expression kinetics and magnitudes of expression versus those for mock infection at each time point, using a Pearson correlation as a measure of similarity. The number of genes in each cluster is given in parentheses. Three of the clusters (A, B, and D) contain genes that were predominantly responsive to IFN-β and/or wt HPIV1; one cluster (C) contains genes that were predominantly responsive to IFN-β but not wt HPIV1, and one cluster (E) contains genes that were predominantly responsive to wt HPIV1 but not IFN-β (see the text). (Column II) The gene expression profiles for clusters A through E are shown in panels A through E, respectively, with the geometric mean gene expression (y axis) plotted against each treatment condition at the indicated time points (hours p.i.) (x axis). (Column III) Functional pathways that are overrepresented in clusters A through E were determined using Ingenuity Pathway Analysis and are indicated on the left, next to the expression profile of the respective cluster. TFBSs that are overrepresented among the genes within each cluster were identified using oPPOSUM to search the JASPAR core database and are indicated to the right. Ag, antigen.
FIG. 2.
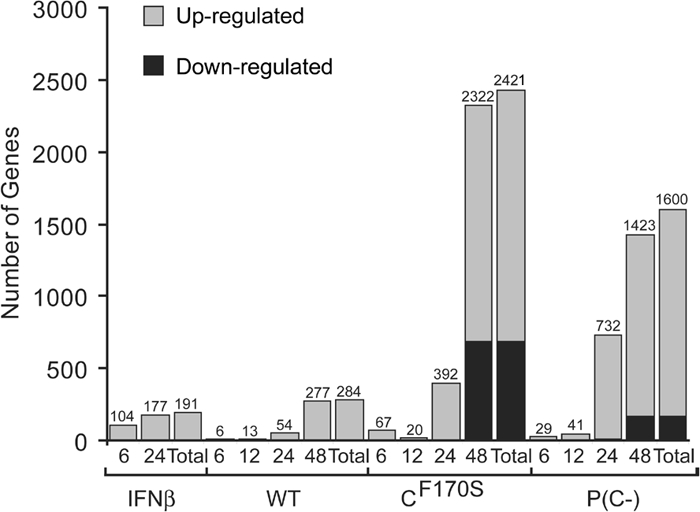
Total numbers of genes differentially expressed during HPIV1 infection and IFN-β treatment compared to mock infection over time (given in hours p.i.). Specifically, the numbers of genes that were significantly differentially expressed, in comparison to mock-infected cells, in cells infected with wt, CF170S, or P(C−) virus at 6, 12, 24, and 48 h p.i. or in IFN-β-treated A549 cells at 6 and 24 h p.i. are indicated. “Total” represents the cumulative numbers of genes differentially expressed taking all time points into consideration. Infection with CF170S or P(C−) virus led to a significant alteration of gene expression in many more genes than did infection with the wt or treatment with IFN-β.
The 343 genes that were differentially expressed in response to wt HPIV1 and/or IFN-β treatment were grouped into clusters based on the kinetics and magnitude of gene expression. This was done using a hierarchical clustering analysis of the 343 genes across both treatments and all of the time points (i.e., wt HPIV1 at 6, 12, 24, and 48 h p.i. and IFN-β at 6 and 24 h). Five different gene expression profile patterns were identified, including three clusters containing a combined total of 209 genes that were predominantly responsive to both IFN and wt HPIV1 (Fig. 1, clusters A, B, and D), one cluster of 17 genes that was predominantly responsive to IFN-β but not wt HPIV1 (cluster C), and one cluster of 117 genes that was predominantly responsive to wt HPIV1 but not IFN-β (cluster E). Although, in total, the 226 genes from clusters A, B, C, and D can be grouped together based on the predominant kinetics of gene expression after IFN-β treatment, only 191 of the 226 genes satisfied the fourfold-change criterion for IFN-responsive genes (Fig. 2). The remaining 34 genes were upregulated less than fourfold with IFN-β treatment but greater than fourfold with wt HPIV1 infection. Some representative members of each cluster are indicated in Fig. 1, column I; a complete list of the genes and their expression levels is provided in Table S1 in the supplemental material. The graphs in Fig. 1, column II, represent the geometric mean values for the change over time compared to mock infection values for all genes within each cluster and indicate a signature profile for the genes in that cluster.
Nearly all of the 170 genes in cluster A were responsive to IFN-β treatment, and a majority also were responsive to wt HPIV1 infection, although the response to wt HPIV1 infection was delayed by approximately 24 h (Fig. 1, column II, cluster A). In both treatment groups, the change increased with time. We next analyzed cluster A (and each succeeding cluster) for the overrepresentation of functional pathways within each cluster of genes by using a software tool that determines the likelihood of a given number of genes being represented within a defined pathway (Ingenuity Pathway Analysis). The P values (Fisher's exact test) for that likelihood are indicated next to the pathways in Fig. 1, column III. Genes involved in the Toll-like receptor and NF-κB pathways were overrepresented in cluster A, which is not surprising given the observed upregulation in response to IFN-β and wt HPIV1 (Fig. 1, column III; also see Table S1 in the supplemental material). In an aim at understanding the regulation of gene expression within a given cluster, the JASPAR database of TFBSs was searched for the overrepresentation of specific TFBSs within the genes contained in each cluster. In cluster A, IRF1 and IRF3/ISGF3 TFBSs, which all share the same conserved consensus sequence, were found to be significantly overrepresented (Fig. 1, column III). Since ISGF3, a heterotrimeric complex of STAT1, STAT2, and IRF9, is induced by binding of IFN-β to the IFN receptor, this finding was not unexpected. Translocation of ISGF3 into the nucleus activates the transcription of genes with ISRE. IRF1 similarly binds to and activates upstream cis-acting elements of the IFNA and IFNB genes.
Cluster B contained 27 genes that were upregulated predominantly by IFN-β and wt HPIV1. The mRNAs in cluster B were rapidly induced at 6 h after IFN-β treatment but, on average, failed to increase further at 24 h, whereas HPIV1 infection led to a steady increase in the expression of the cluster B genes (Fig. 1, column II, cluster B). Genes within this cluster seem to be functionally involved in IFN signaling and interleukin-6 (IL-6) signaling. Analysis of upstream cis-acting elements revealed that the family of NF-κB binding sites was significantly overrepresented among these genes. IFIT2 (IFN-induced protein with tetratricopeptide repeats 2/ISG-54) was one of the most strongly expressed genes in cluster B and was upregulated 85-fold by IFN-β treatment and more than 500-fold following wt HPIV1 infection (see Table S1 in the supplemental material).
The 17 genes in cluster C were upregulated by IFN-β but not by wt HPIV1. Upregulation was rapid, occurring by 6 h, with a continued increase at 24 h (Fig. 1, column II, cluster C). The genes in cluster C formed a relatively heterogeneous group that contained no significantly overrepresented functional pathways or TFBSs and contained only a few genes with known antiviral function, such as the tripartite motif protein 34 (TRIM34) (41). It is significant that infection with wt HPIV1 did not induce or activate expression of the subset of IFN-β-responsive genes that are represented in cluster C, suggesting that HPIV1 might activate a selective negative-feedback mechanism that inhibits transcription of a subset of IFN-β-responsive genes.
Cluster D is comprised of 12 genes that as a group were strongly induced by wt HPIV1 infection but weakly induced with IFN-β treatment. Only two genes were significantly induced by IFN-β beyond fourfold. Genes involved in IFN-β and chemokine signaling, such as CCL3, CCL5, CXCL10, and IL-28A/IFN-λ, were overrepresented in this cluster, and both IRF1 and c-REL binding sites dominated in the promoter regions of cluster D genes (Fig. 1, column III; also see Table S1 in the supplemental material).
Cluster E contained 117 genes that were induced predominantly by wt HPIV1 but not by IFN-β. Induction of the genes in cluster E was significantly delayed, i.e., it was not observed until 48 h p.i. This cluster notably included the cytokines IL-6, IL-8, tumor necrosis factor alpha (TNF-α), and CXCL3, and as a result, apoptosis, NF-κB, and death receptor pathways as well as IL-6 signaling pathways were significantly overrepresented in cluster E. The family of NF-κB TFBSs, but not ISRE or IRF, was statistically overrepresented in the promoters of these genes. The five species of NF-κB transcription factors, RELA (p65), RELB, c-REL, NF-κB1 (p105/p50), and NF-κB2 (p100/p52), are present in homo- and heterodimers that are bound by IκB proteins and localized in the cytoplasm until IκB is phosphorylated by the IκB kinase, leading to its ubiquitination and proteasome-mediated degradation. This releases the various NF-κB dimers for nuclear translocation and binding to NF-κΒ TFBSs in target genes. RELA, RELB, and c-REL each contain a transactivator domain that strongly activates transcription, whereas NF-κB1 and NF-κB2 lack this domain and, when binding as homodimers, can function as transcription repressors (65). Taken together, two key signaling pathways, the NF-κB and the IFN pathways, are central to regulating the cellular antiviral and inflammatory response to wt HPIV1 infection.
The HPIV1 C proteins inhibit the induction of gene expression in A549 cells.
The HPIV1 C proteins play an important role in the inhibition of IFN-β production and signaling (6, 66). The recently generated rHPIV1 mutant that does not express any of the C proteins, designated P(C−), is similar to CF170S with regard to its IFN phenotype in A549 cells but differs from CF170S in that P(C−) is a strong inducer of apoptosis in LLC-MK2 and A549 cells whereas CF170S more closely resembles wt HPIV1 as a weak inducer of apoptosis (4, 66). In addition, P(C−) is more attenuated than CF170S in the respiratory tracts of hamsters and AGMs (4). We first sought to compare the numbers of genes that were differentially expressed by infection with wt HPIV1 and HPIV1 C mutant viruses to assess the role of the C proteins in controlling the host response to viral infection. Therefore, the number of significantly differentially regulated genes (fourfold cutoff, P < 0.01) in A549 cells infected with either the CF170S or the P(C−) mutant was compared to that with wt HPIV1 infection or IFN-β treatment. Surprisingly, infection with CF170S or P(C−) altered the expression of a substantially greater number of genes than wt HPIV1 infection or IFN-β treatment. Specifically, taking all of the time points into consideration, the CF170S mutant significantly induced 1,734 genes and suppressed 690 genes, whereas P(C−) induced 1,430 genes and suppressed 170 genes by 48 h p.i. In contrast, wt HPIV1 significantly induced 281 genes and suppressed 3 genes (Fig. 2). This indicates the profound effect the C proteins have on suppression of the host cell response to HPIV1 infection.
Treatment with IFN-β differentially induced 190 genes and suppressed only one expressed sequence tag at 6 h and/or 24 h posttreatment, based on a fourfold or greater change compared to expression with mock treatment, for a total of 191 IFN-β-responsive genes (Fig. 2). For comparison, previous microarray-based studies that surveyed only a fraction of the human genome identified 14, 56, and 268 genes whose expression changed 10-fold, 4-fold, and 2-fold, respectively, in IFN-β-treated HT1080 human fibrosarcoma cells by 6 h and 42 genes whose expression changed 5-fold in IFN-α-treated A549 cells by 24 h (10, 20, 56). Interestingly, to the best of our knowledge, 66 of the 190 induced genes whose expression changed fourfold or greater in the present study have not previously been described as IFN regulated (see Table S1 in the supplemental material) (10, 20, 56).
Pairwise comparisons of the change in global gene expression (i.e., the entire microarray) were conducted for CF170S versus wt HPIV1, P(C−) versus wt HPIV1, and CF170S versus P(C−) at 6, 12, 24, and 48 h p.i. (Fig. 3). In this comparison, each gene is represented by a single dot, and the accumulation of dots along the center diagonal line in each plot in Fig. 3 indicates similar changes (n-fold) between the viruses represented on the x and y axes, whereas the two outer lines indicate a fourfold difference. This comparison of the kinetics of the cellular response to infection showed that global gene expression in cells infected with CF170S or P(C−) at 6 and 12 h p.i. did not differ significantly from that of wt HPIV1-infected cells (Fig. 3, 6 h and 12 h). Points deviate from the central diagonal at only 24 h and/or 48 h p.i., especially when either of the C mutant viruses is compared to the wt, due to the potent effects of infection with mutant viruses that are unable to suppress the cellular response to viral infection. By 24 h p.i., a significant proportion of genes were either up- or downregulated more than fourfold in both the CF170S and P(C−) groups, as indicated by the number of dots outside the two outer boundaries that run parallel to the diagonal, while wt HPIV1 virus did not have this effect (Fig. 3, 24 h). At 48 h p.i., this difference in gene expression between each of the C mutants and wt HPIV1 was even more pronounced. It was also important to compare transcriptional patterns between the two C mutant viruses in order to investigate why the complete deletion of the C gene conferred a greater level of attenuation and an apoptotic phenotype, in contrast to CF170S. Surprisingly, there was no apparent difference in global gene expression between the CF170S- and P(C−)-infected cells, with the exception of a slightly more pronounced gene induction in P(C−)-infected cells at 24 h p.i. (Fig. 3, right). However, none of the genes differed fourfold or more in expression between these two C mutant viruses. Because of the remarkable lack of obvious differential gene expression between CF170S- and P(C−)-infected cells, the sequence identity of CF170S or P(C−) was confirmed in the supernatant of the respective cell cultures used in the RNA extraction for gene expression analysis (data not shown).
FIG. 3.

Pairwise comparisons of levels of global gene expression in A549 cells indicate that the CF170S and P(C−) viruses induce highly similar host cell responses that differ greatly from the wt HPIV1-induced response. Each plot depicts the geometric mean difference for individual transcripts (represented by dots) from triplicate samples in pairwise comparisons of cells infected with CF170S versus the wt, P(C−) versus the wt, and CF170S versus P(C−) at 6, 12, 24, and 48 h p.i. The central diagonal line indicates similar changes (n-fold) for both members of the virus pair under comparison; the outer boundaries indicate a fourfold change.
The observation that there was not a single gene that differed with statistical significance by fourfold or more between the two C mutant viruses at any time point might seem inconsistent with the data shown in Fig. 2, where, for example, the overall numbers of genes that were differentially regulated for each C mutant virus versus the mock-treated control were 1,600 for the P(C−) virus and 2,421 for the CF170S mutant, a difference of 821 genes. This apparent discrepancy can be reconciled by constructing a Venn diagram and inspecting the genes that are differentially expressed only by P(C−) infection compared to mock infection or only by CF170S infection compared to mock infection (see Fig. S1 in the supplemental material). The difference in the numbers of differentially regulated genes, i.e., 821, between the P(C−) and CF170S groups compared to the mock infection group does not accurately represent the total numbers of genes that were differentially expressed between the two C mutant viruses because not every one of the 1,600 genes that was differentially expressed by P(C−) infection was also differentially expressed by CF170S infection. The numbers of genes that are differentially expressed during P(C−) or CF170S infection compared to mock infection can be grouped into three sets: 169 genes that were altered by P(C−) infection only, 990 genes that were altered by CF170S infection only, and 1,431 genes that were altered by both C mutant infections (see Fig. S1 in the supplemental material). Thus, in total, there were 1,159 genes that were identified as differentially expressed during infection with one C mutant but not the other compared to mock infection. Of these 1,159 genes, none was significantly differentially expressed fourfold or more between the two viruses, suggesting that the differences were small and generally in the same direction, as indicated in the examples given in Table 1. Thus, changes and statistical filters that compared the two mutant viruses directly were needed to identify genes that differed significantly so that subsequent functional bioinformatics analyses could be performed (Table 2; also see Fig. S3 in the supplemental material).
TABLE 1.
Ten representative genes identified as differentially expressed by P(C−) infection only or CF170S infection only compared to mock infectiona
| Group | Agilent probe IDb | Fold changec
|
|||||||||||
|---|---|---|---|---|---|---|---|---|---|---|---|---|---|
| CF170S
|
P(C−)
|
Ratio of CF170S to P(C−)
|
|||||||||||
| 6 h | 12 h | 24 h | 48 h | 6 h | 12 h | 24 h | 48 h | 6 h | 12 h | 24 h | 48 h | ||
| CF170S infection only vs mock infection | A_32_P63162 | 1.1 | 1.2 | 2.2 | 4.9 | 1.2 | 1.2 | 2.8 | 3.6 | 0.9 | 1.0 | 0.8 | 1.4 |
| A_32_P60632 | 0.8 | 0.8 | 1.8 | 5.2 | 1.0 | 1.0 | 2.8 | 3.2 | 0.8 | 0.8 | 0.7 | 1.6 | |
| A_32_P40476 | 1.2 | 1.3 | 1.7 | 4.1 | 1.2 | 1.1 | 2.4 | 3.0 | 1.0 | 1.2 | 0.7 | 1.3 | |
| A_32_P36582 | 1.1 | 1.1 | 1.7 | 5.1 | 1.4 | 1.3 | 3.7 | 3.1 | 0.8 | 0.9 | 0.5 | 1.7 | |
| A_32_P225870 | 1.5 | 1.4 | 2.1 | 4.7 | 1.4 | 1.3 | 2.4 | 3.9 | 1.1 | 1.0 | 0.9 | 1.2 | |
| P(C−) infection only vs mock infection | A_32_P171043 | 0.6 | 0.7 | 1.3 | 3.7 | 0.8 | 0.8 | 1.2 | 4.6 | 0.8 | 0.9 | 1.1 | 0.8 |
| A_32_P192354 | 1.2 | 1.1 | 1.7 | 3.6 | 1.5 | 0.8 | 2.5 | 4.9 | 0.8 | 1.3 | 0.7 | 0.7 | |
| A_24_P932706 | 0.9 | 0.9 | 1.3 | 3.9 | 1.0 | 0.9 | 1.6 | 4.8 | 0.9 | 1.0 | 0.8 | 0.8 | |
| A_24_P820087 | 1.0 | 1.0 | 3.9 | 3.5 | 0.8 | 1.2 | 3.3 | 5.9 | 1.2 | 0.8 | 1.2 | 0.6 | |
| A_23_P216071 | 0.8 | 0.9 | 1.2 | 3.8 | 0.9 | 1.0 | 1.4 | 4.5 | 0.9 | 0.9 | 0.9 | 0.8 | |
Five representative genes each were taken from the 990 genes and 169 genes in the groups subjected to CF170S infection only versus mock infection and P(C−) infection only versus mock infection, respectively, shown as the nonoverlapping region in the Venn diagram from Fig. S1 in the supplemental material.
ID, identification.
Values in boldface type indicate >4-fold increases in gene induction and the ratio of gene expression between CF170S and P(C−) at 48 h p.i.
TABLE 2.
Numbers of genes differentially expressed between CF170S and P(C−), as determined by significance criteriaa
| Statisticb | Fold change | Time p.i. (h) | No. of genes differentially expressed |
|---|---|---|---|
| t test with MTC | 4 | 6 | 0 |
| 12 | 0 | ||
| 24 | 0 | ||
| 48 | 0 | ||
| Overall | 0 | ||
| ANOVAc with MTC | 4 | Overall | 18 |
| t test with MTC | 2 | 6 | 0 |
| 12 | 0 | ||
| 24 | 2 | ||
| 48 | 0 | ||
| Overall | 2d | ||
| t test with MTC | 2e | 6 | 0 |
| 12 | 1 | ||
| 24 | 13 | ||
| 48 | 14 | ||
| Overall | 28 | ||
| t test with MTC | 1.5 | 6 | 0 |
| 12 | 0 | ||
| 24 | 2 | ||
| 48 | 0 | ||
| Overall | 2 |
Statistical tests (P < 0.01) were performed on genes at various cutoffs (n-fold changes) between CF170S and P(C−) infections.
MTC, Benjamini-Hochberg multiple testing correction.
Two-way analysis of variance (ANOVA) results are shown in Fig. S4 and Table S7 in the supplemental material.
These two genes are included within the 28 genes identified when the change cutoff was applied prior to statistical testing.
A twofold cutoff was applied prior to statistical testing with multiple testing correction.
Organization of genes that are differentially regulated in wt and mutant HPIV1 and in IFN-β treatment groups into hierarchical clusters.
We further analyzed those genes that were differentially regulated (fourfold or greater difference, P < 0.01 with multiple testing correction) in any of the four treatment groups [wt HPIV1, CF170S, P(C−), and IFN-β] versus the mock-treated control at any time point. These genes, which numbered 2,612, were subjected to pairwise comparisons among the three virus treatment groups, with analysis of each time point separately, in order to identify virus-to-virus differences that might account for phenotypic differences. Of the 2,612 genes, 1,238 were differentially regulated in at least one pairwise comparison between any two virus groups at the same time point. Consistently with the analysis from Fig. 3, we did not identify a single gene that was significantly differentially expressed between CF170S and P(C−) infection when using a fourfold cutoff and multiple testing correction. The 1,238 genes included all but 76 of the 191 IFN-β-responsive genes detected in this study; therefore, these additional 76 genes were added to the comparison to allow the full complement of IFN-β-responsive genes to serve as a benchmark for the analysis of a possible transcriptional basis for the phenotypic differences seen among wt HPIV1, CF170S, and P(C−) infections and also to permit an analysis of the behavior of IFN-responsive genes during infection with the HPIV1 C protein mutants. The total of 1,314 genes were hierarchically clustered into groups A to H based on similarities in gene expression kinetics and magnitude, as described for Fig. 1 (Fig. 4, columns I and II; also see Table S2 in the supplemental material).
FIG. 4.

Infection of A549 cells with CF170S or P(C−) drastically alters the expression of a large number of genes involved in diverse cellular functions. A total of 1,238 genes that were differentially expressed at 6, 12, 24, and 48 h p.i. following infection with CF170S, P(C−), and wt viruses were combined with 76 genes that were differentially regulated at 6 or 24 h after IFN-β treatment and subjected to hierarchical clustering based on similarity of expression kinetics and magnitude of expression, as described in the legend to Fig. 1, yielding eight clusters (A through H). (Column I) As for Fig. 1, the clusters are depicted by a hierarchical clustering matrix, with the columns representing treatment and time point (hours p.i.) and the rows indicating individual transcripts, with representative transcripts identified to the right. The number of genes in each cluster is given in parentheses. (Column II) The geometric mean gene expression profiles for clusters A through H are shown in panels A through H, respectively, with the geometric mean gene expression (y axis) plotted against each treatment condition at the indicated time points (in hours p.i.) (x axis). (Column III) Functional pathways that are overrepresented in clusters A through H were determined using Ingenuity Pathway Analysis and are indicated on the left, next to the expression profile of the respective cluster. TFBSs that are overrepresented among the genes within each cluster were identified using oPOSSUM to search the JASPAR core database. Ag, antigen.
Cluster F represented a distinct group of 223 mRNAs that individually were responsive to most or all of the four treatments [IFN-β, CF170S, P(C−), or wt HPIV1] (Fig. 4, column I; also see Table S2 in the supplemental material). Cluster F included most of the 191 IFN-β-responsive genes detected in this study. Cluster F is similar, but not identical, to cluster A shown in Fig. 1. In addition, the majority of genes in cluster C of Fig. 1, which were upregulated predominantly by IFN-β treatment and not at all by wt HPIV1 infection, are found in cluster F of Fig. 4. The expression of 16 of these 17 genes was significantly more highly induced by infection with the C mutant viruses beginning at 24 h p.i. (see Table S1 versus Table S2 in the supplemental material). Paradoxically, the remaining gene, namely, angiotensinogen (AGT), in this group of 17 was downregulated by the C mutant viruses even though it was induced by IFN-β. This is an indication that the effects of the C proteins are more complex than a general inhibition of IFN production and signaling. For the genes in cluster F as a whole, the mean change induced by IFN-β was approximately threefold at 6 h and approximately eightfold at 24 h (Fig. 4, column II, cluster F). Infection with wt HPIV1 induced a delayed response that, at 48 h p.i., was similar in magnitude to the IFN-β-induced response at 24 h, whereas CF170S and P(C−) induced a far earlier and greater response than wt HPIV1 that equaled or exceeded that of IFN-β. By 24 h p.i., CF170S and P(C−) induced on average a greater than 10-fold upregulation of cluster F gene expression, exceeding the response induced by IFN-β treatment for 24 h (Fig. 4, column II, cluster F). Among the genes within cluster F, genes involved in IFN signaling, antigen presentation, ubiquitination, and Toll-like receptor signaling were overrepresented. As expected, ISGF3, IRF1, and IRF3 TFBSs were overrepresented within the upstream promoter sequences of cluster F genes (Fig. 4, column III, cluster F). Virtually every member of cluster F was induced much earlier and to a greater extent by the CF170S and P(C−) mutants than by wt HPIV1, suggesting that functional C proteins are crucial in suppressing the transcription of antiviral genes within this cluster.
The remaining seven gene clusters (Fig. 4, column ΙΙ) contained only a few IFN-β-responsive genes and consisted mainly of genes that were differentially expressed between virus groups. Genes in clusters A, B, and C shared three features: (i) they were not significantly upregulated by IFN-β, (ii) they were upregulated by all three viruses, and (iii) the increase in upregulation was much greater for the C mutant viruses than for wt HPIV1. Nonetheless, each cluster exhibited a clear difference in kinetics or magnitude of the upregulation of expression. The 337 genes in cluster A, on average, were induced strongly following infection with either C mutant within 12 h and to a much more limited and delayed degree following wt HPIV1 infection (Fig. 4, columns I and II, cluster A). The 102 genes in cluster B shared a similar expression profile. However, infection with P(C−) upregulated cluster B gene expression at 24 h p.i. to an even higher level than in cluster A, and expression was maintained at that level through 48 h p.i. In cluster B, wt HPIV1 infection led to a slightly more pronounced average gene induction at 48 h than in cluster A (Fig. 4, column II, cluster B). Cluster A included genes involved in the p38 MAPK, NF-κB, p53, and death receptor pathways, while genes involved in death receptor, IL-6, and apoptosis pathways were overrepresented in cluster B (Fig. 4, column III, clusters A and B). Overrepresentation of TFBSs suggested a role for forkhead transcription factors FOXD1 and FOXD3 in the regulation of cluster A genes and for c-REL, RELA, and NF-κB1 in the regulation of cluster B genes (Fig. 4, column III, clusters A and B). The specific functions of FOXD1 and FOXD3 have not yet been well defined, but the family of forkhead transcription factors are best known for their role in regulating cellular development and differentiation (52). The 334 genes in cluster C behaved similarly to those in clusters A and B, but the magnitude of expression was less than that in clusters A and B, and overrepresentation of only one functional pathway (lipid metabolism) was found in this large cluster of genes (Fig. 4, column III, cluster C). Clearly, functional C proteins partially suppress the activation of genes in clusters A, B, and C.
Cluster D stood out because of its small size (only nine genes were assigned to this cluster) and because these genes were upregulated rapidly and to a very high level following wt or mutant HPIV1 infection. These findings indicate that wt C proteins permit the activation of these nine genes. However, since the level of expression of these genes is slightly lower in the wt-infected group than in the mutant HPIV1-infected groups, this indicates that the C proteins can have a quantitative effect on modulating the overall level of gene induction in response to viral infection (Fig. 4, column II, cluster D). Cluster D included mRNAs encoding IL-6, IFN-β, and IL-28A/IFN-λ2 and the chemokines CX3CL1, CCL2, and CCL5 (Fig. 4, columns I to III, cluster D). c-REL TFBSs were overrepresented in this set of genes. Cluster D genes contrast with those in clusters E and G, which fail to activate during wt HPIV1 infection.
The 25 genes in cluster E and the 48 genes in cluster G were induced at a relatively low level and only late following infection with CF170S or P(C−) but not at all following either wt HPIV1 infection or IFN-β treatment (Fig. 4, column II, clusters E and G). The magnitudes of expression of the two clusters differed between 24 h and 48 h p.i., since after infection with the C mutant viruses, the average gene expression increased substantially for cluster E but remained flat or decreased for cluster G. The genes in cluster E were only marginally overrepresented in the lipid metabolism pathway, and none of the TFBSs were overrepresented in this cluster (Fig. 4, column II, cluster E). The 48 genes in cluster G, however, including proinflammatory genes (e.g., IL-1B) as well as inhibitors of inflammation (e.g., SOCS3), were overrepresented in the acute-phase response and the IL-10 pathway, with complex transcriptional regulation (Fig. 4, column III, cluster G). The transcription factors overrepresented in this cluster included FOXI1, zinc finger protein 42 (ZNF42), and FOXD1. ZNF42 and both forkhead transcription factors FOXI1 and FOXD1 are best known for regulating cellular development and differentiation (26, 52).
Lastly, cluster H included all of the genes downregulated by infection with CF170S or P(C−) (Fig. 4, column II, cluster H). Infection with either C mutant virus significantly suppressed the expression of the 234 genes in this cluster. Genes involved in xenobiotic, hydrocarbon, and cellular stress/protein metabolism pathways were overrepresented in this cluster, including genes encoding members of the cytochrome P450 superfamily, glutathione transferases, and UDP-glucuronosyltransferase. wt HPIV1 infection and IFN-β treatment had no effect on these genes. The only transcription factor statistically overrepresented was TCF1, also known as IFN production regulator factor, a protein that initially became known to control important liver-specific genes involved in metabolism but more recently was found to be expressed in lung tissue as well (59) (Fig. 4, column III, cluster H). The gene expression profile of cluster H suggests that the C proteins expressed by wt HPIV1 inhibit the suppression of cluster H gene expression.
Taken together, the analyses of global gene expression in A549 cells infected with wt HPIV1, CF170S, and P(C−) suggest that wt HPIV1 is able to control a large and diverse array of host genes involved in the recognition of nonself RNA and the initiation of an antiviral response. Ablation of HPIV1 C protein function, by mutation or deletion, allows for an innate response of epithelial cells that encompasses a multitude of biological processes, including IFN signaling, cell death, inflammation, and metabolic regulation. We have observed that infection with P(C−) rapidly induces apoptosis, which is not seen during infection with CF170S or wt HPIV1. The similarity of the host transcriptional responses to infection with CF170S and P(C−) was unexpected (Fig. 2, 3, and 4, column I), since the C proteins are multifunctional. We applied a principal-component analysis, using all genes on the microarrays to examine the level of similarity between treatments, and found that overall levels of gene expression during P(C−) and CF170S infection were highly similar (see Fig. S2 in the supplemental material). Furthermore, both C mutant viruses induced gene expression patterns that were significantly different from that for wt infection. This identifies a high degree of similarity between the global gene expression profiles of the two mutants, but it does not rule out the possibility that small, specific differences exist between the two mutants, as addressed below. One might have expected that the host cell response to infection with CF170S, the virus containing only a single point mutation in each of the four C proteins, would not be as dramatic as the response to infection with P(C−), the virus not encoding any of the C proteins.
RT-qPCR confirms microarray-based observations regarding differential gene expression.
In order to validate the kinetics of gene expression observed in the microarray study, five differentially expressed genes that encompassed a range of expression levels, kinetic patterns, and pathways representing all four treatment groups were selected for RT-qPCR analysis (Fig. 5). For all five mRNAs, the gene expression profiles determined by microarray analysis were generally confirmed by the RT-qPCR analysis, indicating that this microarray platform yielded reliable semiquantitative results when triplicate samples were used. However, the microarray-generated data underestimated the magnitude of expression compared to that determined by RT-qPCR by a factor of 10 to 1,000. This probably reflected the more limited dynamic range in microarray analyses and probe saturation with high mRNA levels, as reported previously in a comparison of expression levels determined by Northern blot analysis versus microarray analysis (18). However, the expression profiles derived from microarray data and RT-qPCR data, in general, followed the same trend over time. This confirmed that IRF7 and MX1 mRNAs were strongly induced by IFN-β treatment, whereas IFNΒ mRNA was only weakly induced, and that NFKB1 (transcription factor NF-κB p100/p52) and TRAF1 (TNF receptor-associated factor 1, involved in signal transduction) mRNAs were not induced at all by this treatment (Fig. 5). In addition, IRF7, NFKB1, and TRAF1 mRNAs were barely induced by wt HPIV1 infection but strongly induced by infection with either C mutant (Fig. 5). IFNΒ and MX1 mRNAs were also induced by wt HPIV1 infection but not as strongly as following CF170S or P(C−) infection, confirming the previous expression pattern observed for cluster D genes (Fig. 4, column II, cluster D).
FIG. 5.

Comparison of the kinetics and magnitudes of expression of representative genes quantified by microarrays versus RT-qPCR. An aliquot of the total RNA that was used for microarray analysis was reverse transcribed and amplified using TaqMan probes for (A) IFNB, (B) IRF7, (C) MX1, (D) NFKB1, and (E) TRAF1. These include both IFN-responsive (A, B, and C) and IFN-independent (D and E) genes. Values were normalized to that for the GAPDH endogenous control gene and are expressed as increases (n-fold) relative to the value for mock infection. Note that both axes are in logarithmic scale and that the qPCR data span a much larger dynamic range than the microarray data.
More detailed examination of the IFN pathway.
Since ablation of the function of IFN antagonist proteins results in the restriction of replication of many viruses in vivo (15, 66, 74) and since CF170S and P(C−) are attenuated in vivo but differ in their levels of replication, we took a closer look at individual genes in the IFN pathway to examine whether subtle differences in their expression levels in CF170S- and P(C−)-infected cells could explain the greater level of attenuation of P(C−). We examined the kinetics and magnitudes of expression of genes encoding type I IFNs and their receptors (Fig. 6A), as well as those of genes involved in IRF3 and IFN signaling (Fig. 6B). Since the numbers of genes in these pathways are large, only selected genes representative of most pathway members are presented. Interestingly, CF170S and P(C−) infection, but not wt HPIV1 infection or IFN-β treatment, induced the transcription of members of the family of IFNA genes, such as the IFNA4, -5, -8, -10, and -14 genes, but the expression of the type I IFN receptors IFNAR1 and IFNAR2 was not affected by any of the treatments (Fig. 6A).
FIG. 6.

The CF170S and P(C−) mutant viruses are similar with regard to expression of IFNs, IFN receptors, and IRF3-responsive genes. (A) Hierarchical clustering matrix of genes encoding IFNs and IFN receptors. (B) Hierarchical clustering matrix of genes encoding IRF3-responsive (first three entries) and ISGF3-responsive (all of the entries) genes. Treatment conditions and time points (hours p.i.) are indicated below the hierarchical clustering matrix. On the right, expression kinetics for four representative genes of each group are shown, with the geometric mean gene expression (y axis) plotted against each treatment condition at the indicated time points (in hours p.i.) (x axis), to illustrate the full range of differential gene expression.
IRF3 can induce a subset of antiviral effector molecules, such as IFIT1 (IFN-induced protein with tetratricopeptide repeats 1/ISG60), ISG15, and IFI44, in the absence of IFN-β. A hierarchical clustering matrix for these three genes is shown in Fig. 6B (top). These IRF3-regulated genes were more strongly induced in C mutant virus-infected cells than in wt HPIV1-infected or IFN-β-treated cells (see expression profile in Fig. 6B). Since IRF3 dimerization and activation occur upstream of IFN-β and ISGF3 signaling during viral infection, these genes would be induced more rapidly than genes that are only ISGF3 stimulated, but, later in infection, IFN stimulation would contribute to the expression of both sets of genes. A selection of genes that are only ISGF3 stimulated is shown in Fig. 6B (bottom) and indeed appears to be induced less rapidly than the IRF3-stimulated genes. For all of these genes, the expression profiles were highly similar in CF170S- and P(C−)-infected cells.
Throughout the time course, wt HPIV1 failed to induce ISGF3-responsive genes to a level comparable to that induced by CF170S or P(C−), consistent with the reduced expression of IFN (Fig. 6B). MX2 expression was completely suppressed for 24 h in the presence of wt C protein, whereas CF170S or P(C−) induced high levels of MX2 mRNAs by 24 h p.i. (Fig. 6B). Importantly, wt HPIV1-induced expression of IFN-β- and IRF3-responsive genes, including IRF7, ADAR, and PKR, was delayed, diminished, or completely absent even at 48 h p.i., compared to CF170S- or P(C−)-induced upregulation (Fig. 6B). Interestingly, CF170S or P(C−) infection upregulated these IFN-β- or IRF3-responsive genes far more than IFN-β treatment (Fig. 6B).
Changes in host cell transcription do not reflect the striking cytopathic effect induced by P(C−) infection.
P(C−) is a potent inducer of apoptosis in A549 cells, while CF170S and wt HPIV1 are not (4). We sought to examine individual genes in the apoptosis pathway to see if subtle differences in their expression levels in CF170S-, P(C−)-, and wt HPIV1-infected cells that might explain the apoptosis phenotype seen in cells infected with P(C−) could be detected. To do this, we looked at the kinetics and magnitudes of expression of individual genes in the extrinsic and intrinsic apoptosis pathways. Despite this prominent phenotypic difference, CF170S and P(C−) induced remarkably similar transcriptional profiles (Fig. 7). Both C mutant viruses upregulated the expression of the same death ligands and death receptors examined with highly similar kinetics and magnitudes (Fig. 7A and B). In addition, no difference in regulation of apoptosis inhibitors, such as BIRC3 and BIRC5 (baculoviral IAP repeat-containing proteins 3 and 5), BCL2A1 (BCL2-related protein A1), and MCL1 (myeloid cell leukemia 1), was found (Fig. 7C; also see Table S4 in the supplemental material). We also compared levels of gene expression in the intrinsic apoptosis pathway, for instance, for CASP9, DIABLO, and BAX, and again found no difference in gene expression induced by the C mutant viruses (see Table S5 in the supplemental material). As already noted, a direct comparison between CF170S and P(C−) at 6, 12, 24, or 48 h did not detect a single gene that differed fourfold or more between the two mutants (with a P value of <0.01 after multiple testing correction). We appreciate that the statistical criteria chosen are somewhat arbitrary and that we may have missed genes that differed between infections with the C mutant viruses due to the stringency of our original selection criteria. To detect subtle differences in gene expression profiles that could explain the marked cytopathic effect seen during P(C−) infection but not during CF170S infection, we tested severalfold-change cutoffs below the fourfold level (Table 2). While we were unable to find any genes that were differentially expressed between CF170S and P(C−) infections by use of a fourfold cutoff, we found 28 genes that differed significantly (P < 0.01) between the two C mutants by twofold if multiple testing correction was performed sequentially and not simultaneously with the change cutoff (see Fig. S3 and Table S6 in the supplemental material). Functional analysis revealed that 2 of these 28 genes are known mediators of cell death. Notably, caspase 3 was upregulated 6.5-fold with P(C−) infection at 24 h p.i., 2.8-fold greater than with CF170S infection. However, by 48 h p.i., caspase 3 expression during CF170S infection increased to 6.3-fold above the level during mock infection, whereas the upregulation of caspase 3 induced by P(C−) diminished to 4.1-fold. The second apoptosis-related gene, TNFRSF10B, or TRAIL receptor 2 (TRAIL-R2), is responsible for signaling through the extrinsic apoptosis pathway. Similarly to caspase 3, TNFRSF10B was upregulated 4.8-fold with P(C−) infection at 24 h p.i., 2.1-fold greater than that seen with CF170S infection. However, at 48 h p.i., levels of TNFRSF10B expression during CF170S and P(C−) infection were comparable. At 24 h p.i., TNFSF10 (TRAIL) itself was upregulated 50.9-fold by CF170S infection, 1.95-fold greater than that seen with P(C−) infection, although apoptosis was induced only during P(C−) infection (Fig. 7A). The earlier expression of TNFRSF10B and caspase 3 may contribute to the significant cytopathic effect observed during P(C−) infection at 48 h p.i., although the induction of TNFSF10 (TRAIL) itself was more pronounced in cells infected with CF170S, the C mutant virus that did not induce apoptosis.
FIG. 7.

The CF170S and P(C−) mutant viruses share remarkably similar expression profiles for genes associated with death ligands, death receptors, and apoptosis inhibitors, despite distinct cytopathic phenotypes. Shown are hierarchical clustering matrices and gene expression profiles comparing the levels of gene expression for death ligands (A), death receptors (B), and apoptosis inhibitors (C) following infection with wt HPIV1 or the indicated HPIV1 mutant or following IFN-β treatment. A significant difference between CF170S and P(C−) was not detected for any of the apoptosis-related genes depicted.
DISCUSSION
Microarray-based analyses are increasingly being used in virology and have helped to elucidate virus-host interactions for a number of viruses (reviewed in reference 30). Here, we performed a comprehensive analysis of the responses of a human respiratory epithelial cell line to HPIV1 infection and to IFN-β treatment. Microarray analyses have previously been applied to study infection by murine PIV1 (SeV) (12, 62). However, these studies had methodological issues that limited the ability to interpret the results, including that (i) human cells were infected with a murine virus, (ii) nonrespiratory cells were infected with a respiratory virus, (iii) mRNA levels were determined only at a single time point, (iv) customized arrays that included fewer than 1,000 genes and that focused on the IFN and antiviral pathways were used, and (v) the response to viral infection was not compared with the response to IFN treatment (12, 62). In the present study, gene expression kinetics following infection with a human respiratory virus or administration of IFN-β were determined across multiple time points in human respiratory epithelial cells, the natural target of HPIV1, by use of a microarray representing the entire human genome. We chose to analyze only genes whose expression was at least fourfold up- or downregulated, thereby excluding genes that were more modestly induced or suppressed by viral infection or IFN treatment. In order to avoid a subjective or biased analysis, functional bioinformatics tools were used to group thousands of differentially expressed genes into distinct hierarchical clusters and to identify functional pathways overrepresented in each cluster. oPOSSUM single-site analysis software was used to examine upstream sequences for predicted TFBSs within each hierarchical cluster (25, 57, 67), resulting in the identification of several key transcriptional regulatory pathways that are likely involved in the cellular response to HPIV1 infection.
As a first step in our analysis, we sought to identify genes that were differentially expressed as a result of wt HPIV1 infection. This set of genes was subsequently compared to the set of genes whose expression was altered by treatment with a physiological concentration of IFN-β, allowing us to segregate and analyze IFN-responsive genes separately from IFN-independent genes in the wt HPIV1 microarray data set. IFN-β treatment was chosen for comparison because A549 cells and human airway epithelial cells produce this IFN in response to HPIV1, whereas IFN-α is not secreted at all or is barely detectable. In agreement with previous reports that established the central role of the type I IFN response in innate antiviral immunity (9, 55), our clustering analysis indicated that approximately 60% of all genes induced late in infection with wt HPIV1 were also induced by IFN-β treatment. Specifically, 209 of the 343 genes were upregulated by both wt HPIV1 infection and IFN-β treatment (Fig. 1, clusters A, B, and D). These 209 genes were overrepresented in the IFN signaling, antigen presentation, and ubiquitination pathways, as well as in the Toll-like receptor and NF-κB pathways. However, wt HPIV1 upregulated an additional 129 genes that were not upregulated by IFN-β (Fig. 1, column I, cluster E). Many of these genes were also under the control of the family of IRF and NF-κB transcription factors and were involved in apoptosis signaling and inflammation. These data are in agreement with and expand on a previous report on the dominant role of IRF3- and NF-κB-regulated genes in the response of human embryonic kidney cells to SeV infection at 6 h (12). It can be concluded by inspection of the kinetic data that wt HPIV1 is able to silence the innate antiviral response for at least 6 to 12 h p.i. but that IFN-dependent and IFN-independent antiviral pathways are activated at later time points as part of the innate response to infection.
Next, we sought to determine the role of the HPIV1 C proteins in suppressing the antiviral response of respiratory epithelial cells by analyzing gene expression patterns following infection of A549 cells with two C mutant viruses. Previous studies had established a role for the HPIV1 C proteins and SeV C proteins as inhibitors of IFN induction and signaling, as well as inhibitors of apoptosis (19, 35, 38). Two mutant viruses, one with a single point mutation in C and one with a deletion of all four C proteins, CF170S and P(C−), respectively, were selected for this analysis. wt HPIV1 inhibits the induction of IFN and signaling of IFN through its receptor, but CF170S and P(C−) each fail to inhibit these two activities. In addition, P(C−) infection induces apoptosis, whereas CF170S and wt HPIV1 infections do not, and P(C−) is much more restricted in replication in AGMs than CF170S (3, 4, 66). Using the CF170S and P(C−) viruses, we sought to compare the host responses following infection with these mutants to that following wt HPIV1 infection. We found that, following infection with either C mutant virus, the number of differentially expressed genes expanded dramatically, implicating a critical role for the HPIV1 C proteins in blunting the host's antiviral response. Using whole-genome microarrays, we found that with CF170S infection, 392 and 2,322 genes were differentially regulated more than fourfold at 24 and 48 h p.i., respectively, while with wt HPIV1 infection, only 54 and 277 genes were differentially expressed at the same time points. Thus, approximately 1% of the over 41,000 unique probes analyzed in our study were altered by HPIV1-CF170S at 24 h p.i., and only 14% of that subset of genes were altered by wt HPIV1, indicating that the wt HPIV1 C proteins inhibited modulation of the majority of antiviral genes that would otherwise be upregulated or downregulated as a result of HPIV1 infection. Importantly, this striking suppression of gene expression was associated with mutation in the C proteins but not with differences in virus replication. CF170S and wt HPIV1 exhibited identical kinetics of replication in vitro, and although P(C−) was approximately 100-fold restricted in replication at 24 and 48 h p.i. compared to wt HPIV1 and CF170S (see Fig. S5 in the supplemental material), P(C−) infection was capable of suppressing gene expression just as well as CF170S infection. Strähle et al. examined gene expression in human fibrosarcoma cells 24 h p.i. in response to SeV-wt or SeV-CF170S infection by using a customized array designed to probe approximately 150 genes with overrepresentation of the IFN pathway (62). In their study, infection with SeV-CF170S at an MOI of 20 induced 15 of 150 genes (10%) more than twofold at 24 h p.i., while SeV-wt (Ohita M strain) failed to induce the expression of any gene. We also found that the expression of IFN-β-inducible genes was greater following infection with CF170S or P(C−) than following treatment with 300 pg/ml of IFN-β, the concentration of IFN induced by CF170S infection of A549 cells (66). The greater induction seen with C mutant infection is due in part to direct viral recognition by RIG-I-like receptors and subsequent activation of IRFs and NF-κB. Activated IRF3 not only stimulates the IFNB promoter to produce IFN-β but also can independently activate ISRE to augment the production of IFN-stimulated genes (ISGs). In contrast, the effect of exogenous IFN is limited to signaling through the IFN receptor and activation of the ISGF3 transcription factor complex to upregulate the expression of antiviral effectors and other ISGs. The wt C proteins likely block the RIG-I-like receptor and IFN signaling pathways, as evidenced by the lack of IRF3 and STAT activation and IFN production during infection with wt HPIV1, and this antagonism is ablated as a result of mutation or deletion of the HPIV1 C proteins (6, 66). In another similarly designed microarray study, Hartman et al. compared the host response to wt Ebola virus with the response to a highly attenuated Ebola virus containing a single amino acid change, namely, R312A, in the IRF3-inhibitory domain of VP35 (22). Like wt HPIV1, wt Ebola virus was remarkably effective in suppressing the activation of cellular antiviral and IFN-responsive genes. The single VP35R312A mutation in Ebola virus, however, reversed the inhibition of only 39 genes, whereas the single CF170S mutation in HPIV1 reversed the inhibition of over 2,000 genes (Fig. 2). The Ebola virus VP35 protein confers virulence during infection by inhibiting IRF3 activation and IFN-β production, whereas the VP24 protein inhibits STAT1 nuclear translocation and IFN signaling (21, 54). Unlike Ebola virus, which utilizes two separate viral proteins to antagonize IFN production and signaling, HPIV1 encodes the C proteins from a single gene segment that blocks both arms of the viral recognition and IFN pathways and probably suppresses the expression of many more genes than VP35 alone.
Following the comparison of levels of gene expression between wt HPIV1 and the two C mutant viruses, we next compared the cellular responses to CF170S and P(C−) infections to determine whether differences in gene expression profiles were associated with the observed differences in the mutants' apoptosis and attenuation phenotypes. Surprisingly, the cellular response to CF170S infection was comparable to the response to P(C−) infection, both qualitatively and quantitatively (Fig. 4). Although the microarray-based analysis may have missed differences between CF170S and P(C−) due to a decreased sensitivity compared to that of RT-qPCR, this limitation occurred only with very highly upregulated genes, where gene induction is already qualitatively clear. For example, IFNB, which was induced 853,062-fold as measured by RT-qPCR and 628-fold by microarray analysis, showed 1,358-fold greater sensitivity by qPCR due to saturation of the IFNB probe on the microarray. However, less strongly upregulated genes, such as NFKB1, which was induced 68-fold as measured by RT-qPCR and 11-fold by microarray analysis, showed only 6-fold greater sensitivity in detecting differential expression. The difference is significantly less pronounced since genes that are upregulated less do not suffer as much from microarray probe saturation. Thus, although the microarray-based analysis may have missed small differences in gene expression between viruses, we have shown that both technologies have comparable sensitivities at lower expression levels. Based on the phenotypic differences between the two mutants, with P(C−) being the more attenuated in vivo and a strong inducer of apoptosis in vitro, we expected to find transcriptional differences in at least the apoptosis pathway. However, not a single mRNA was differentially expressed by use of our predefined criteria, i.e., a fourfold change and a P value of <0.01. To detect any subtle differences between infections with the two C mutant viruses, we tested severalfold-change cutoffs. After relaxing our change cutoff to twofold and subsequently performing a t test with multiple testing correction, we identified two genes, caspase 3 and the TRAIL receptor 2 (TNFRSF10B), that could potentially contribute to P(C−)-induced apoptosis. P(C−) infection upregulated both genes earlier, at 24 h p.i., than CF170S infection. However, in both cases, the magnitude of upregulation during CF170S infection caught up by 48 h p.i., and the TRAIL ligand (TNFSF10) itself was induced at comparable levels by both viruses at 24 h p.i.
It was surprising that the CF170S mutant, which contains a single point mutation at amino acid 170 of the C protein, induced a transcriptional profile that was almost indistinguishable from that induced by the P(C−) mutant, a virus that does not express any of the C genes. Although P(C−) infection induces apoptosis much more rapidly and extensively than CF170S (4), the expression kinetics of death ligands, death receptors, or antiapoptotic factors that could account for P(C−)-induced cell death did not differ significantly by fourfold from those of CF170S at any time (Fig. 7A, B, and C). Since knockout of the C gene causes cell death whereas expression of the wt C gene does not, we hypothesized that the wt HPIV1 and CF170S C proteins prevented cell death through apoptosis inhibition, i.e., either through inhibition of proapoptotic pathways or through activation of antiapoptotic pathways. Previous studies of SeV suggested that a delicate balance between proapoptotic and antiapoptotic pathways during viral infection exists. SeV infection activates the cellular phosphatidylinositol 3-kinase pathway and, through AKT activation, prevents apoptosis (49). Thus, the differences in the apoptosis phenotypes of the two C mutants likely lie in the interaction of one or more of the C proteins of CF170S and wt HPIV1 with one or more constitutively expressed factors, which results in the suppression of the apoptosis response. Both wt C proteins and point-mutated C proteins could potentially activate apoptosis inhibitory proteins or antagonize proapoptotic proteins that would otherwise be triggered during HPIV1 infection. These two possibilities can be tested once the mechanism of interaction with the host apoptosis machinery has been defined. The greater level of attenuation of P(C−) than of CF170S likely reflects a contribution of apoptosis to the decreased replication of P(C−), but the loss of a yet-undefined function of C required for replication in vivo may contribute as well.
Although wt HPIV1 suppressed the upregulation of a broad array of cellular genes that were induced by P(C−) and CF170S infection, global shutoff of host transcription did not occur. In fact, only 234 of 2,612 differentially expressed genes were downregulated (Fig. 4, panel II, cluster H). Interestingly, both C mutant viruses downregulated these genes to a greater extent than wt HPIV1 (see Table S2 in the supplemental material). Thus, the wt C proteins blunted both induction and suppression of a specific set of host genes that would otherwise react to viral infection. This is in stark contrast to what has been described for vesicular stomatitis virus, which shuts down transcription globally through M protein-mediated inhibition of the three cellular RNA polymerases I, II, and III (1, 69), or for Rift Valley fever virus, which, through inhibition of TFIIH transcription factor complex assembly via its NS proteins, leads to the rapid destabilization of host cellular RNA synthesis (40). However, other members of the order Mononegavirales, such as the Marburg and Ebola filoviruses, suppress the antiviral and type I IFN responses without shutting down host cell functions globally, and the degree of antiviral suppression by these viruses seems to correlate with virulence in vivo (34). Similarly, our data indicate that wt HPIV1 C protein function, i.e., suppression of antiviral pathways early in infection, is an important virulence factor and that the loss of this activity in both CF170S and P(C−) leads to attenuation in vivo.
Following the global analysis of virus-modulated pathways, we attempted a more detailed analysis of the IFN and apoptotic pathways in order to understand the different in vivo and in vitro phenotypes of wt HPIV1, P(C−), and CF170S. We found that by 48 h p.i., wt HPIV1 induced IFNB expression 180-fold as measured by microarray and 1,200-fold as measured by qPCR (Fig. 5A). Previously, we reported that IFNB mRNA was not detectable at any time point in response to HPIV1 infection (66). Reexamination of that data identified a 5,600-fold induction of IFNB mRNA following CF170S infection versus a 12-fold induction following wt HPIV1 infection at 48 h p.i., i.e., a 458-fold reduction in IFNB transcription following wt HPIV1 infection compared to that following CF170S infection (66). In the present study, CF170S induced 695 times more IFNB mRNA than wt HPIV1 at 48 h p.i., confirming that IFNB mRNA is strongly induced by CF170S but not by wt HPIV1 (see Table S3 in the supplemental material). At the protein level, we previously were unable to detect IFN-β in the supernatant of wt HPIV1-infected A549 cells by IFN bioassay, not even after 96 h p.i. (66). In contrast, Bousse et al. detected 380 IU/ml of IFN-β by enzyme-linked immunosorbent assay in MRC-5 cells 48 h p.i. with wt HPIV1 strain C-35 (GenBank accession no. M74081) (6). This difference in IFN-β secretion could be due to the use of different cell lines (MRC-5 versus A549) and/or different virus strains. A protein sequence alignment of the C protein of the C-35 strain of HPIV1 used by Bousse et al. with our Washington 1964 wt HPIV1 strain revealed a CQ38P substitution in the C gene that could potentially be responsible for a distinct IFN phenotype. The CF170S virus serves as an example for the role a single amino acid substitution in the C protein can potentially have in the IFN phenotype. Importantly, the deficient IFN-β response of A549 cells to wt HPIV1 infection was also seen in primary human airway epithelial cell cultures, confirming the IFN production deficiency of respiratory epithelial cells infected with wt HPIV1 (5).
One aim of this project was to identify cellular pathways that are targeted by the HPIV1 C proteins and to define how the C proteins exert such impressive transcriptional control of the host's innate immune system. We analyzed the gene expression profiles for all 14 transcription factors identified by bioinformatics analysis (see Fig. S6 in the supplemental material) and found that the expression levels of four genes, IRF1, ISGF3G, NF-κB1, and c-Rel, were significantly upregulated increasingly over time, confirming the importance of the IRF3 and NF-κB signaling pathways during parainfluenza infection and furthermore providing a feed-forward mechanism to amplify the host transcriptional response to viral infection. We expected to identify IRF and NF-κB TFBSs overrepresented in genes induced by IFN treatment and HPIV1 infection, but other unexpected TFBSs were also identified. For example, FOXD1 and FOXD3 TFBSs were identified in genes upregulated by the HPIV1 C mutant viruses. Only recently has an important role for FoxD1 in the regulation of immune activation through the NF-κB pathway been identified (42). FoxD3 is well known for controlling cellular differentiation, but no role for FoxD3 in the regulation of the immune response or the response to viral infection has yet been defined. In future work, it will be important to define how the HPIV1 C proteins modify the activities of FOXD1, FOXD3, and other transcription factors and how C′, C, Y1, and Y2 differ in their abilities to alter transcriptional activity.
In summary, the HPIV1 C proteins exert remarkable control over the cellular transcriptional response to viral infection, indicating that the C proteins are important virulence factors for HPIV1. Mutations within the C gene permit the activation of a broad array of cellular genes involved in the type I IFN, IRF3, and NF-κB pathways that would otherwise be repressed by HPIV1 infection, and these mutations specify an attenuation phenotype in vivo. However, the lack of a clear differential regulation of antiapoptotic and proapoptotic genes in P(C−)- and CF170S-infected cells allows for two models of P(C−)-induced apoptosis that could individually, or in combination, play a key role in determining the apoptosis phenotype of HPIV1 infection: (i) earlier expression of TNFRSF10B and caspase 3 and (ii) alterations in posttranslational events involving constitutively expressed cellular proapoptotic or antiapoptotic factors.
Supplementary Material
Acknowledgments
We thank John Kash, Jeffrey Taubenberger, Anne Schaap Nutt, Ann-Marie Cruz, and Sonja Surman for careful reading of the manuscript and helpful discussions.
This project was funded as a part of the NIAID Intramural Program. J.B.B. was supported by funding from the Howard Hughes Medical Institute.
Footnotes
Published ahead of print on 3 December 2008.
Supplemental material for this article may be found at http://jvi.asm.org/.
REFERENCES
- 1.Ahmed, M., and D. S. Lyles. 1998. Effect of vesicular stomatitis virus matrix protein on transcription directed by host RNA polymerases I, II, and III. J. Virol. 728413-8419. [DOI] [PMC free article] [PubMed] [Google Scholar]
- 2.Alexopoulou, L., A. C. Holt, R. Medzhitov, and R. A. Flavell. 2001. Recognition of double-stranded RNA and activation of NF-kappaB by Toll-like receptor 3. Nature 413732-738. [DOI] [PubMed] [Google Scholar]
- 3.Bartlett, E. J., E. Amaro-Carambot, S. R. Surman, P. L. Collins, B. R. Murphy, and M. H. Skiadopoulos. 2006. Introducing point and deletion mutations into the P/C gene of human parainfluenza virus type 1 (HPIV1) by reverse genetics generates attenuated and efficacious vaccine candidates. Vaccine 242674-2684. [DOI] [PubMed] [Google Scholar]
- 4.Bartlett, E. J., A.-M. Cruz, J. Esker, A. Castaño, H. Schomacker, S. R. Surman, M. Hennessey, J. Boonyaratanakornkit, R. J. Pickles, P. L. Collins, B. R. Murphy, and A. C. Schmidt. 2008. Human parainfluenza virus type 1 C proteins are nonessential proteins that inhibit the host interferon and apoptotic responses and are required for efficient replication in nonhuman primates. J. Virol. 828965-8977. [DOI] [PMC free article] [PubMed] [Google Scholar]
- 5.Bartlett, E. J., M. Hennessey, M. H. Skiadopoulos, A. C. Schmidt, P. L. Collins, B. R. Murphy, and R. J. Pickles. 2008. Role of interferon in the replication of human parainfluenza virus type 1 wild type and mutant viruses in human ciliated airway epithelium. J. Virol. 828059-8070. [DOI] [PMC free article] [PubMed] [Google Scholar]
- 6.Bousse, T., R. L. Chambers, R. A. Scroggs, A. Portner, and T. Takimoto. 2006. Human parainfluenza virus type 1 but not Sendai virus replicates in human respiratory cells despite IFN treatment. Virus Res. 12123-32. [DOI] [PubMed] [Google Scholar]
- 7.Counihan, M. E., D. K. Shay, R. C. Holman, S. A. Lowther, and L. J. Anderson. 2001. Human parainfluenza virus-associated hospitalizations among children less than five years of age in the United States. Pediatr. Infect. Dis. J. 20646-653. [DOI] [PubMed] [Google Scholar]
- 8.Curran, J., J. B. Marq, and D. Kolakofsky. 1992. The Sendai virus nonstructural C proteins specifically inhibit viral mRNA synthesis. Virology 189647-656. [DOI] [PubMed] [Google Scholar]
- 9.De Maeyer, E., and J. De Maeyer-Guignard. 1998. Type I interferons. Int. Rev. Immunol. 1753-73. [DOI] [PubMed] [Google Scholar]
- 10.Der, S. D., A. Zhou, B. R. Williams, and R. H. Silverman. 1998. Identification of genes differentially regulated by interferon alpha, beta, or gamma using oligonucleotide arrays. Proc. Natl. Acad. Sci. USA 9515623-15628. [DOI] [PMC free article] [PubMed] [Google Scholar]
- 11.Eisen, M. B., P. T. Spellman, P. O. Brown, and D. Botstein. 1998. Cluster analysis and display of genome-wide expression patterns. Proc. Natl. Acad. Sci. USA 9514863-14868. [DOI] [PMC free article] [PubMed] [Google Scholar]
- 12.Elco, C. P., J. M. Guenther, B. R. Williams, and G. C. Sen. 2005. Analysis of genes induced by Sendai virus infection of mutant cell lines reveals essential roles of interferon regulatory factor 3, NF-κB, and interferon but not Toll-like receptor 3. J. Virol. 793920-3929. [DOI] [PMC free article] [PubMed] [Google Scholar]
- 13.Fitzgerald, K. A., S. M. McWhirter, K. L. Faia, D. C. Rowe, E. Latz, D. T. Golenbock, A. J. Coyle, S. M. Liao, and T. Maniatis. 2003. IKKepsilon and TBK1 are essential components of the IRF3 signaling pathway. Nat. Immunol. 4491-496. [DOI] [PubMed] [Google Scholar]
- 14.Forster, J., G. Ihorst, C. H. Rieger, V. Stephan, H. D. Frank, H. Gurth, R. Berner, A. Rohwedder, H. Werchau, M. Schumacher, T. Tsai, and G. Petersen. 2004. Prospective population-based study of viral lower respiratory tract infections in children under 3 years of age (the PRI.DE study). Eur. J. Pediatr. 163709-716. [DOI] [PubMed] [Google Scholar]
- 15.Garcia-Sastre, A., and C. A. Biron. 2006. Type 1 interferons and the virus-host relationship: a lesson in detente. Science 312879-882. [DOI] [PubMed] [Google Scholar]
- 16.Garcin, D., J. Curran, and D. Kolakofsky. 2000. Sendai virus C proteins must interact directly with cellular components to interfere with interferon action. J. Virol. 748823-8830. [DOI] [PMC free article] [PubMed] [Google Scholar]
- 17.Garcin, D., M. Itoh, and D. Kolakofsky. 1997. A point mutation in the Sendai virus accessory C proteins attenuates virulence for mice, but not virus growth in cell culture. Virology 238424-431. [DOI] [PubMed] [Google Scholar]
- 18.Geiss, G., G. Jin, J. Guo, R. Bumgarner, M. G. Katze, and G. C. Sen. 2001. A comprehensive view of regulation of gene expression by double-stranded RNA-mediated cell signaling. J. Biol. Chem. 27630178-30182. [DOI] [PubMed] [Google Scholar]
- 19.Gotoh, B., K. Takeuchi, T. Komatsu, J. Yokoo, Y. Kimura, A. Kurotani, A. Kato, and Y. Nagai. 1999. Knockout of the Sendai virus C gene eliminates the viral ability to prevent the interferon-alpha/beta-mediated responses. FEBS Lett. 459205-210. [DOI] [PubMed] [Google Scholar]
- 20.Grandvaux, N., M. J. Servant, B. tenOever, G. C. Sen, S. Balachandran, G. N. Barber, R. Lin, and J. Hiscott. 2002. Transcriptional profiling of interferon regulatory factor 3 target genes: direct involvement in the regulation of interferon-stimulated genes. J. Virol. 765532-5539. [DOI] [PMC free article] [PubMed] [Google Scholar]
- 21.Hartman, A. L., B. H. Bird, J. S. Towner, Z.-A. Antoniadou, S. R. Zaki, and S. T. Nichol. 2008. Inhibition of IRF-3 activation by VP35 is critical for the high level of virulence of Ebola virus. J. Virol. 822699-2704. [DOI] [PMC free article] [PubMed] [Google Scholar]
- 22.Hartman, A. L., L. Ling, S. T. Nichol, and M. L. Hibberd. 2008. Whole-genome expression profiling reveals that inhibition of host innate immune response pathways by Ebola virus can be reversed by a single amino acid change in the VP35 protein. J. Virol. 825348-5358. [DOI] [PMC free article] [PubMed] [Google Scholar]
- 23.Hasan, M. K., A. Kato, M. Muranaka, R. Yamaguchi, Y. Sakai, I. Hatano, M. Tashiro, and Y. Nagai. 2000. Versatility of the accessory C proteins of Sendai virus: contribution to virus assembly as an additional role. J. Virol. 745619-5628. [DOI] [PMC free article] [PubMed] [Google Scholar]
- 24.Hornung, V., J. Ellegast, S. Kim, K. Brzozka, A. Jung, H. Kato, H. Poeck, S. Akira, K. K. Conzelmann, M. Schlee, S. Endres, and G. Hartmann. 2006. 5′-Triphosphate RNA is the ligand for RIG-I. Science 314994-997. [DOI] [PubMed] [Google Scholar]
- 25.Ho Sui, S. J., J. R. Mortimer, D. J. Arenillas, J. Brumm, C. J. Walsh, B. P. Kennedy, and W. W. Wasserman. 2005. oPOSSUM: identification of over-represented transcription factor binding sites in co-expressed genes. Nucleic Acids Res. 333154-3164. [DOI] [PMC free article] [PubMed] [Google Scholar]
- 26.Hromas, R., S. J. Collins, D. Hickstein, W. Raskind, L. L. Deaven, P. O'Hara, F. S. Hagen, and K. Kaushansky. 1991. A retinoic acid-responsive human zinc finger gene, MZF-1, preferentially expressed in myeloid cells. J. Biol. Chem. 26614183-14187. [PubMed] [Google Scholar]
- 27.Itoh, M., H. Hotta, and M. Homma. 1998. Increased induction of apoptosis by a Sendai virus mutant is associated with attenuation of mouse pathogenicity. J. Virol. 722927-2934. [DOI] [PMC free article] [PubMed] [Google Scholar]
- 28.Itoh, M., Y. Isegawa, H. Hotta, and M. Homma. 1997. Isolation of an avirulent mutant of Sendai virus with two amino acid mutations from a highly virulent field strain through adaptation to LLC-MK2 cells. J. Gen. Virol. 783207-3215. [DOI] [PubMed] [Google Scholar]
- 29.Janeway, C. A., Jr. 1989. Approaching the asymptote? Evolution and revolution in immunology. Cold Spring Harbor Symp. Quant. Biol. 541-13. [DOI] [PubMed] [Google Scholar]
- 30.Jenner, R. G., and R. A. Young. 2005. Insights into host responses against pathogens from transcriptional profiling. Nat. Rev. Microbiol. 3281-294. [DOI] [PubMed] [Google Scholar]
- 31.Karron, R. A., R. B. Belshe, P. F. Wright, B. Thumar, B. Burns, F. Newman, J. C. Cannon, J. Thompson, T. Tsai, M. Paschalis, S. L. Wu, Y. Mitcho, J. Hackell, B. R. Murphy, and J. M. Tatem. 2003. A live human parainfluenza type 3 virus vaccine is attenuated and immunogenic in young infants. Pediatr. Infect. Dis. J. 22394-405. [DOI] [PubMed] [Google Scholar]
- 32.Karron, R. A., M. Makhene, K. Gay, M. H. Wilson, M. L. Clements, and B. R. Murphy. 1996. Evaluation of a live attenuated bovine parainfluenza type 3 vaccine in two- to six-month-old infants. Pediatr. Infect. Dis. J. 15650-654. [DOI] [PubMed] [Google Scholar]
- 33.Karron, R. A., P. F. Wright, F. K. Newman, M. Makhene, J. Thompson, R. Samorodin, M. H. Wilson, E. L. Anderson, M. L. Clements, B. R. Murphy, et al. 1995. A live human parainfluenza type 3 virus vaccine is attenuated and immunogenic in healthy infants and children. J. Infect. Dis. 1721445-1450. [DOI] [PubMed] [Google Scholar]
- 34.Kash, J. C., E. Mühlberger, V. Carter, M. Grosch, O. Perwitasari, S. C. Proll, M. J. Thomas, F. Weber, H.-D. Klenk, and M. G. Katze. 2006. Global suppression of the host antiviral response by Ebola- and Marburgviruses: increased antagonism of the type I interferon response is associated with enhanced virulence. J. Virol. 803009-3020. [DOI] [PMC free article] [PubMed] [Google Scholar]
- 35.Kato, A., C. Cortese-Grogan, S. A. Moyer, F. Sugahara, T. Sakaguchi, T. Kubota, N. Otsuki, M. Kohase, M. Tashiro, and Y. Nagai. 2004. Characterization of the amino acid residues of Sendai virus C protein that are critically involved in its interferon antagonism and RNA synthesis down-regulation. J. Virol. 787443-7454. [DOI] [PMC free article] [PubMed] [Google Scholar]
- 36.Kato, H., O. Takeuchi, S. Sato, M. Yoneyama, M. Yamamoto, K. Matsui, S. Uematsu, A. Jung, T. Kawai, K. J. Ishii, O. Yamaguchi, K. Otsu, T. Tsujimura, C. S. Koh, C. Reis e Sousa, Y. Matsuura, T. Fujita, and S. Akira. 2006. Differential roles of MDA5 and RIG-I helicases in the recognition of RNA viruses. Nature 441101-105. [DOI] [PubMed] [Google Scholar]
- 37.Kawai, T., K. Takahashi, S. Sato, C. Coban, H. Kumar, H. Kato, K. J. Ishii, O. Takeuchi, and S. Akira. 2005. IPS-1, an adaptor triggering RIG-I- and Mda5-mediated type I interferon induction. Nat. Immunol. 6981-988. [DOI] [PubMed] [Google Scholar]
- 38.Koyama, A. H., H. Irie, A. Kato, Y. Nagai, and A. Adachi. 2003. Virus multiplication and induction of apoptosis by Sendai virus: role of the C proteins. Microbes Infect. 5373-378. [DOI] [PubMed] [Google Scholar]
- 39.Kurotani, A., K. Kiyotani, A. Kato, T. Shioda, Y. Sakai, K. Mizumoto, T. Yoshida, and Y. Nagai. 1998. Sendai virus C proteins are categorically nonessential gene products but silencing their expression severely impairs viral replication and pathogenesis. Genes Cells 3111-124. [DOI] [PubMed] [Google Scholar]
- 40.Le May, N., S. Dubaele, L. Proietti De Santis, A. Billecocq, M. Bouloy, and J. M. Egly. 2004. TFIIH transcription factor, a target for the Rift Valley hemorrhagic fever virus. Cell 116541-550. [DOI] [PubMed] [Google Scholar]
- 41.Li, X., B. Gold, C. O'hUigin, F. Diaz-Griffero, B. Song, Z. Si, Y. Li, W. Yuan, M. Stremlau, C. Mische, H. Javanbakht, M. Scally, C. Winkler, M. Dean, and J. Sodroski. 2007. Unique features of TRIM5alpha among closely related human TRIM family members. Virology 360419-433. [DOI] [PubMed] [Google Scholar]
- 42.Lin, L., and S. L. Peng. 2006. Coordination of NF-kappaB and NFAT antagonism by the forkhead transcription factor Foxd1. J. Immunol. 1764793-4803. [DOI] [PubMed] [Google Scholar]
- 43.Marie, I., J. E. Durbin, and D. E. Levy. 1998. Differential viral induction of distinct interferon-alpha genes by positive feedback through interferon regulatory factor-7. EMBO J. 176660-6669. [DOI] [PMC free article] [PubMed] [Google Scholar]
- 44.Matsuoka, Y., J. Curran, T. Pelet, D. Kolakofsky, R. Ray, and R. W. Compans. 1991. The P gene of human parainfluenza virus type 1 encodes P and C proteins but not a cysteine-rich V protein. J. Virol. 653406-3410. [DOI] [PMC free article] [PubMed] [Google Scholar]
- 45.Murphy, B. R., G. A. Prince, P. L. Collins, K. Van Wyke Coelingh, R. A. Olmsted, M. K. Spriggs, R. H. Parrott, H. W. Kim, C. D. Brandt, and R. M. Chanock. 1988. Current approaches to the development of vaccines effective against parainfluenza and respiratory syncytial viruses. Virus Res. 111-15. [DOI] [PubMed] [Google Scholar]
- 46.Newman, J. T., J. M. Riggs, S. R. Surman, J. M. McAuliffe, T. A. Mulaikal, P. L. Collins, B. R. Murphy, and M. H. Skiadopoulos. 2004. Generation of recombinant human parainfluenza virus type 1 vaccine candidates by importation of temperature-sensitive and attenuating mutations from heterologous paramyxoviruses. J. Virol. 782017-2028. [DOI] [PMC free article] [PubMed] [Google Scholar]
- 47.Newman, J. T., S. R. Surman, J. M. Riggs, C. T. Hansen, P. L. Collins, B. R. Murphy, and M. H. Skiadopoulos. 2002. Sequence analysis of the Washington/1964 strain of human parainfluenza virus type 1 (HPIV1) and recovery and characterization of wild-type recombinant HPIV1 produced by reverse genetics. Virus Genes 2477-92. [DOI] [PubMed] [Google Scholar]
- 48.Oshiumi, H., M. Matsumoto, K. Funami, T. Akazawa, and T. Seya. 2003. TICAM-1, an adaptor molecule that participates in Toll-like receptor 3-mediated interferon-beta induction. Nat. Immunol. 4161-167. [DOI] [PubMed] [Google Scholar]
- 49.Peters, K., S. Chattopadhyay, and G. C. Sen. 2008. IRF-3 activation by Sendai virus infection is required for cellular apoptosis and avoidance of persistence. J. Virol. 823500-3508. [DOI] [PMC free article] [PubMed] [Google Scholar]
- 50.Pfaffl, M. W. 2001. A new mathematical model for relative quantification in real-time RT-PCR. Nucleic Acids Res. 29e45. [DOI] [PMC free article] [PubMed] [Google Scholar]
- 51.Pichlmair, A., O. Schulz, C. P. Tan, T. I. Naslund, P. Liljestrom, F. Weber, and C. Reis e Sousa. 2006. RIG-I-mediated antiviral responses to single-stranded RNA bearing 5′-phosphates. Science 314997-1001. [DOI] [PubMed] [Google Scholar]
- 52.Pierrou, S., M. Hellqvist, L. Samuelsson, S. Enerback, and P. Carlsson. 1994. Cloning and characterization of seven human forkhead proteins: binding site specificity and DNA bending. EMBO J. 135002-5012. [DOI] [PMC free article] [PubMed] [Google Scholar]
- 53.Power, U. F., K. W. Ryan, and A. Portner. 1992. The P genes of human parainfluenza virus type 1 clinical isolates are polycistronic and microheterogeneous. Virology 189340-343. [DOI] [PubMed] [Google Scholar]
- 54.Reid, S. P., L. W. Leung, A. L. Hartman, O. Martinez, M. L. Shaw, C. Carbonnelle, V. E. Volchkov, S. T. Nichol, and C. F. Basler. 2006. Ebola virus VP24 binds karyopherin α1 and blocks STAT1 nuclear accumulation. J. Virol. 805156-5167. [DOI] [PMC free article] [PubMed] [Google Scholar]
- 55.Samuel, C. E. 2001. Antiviral actions of interferons. Clin. Microbiol. Rev. 14778-809. [DOI] [PMC free article] [PubMed] [Google Scholar]
- 56.Sanda, C., P. Weitzel, T. Tsukahara, J. Schaley, H. J. Edenberg, M. A. Stephens, J. N. McClintick, L. M. Blatt, L. Li, L. Brodsky, and M. W. Taylor. 2006. Differential gene induction by type I and type II interferons and their combination. J. Interferon Cytokine Res. 26462-472. [DOI] [PubMed] [Google Scholar]
- 57.Sandelin, A., W. Alkema, P. Engstrom, W. W. Wasserman, and B. Lenhard. 2004. JASPAR: an open-access database for eukaryotic transcription factor binding profiles. Nucleic Acids Res. 32D91-D94. [DOI] [PMC free article] [PubMed] [Google Scholar]
- 58.Sato, M., H. Suemori, N. Hata, M. Asagiri, K. Ogasawara, K. Nakao, T. Nakaya, M. Katsuki, S. Noguchi, N. Tanaka, and T. Taniguchi. 2000. Distinct and essential roles of transcription factors IRF-3 and IRF-7 in response to viruses for IFN-alpha/beta gene induction. Immunity 13539-548. [DOI] [PubMed] [Google Scholar]
- 59.Schjerven, H., P. Brandtzaeg, and F. E. Johansen. 2003. Hepatocyte NF-1 and STAT6 cooperate with additional DNA-binding factors to activate transcription of the human polymeric Ig receptor gene in response to IL-4. J. Immunol. 1706048-6056. [DOI] [PubMed] [Google Scholar]
- 60.Seth, R. B., L. Sun, C. K. Ea, and Z. J. Chen. 2005. Identification and characterization of MAVS, a mitochondrial antiviral signaling protein that activates NF-kappaB and IRF 3. Cell 122669-682. [DOI] [PubMed] [Google Scholar]
- 61.Skiadopoulos, M. H., S. R. Surman, J. M. Riggs, C. Orvell, P. L. Collins, and B. R. Murphy. 2002. Evaluation of the replication and immunogenicity of recombinant human parainfluenza virus type 3 vectors expressing up to three foreign glycoproteins. Virology 297136-152. [DOI] [PubMed] [Google Scholar]
- 62.Strähle, L., D. Garcin, P. Le Mercier, J. F. Schlaak, and D. Kolakofsky. 2003. Sendai virus targets inflammatory responses, as well as the interferon-induced antiviral state, in a multifaceted manner. J. Virol. 777903-7913. [DOI] [PMC free article] [PubMed] [Google Scholar]
- 63.Takahasi, K., M. Yoneyama, T. Nishihori, R. Hirai, H. Kumeta, R. Narita, M. Gale, Jr., F. Inagaki, and T. Fujita. 2008. Nonself RNA-sensing mechanism of RIG-I helicase and activation of antiviral immune responses. Mol. Cell 29428-440. [DOI] [PubMed] [Google Scholar]
- 64.Taniguchi, T., and A. Takaoka. 2002. The interferon-alpha/beta system in antiviral responses: a multimodal machinery of gene regulation by the IRF family of transcription factors. Curr. Opin. Immunol. 1 4111-116. [DOI] [PubMed] [Google Scholar]
- 65.Thanos, D., and T. Maniatis. 1995. NF-kappa B: a lesson in family values. Cell 80529-532. [DOI] [PubMed] [Google Scholar]
- 66.Van Cleve, W., E. Amaro-Carambot, S. R. Surman, J. Bekisz, P. L. Collins, K. C. Zoon, B. R. Murphy, M. H. Skiadopoulos, and E. J. Bartlett. 2006. Attenuating mutations in the P/C gene of human parainfluenza virus type 1 (HPIV1) vaccine candidates abrogate the inhibition of both induction and signaling of type I interferon (IFN) by wild-type HPIV1. Virology 35261-73. [DOI] [PubMed] [Google Scholar]
- 67.Vlieghe, D., A. Sandelin, P. J. De Bleser, K. Vleminckx, W. W. Wasserman, F. van Roy, and B. Lenhard. 2006. A new generation of JASPAR, the open-access repository for transcription factor binding site profiles. Nucleic Acids Res. 34D95-D97. [DOI] [PMC free article] [PubMed] [Google Scholar]
- 68.Wei, C., J. Li, and R. E. Bumgarner. 2004. Sample size for detecting differentially expressed genes in microarray experiments. BMC Genomics 587. [DOI] [PMC free article] [PubMed] [Google Scholar]
- 69.Whitlow, Z. W., J. H. Connor, and D. S. Lyles. 2008. New mRNAs are preferentially translated during vesicular stomatitis virus infection. J. Virol. 822286-2294. [DOI] [PMC free article] [PubMed] [Google Scholar]
- 70.Xu, L. G., Y. Y. Wang, K. J. Han, L. Y. Li, Z. Zhai, and H. B. Shu. 2005. VISA is an adapter protein required for virus-triggered IFN-beta signaling. Mol. Cell 19727-740. [DOI] [PubMed] [Google Scholar]
- 71.Yie, J., K. Senger, and D. Thanos. 1999. Mechanism by which the IFN-beta enhanceosome activates transcription. Proc. Natl. Acad. Sci. USA 9613108-13113. [DOI] [PMC free article] [PubMed] [Google Scholar]
- 72.Yoneyama, M., and T. Fujita. 2007. Function of RIG-I-like receptors in antiviral innate immunity. J. Biol. Chem. 28215315-15318. [DOI] [PubMed] [Google Scholar]
- 73.Yoneyama, M., M. Kikuchi, T. Natsukawa, N. Shinobu, T. Imaizumi, M. Miyagishi, K. Taira, S. Akira, and T. Fujita. 2004. The RNA helicase RIG-I has an essential function in double-stranded RNA-induced innate antiviral responses. Nat. Immunol. 5730-737. [DOI] [PubMed] [Google Scholar]
- 74.Young, D. F., L. Didcock, S. Goodbourn, and R. E. Randall. 2000. Paramyxoviridae use distinct virus-specific mechanisms to circumvent the interferon response. Virology 269383-390. [DOI] [PubMed] [Google Scholar]
Associated Data
This section collects any data citations, data availability statements, or supplementary materials included in this article.