Abstract
MSRAs (methionine sulfoxide reductases A) are enzymes that reverse the effects of oxidative damage by reducing methionine sulfoxide back to methionine and recovering protein function. In this study we demonstrate that the transcriptional regulation of the human MSRA gene is complex and driven by two distinct promoters. Both promoters demonstrate high expression in human brain and kidney tissues. The upstream (promoter 1) regulates the msrA1 transcript that codes for the mitochondrial form of MSRA and is highly active in a broad range of cells lines. The downstream promoter (promoter 2) regulates the msrA2/3 transcripts that code for the cytosolic/nuclear forms of MSRA and is generally less active. Promoter 2 contains a 65 bp putative enhancer region that is very active in the retinal pigment epithelium-derived D407 cell line. Both promoters are partially regulated by all-trans retinoic acid via RARα and other RARs.
Keywords: methionine sulfoxide reductase, dual promoters, retinoic acid, retinoic acid, receptors, promoters, regulatory elements, RPE
INTRODUCTION
Methionine sulfoxide reductases (MSRs) are a family of antioxidant enzymes that convert free or protein bound methionine sulfoxide (MetO) back to methionine [1, 2]. This process is known to play a critical role in recovering protein functionality and in protection against oxidative stress [3]. There are two distinct subfamilies of MSRs. MSRAs are capable of reducing the S diastereomer, Met(S)O while MSRBs reduce the R diastereomer, Met(R)O [4–7].
The importance of MSRAs in protection from oxidative stress and in the aging process has been well documented [1, 2]. MSRA overexpression in yeast [8] and in human cell lines [9–12] increases their resistance to oxidative stress and hypoxia. In rats, MSRA levels have been shown to decrease with age [13]. MSRA knockout mice suffer from neurological abnormalities, are more susceptible to oxidative stress and have a 40% reduction in their lifespans [14]. In Drosophila, MSRA overexpression increases lifespan and fertility as well as their resistance to the insecticide paraquat [15]. In human WI-38 fibroblasts, MSRA was found to be downregulated during replicative senescence [9].
Our previous study demonstrated that the MSRA gene contained two putative regulatory regions (promoters) 40 kbp apart which generate three different transcripts [16]. These transcripts generate different protein isoforms differing in their N-termini which in turn determines their intracellular localizations [16]. The main transcript, msrA1 (AY958429), is generated by promoter 1 and codes for the main isoform of MSRA which localizes to the mitochondria [16, 17]. The other two transcripts, msrA2 (AY958430) and msrA3 (AY958431), are generated by promoter 2 and code for two isoforms of MSRA that localize to the cytosol and cytosol/nucleus, respectively [16]. The msrA3 transcript was subsequently reported by another group which also determined its nuclear/cytosolic localization [18]. More recently, alternatively spliced forms of mitochondrial msrA have also been identified in the rat [19].
In the retina, MSRA localizes to the retinal pigment epithelium (RPE), photoreceptor synapses and ganglion cells [16] and may be playing an important role in protecting these tissues from oxidative and photo-damage [16, 20]. In cultured RPE cells, siRNA-mediated gene silencing increased their susceptibility to tertiary butyl-hydroperoxide [16] and hydrogen peroxide [20] induced cytotoxicity. In the monkey retina, the macular RPE has very high levels of MSRA expression [16]. This suggests that RPE may be an appropiate tissue to study MSRA transcriptional regulation.
The upstream human MSRA promoter (promoter 1) was partially characterized recently [21], but little is known about the putative downstream promoter (promoter 2) previously reported [16]. In this study, we have determined that the putative promoter 2 is indeed capable of initiating the transcription process that generates the msrA2/3 transcripts (nuclear and cytosolic MSRA). We have found that both promoters respond vigorously to all-trans retinoic acid (ATRA) and that promoter 2 contains an enhancer region that may explain the high MSRA expression observed in brain and RPE cells [16, 20, 22].
RESULTS
Expression of msrA transcripts in different human tissues
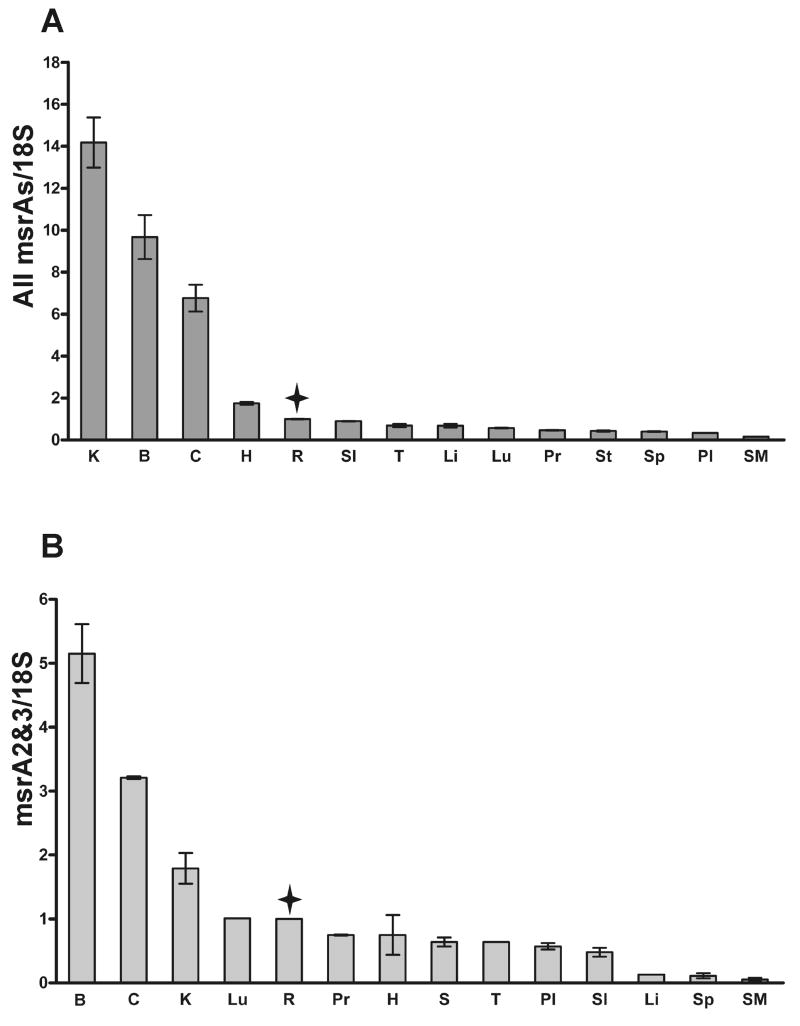
In order to determine the tissue distribution of the different msrA transcripts, qRT-PCR was performed on RNA from different human tissues (Fig. 1). We were unable to design a primer set that could unequivocally detect msrA1 so a primer set that detects all of the msrAs was used and compared with a set that specifically detects msrA2/3 (Table 1). Hence, Fig. 1A measures the contribution of both promoters while Fig. 1B measures the contribution of promoter 2 specifically. All measurements were normalized to the 18S ribosomal RNA and the neural retina was given a value of 1. The values are shown from highest to lowest (Fig. 1). Kidney (K), whole brain (B) and cerebellum (C) were found to express the highest levels of all msrAs (Fig. 1A). However, in the case of transcripts derived from the promoter 2 (msrA2/3) whole brain and cerebellum showed considerably higher expression than kidney (Fig. 1B). The neural retina (without the RPE and choriocapillaris) had higher expression when compared to most other tissues.
Fig. 1.
Expression of msrA transcripts in different human tissues by qRT-PCR. A. Expression of all msrA transcripts (from promoters 1 and 2, Table 1). B. Expression of msrA2/3 transcripts (from promoter 2). The results are normalized with the 18S ribosomal RNA. Data are presented as the mean of two independent experiments and the error bars are the standard deviation of the individual measurements. A value of 1 was given to the retina. B, Brain; C, Cerebellum; H, Heart; K, Kidney; Li, liver; Lu, Lung; Pl, placenta; Pr, prostate; R, Neural retina; SI, Small Intestine; SM, Skeletal Muscle; Sp, Spleen; St, Stomach; T, Testis. The tissues were aligned from high to low and retina is marked with a star.
Table 1.
List of oligonucleotides primers used for qRT-PCR and to generate promoter 1 and 2 deletion constructs.
| Primers for qRT-PCR (5’ to 3’) | ||
|---|---|---|
| 18S | F | ATGCTCTTAGCTGAGTGTCCCG |
| R | ATTCCTAGCTGCGGTATCCAGG | |
| All msrAs | F | GCTTCGGCCCCATCACTAC |
| R | GCCATTGGGGTTCTTGCTCA | |
| msrA2-3 | F | GAGAGGCAGAGGGAGAGC |
| R | TCAAGCCGAGAAAGCAGA | |
| Primers to generate promoter constructs | ||
| Promoter 1 | ||
| −1919 | F | AGTTTCACCCCGAAACCATCC |
| −1232 | F | CATGCCCAACTACCTTAAATACCTT |
| −408 | F | ACTGCCTTAATGGTGCTGTTGGTG |
| −24 to−1 | R | AACTTCGTCCCGAGAGAACCTCAG |
| Promoter 2 | ||
| −1979 | F | AAGAGTACATTTATCCCATTTT |
| −1544 | F | GCTTCTCCAATGCTGCTTTCA |
| −971 | F | AGAACGTGGCAGAATCAAGGACTA |
| −499 | F | GACATTTCTGGGCATACGGTTTTA |
| −311 | F | CATATGGACATTTCTAGGGAACAGA |
| −208 | F | AGGATACCATGAAATCTGTAAGGTGA |
| −151 | F | GATTTGGGTACCGTACCACGGTT |
| −112 | F | TAATTGATCCGCAAAGGACATCT |
| −23 to−1 | R | TTGCCATACTGGGAGCAAAAGAGT |
Activity of MSRA promoters in D407, HEK 293 and SH-SY5Y cell lines
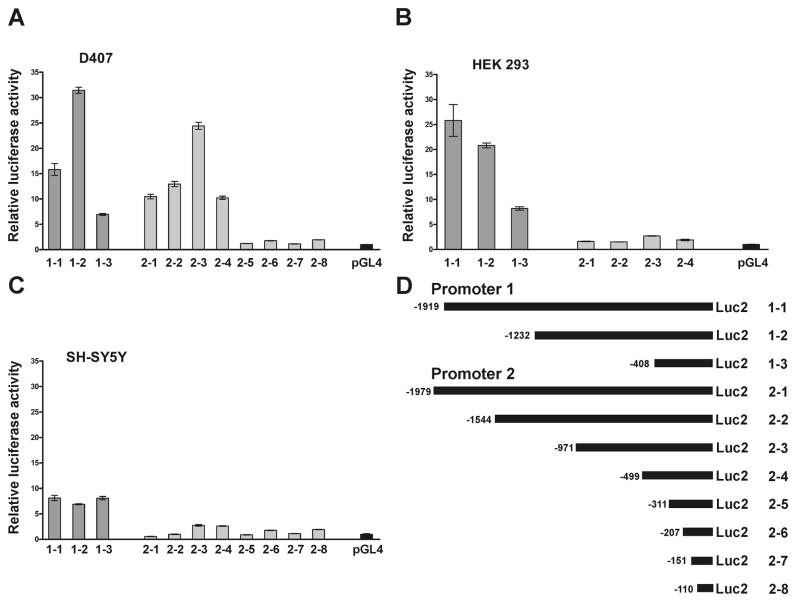
To characterize and compare the MSRA upstream (promoter 1) and downstream (promoter 2) promoters, three cell lines were chosen which originated from tissues of known high MSRA expression. The cell lines were D407 (RPE origin), HEK 293 (human embryonic kidney cells) and SH-SY5Y cells (neuronal origin). Primers were designed to amplify different areas of both promoters and the fragments cloned into pGL4 luciferase reporter vector (Table 1). The constructs were transfected into the different cell lines and luciferase activity was measured (Fig. 2). The sequences for promoter 1 and 2 were submitted to GenBank and the accession numbers are as follows: EU409840 for promoter 1 (−1919 to −1 bp) and EU409841 for promoter 2 (−1979 to −1 bp). The complete structure for the human MSRA gene was previously published (16) but we have included a brief diagram encompassing the promoter region (Fig. 2). Please refer to reference 16 and the above GenBank files for more specific information.
Fig. 2.
Schematic map of MSRA gene promoters 1 and 2. The mitochondrial transcript msrA1 is formed by splicing exon 1–1 to exon 3. The cytosolic msrA2 splices exon 2–1 to exon 2 to exon 3. The nuclear/cytosolic msrA3 splices exon 2–1 to exon 3. After exon 3 all transcripts are identical. For more details on the structure of the MSRA gene please refer to reference 16 and GenBank files EU409840 (Promoter 1) and EU409841 (Promoter 2).
Constructs 1–2 (promoter 1, −1232 to −1, Fig. 3D) and 2–3 (promoter 2, −971 to −1, Fig. 3D) demonstrated the highest activity (Fig. 3A) in D407 cells. In HEK 293 cells, promoter 1 was approximately 10-fold more active than promoter 2 (Fig. 3B). The construct 2–3 demonstrated a 2.7 fold increase in activity over the control vector (pGL4). The construct 1–1 demonstrated slightly greater activity than 1–2 in HEK 293 cells (Fig. 3B). These results suggest the possibility that an upstream suppressor element is present in the 1–1 construct which is active in D407 cells but not in HEK 293 cells. In SH-SY5Y cells the activity for both promoters was overall lower than in D407 and HEK 293 cell lines (Fig. 3C). In these cells, promoter 1 activity was higher than promoter 2 (2–3 fold) but contrasted sharply with the approximately 10-fold higher activity observed in HEK 293 cells. SH-SY5Y cells demonstrated similar activity for the different promoter 1 constructs (1–1, 1–2 and 1–3). By contrast, the promoter 2 constructs behaved similarly in all the cell lines tested, with construct 2–3 having the highest activity. Overall, the data suggest that MSRA promoters may be are regulated differently depending on the tissue or organ.
Fig. 3.
Activity of both MSRA promoters in D407, HEK 293 and SH-SY5Y and cell lines. Various constructs containing different areas of both MSRA promoters (D) were cloned into pGL4 luciferase reporter vector and transfected into different cell lines. A. Relative luciferase activity of both promoters in D407 RPE-derived cell line. B. HEK 293 kidney-derived cell line. C. SH-SY5Y neuroblastoma cell line. D. Constructs used (Table 1). The activity of promoter 1 is represented in dark grey and promoter 2 in light grey. All the results were normalized by renilla luciferase transfection control and related to the pGL4 empty vector. Data (Mean ± SD of three measurements) are representative of three or more independent experiments.
Identification of a putative enhancer in the 5’-distal region in promoter 2
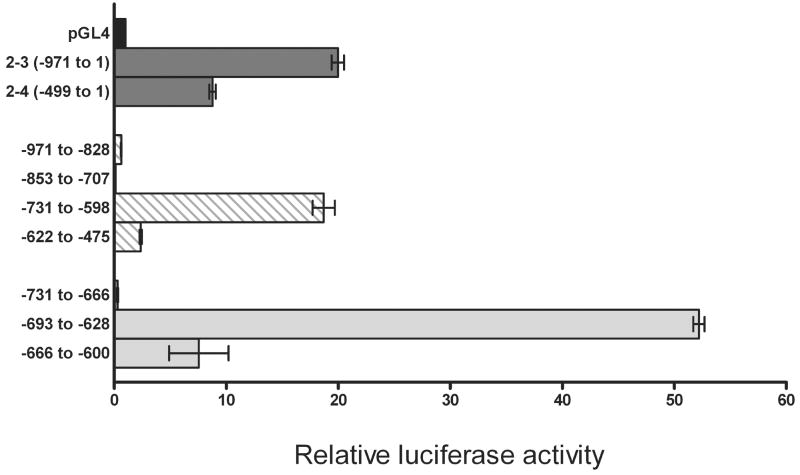
In D407 cells, the considerable decrease in the promoter 2 activity observed between the constructs 2–3 and 2–4 (Fig. 3A) suggested a potential enhancer in the region between −971 to −499 (Fig. 3D). To localize the region responsible for this transcriptional increase, four constructs of approximately 130–150 bp each were made and their luciferase activity measured (Fig. 4, hatched bars, Table 2). Only one of the constructs, between the positions −731 to −598, demonstrated high luciferase activity similar to the activity of the original 2–3 construct (Fig. 4). The 133 bp region was further subdivided into three additional overlapping constructs of approximately 65 bp each (Fig. 4, Table 3). The first 65 bp (−731 to −666) did not have any activity, the middle region construct (−693 to −628) demonstrated approximately 50-fold increase over control and the last construct (−666 to −600) showed only a 10-fold increase in activity (Fig. 4). These results suggest that the 65 bp region between −693 and −628 is critical to the high expression observed in D407 cells.
Fig. 4.
Identification of an enhancer region in promoter 2. The promoter 2 region between −971 and −475 was subcloned into 4 regions: −971 to −828, −853 to −707, −731 to −598 and −622 to −475 and the luciferase activity measured in transfected D407 cells (Table 2). The high activity region between −731 and −598 was further subcloned into three smaller constructs: −731 to −666, −693 to −628 and −666 to −600 (Table 3). The empty vector (pGL4) and the 2–3 and 2–4 promoter 2 constructs were used for comparison. Data (Mean ±SD of three measurements) are representative of three or more independent experiments.
Table 2.
List of oligonucleotides primers used to generate the 4 constructs to identify the promoter 2 enhancer region.
| (−971 to −828) | F | AGAACGTGGCAGAATCAAGGACTA |
| R | TCTGTGCTTCACACACTTACCTGGT | |
| (−853 to −707) | F | ACCAGGTAAGTGTGTGAAGCACAGA |
| R | CCTCAAGTTCCAGCATAGTCACT | |
| (−731 to −598) | F | AGTGACTATGCTGGAACTTGAGG |
| R | CAGATGTACAGGGGAGAAGAGTTC | |
| (−622 to −475) | F | GAACTCTTCTCCCCTGTACATCTG |
| R | TAAAACCGTATGCCCAGAAATGTC |
Table 3.
List of oligonucleotides used to clone and narrow the promoter 2 enhancer region.
| Oligonucleotides for promoter 2 enhancer constructs | ||
|---|---|---|
| (−731 to −666) | F | CTAGTGACTATGCTGGAACTTGAGGTGTCAAAATATGAAAAGATACTTGCTGTTATTAAATTGACCT |
| R | AGCTAGGTCAATTTAATAACAGCAAGTATCTTTTCATATTTTGACACCTCAAGTTCCAGCATAGTCA | |
| (−693 to −628) | F | CTAGATACTTGCTGTTATTAAATTGACCTTAGATGTTTTATTTTCCTTTTTATTGTTATTTGTTTTA |
| R | AGCTTAAAACAAATAACAATAAAAAGGAAAATAAAACATCTAAGGTCAATTTAATAACAGCAAGTAT | |
| (−666 to −600) | F | CTAGATGTTTTATTTTCCTTTTTATTGTTATTTGTTTTATCAAAAGAACTCTTCTCCCCTGTACATC |
| R | AGCTCAGATGTACAGGGGAGAAGAGTTCTTTTGATAAAACAAATAACAATAAAAAGGAAAATAAAAC | |
Characterization of the promoter 2 putative enhancer region (−693 to −628)
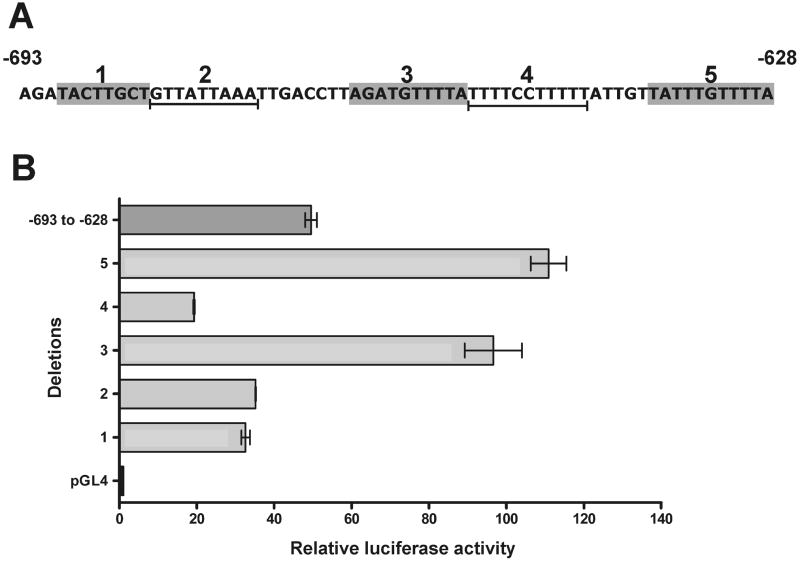
To further characterize this 65 bp enhancer region and to identify specific response elements responsible for its high activity, five different deletion constructs were made and analyzed (Fig. 5, Table 4). Computer-aided analyses (www.gene-regulation.com/pub/databases.html) suggested that the sequences TACTTGCT (deletion 1, putative Oct-1 and/or Myf-3 element), GTTATTAAA (deletion 2, putative HNF-1), AGATGTTTTA (deletion 3, putative HNF-3), TTTTCCTTTT (deletion 4, putative GATA-1, Oct-1, ICSBP or RARα), and TATTTGTTTTA (deletion 5, putative Oct-1, C/EBPα or HNF-3) may be areas of interest. All of the constructs demonstrated increased activity over the empty vector control. Constructs with deletions 1, 2 and 4 demonstrated diminished activity while constructs with deletions 3 and 5 showed greatly increased activity when compared to the original (−693 to −628). Interestingly, deletions 3 and 5 contain a TGTTTTA sequence that may be a suppressor element.
Fig. 5.
Characterization of promoter 2 enhancer region. A. Sequence of putative enhancer region marking the deleted regions 1 thru 5. B. Luciferase activity of the 5 deletion constructs (Table 4). All the results were normalized to the renilla luciferase internal control and related to pGL4 empty vector. Data are expressed as Mean ±SD of three measurements.
Table 4.
List of oligonucleotides used to delete different putative elements within the promoter 2 enhancer.
| Oligonucleotides with deletions | ||
|---|---|---|
| Del 1 | F | CTAGAGTTATTAAATTGACCTTAGATGTTTTATTTTCCTTTTTATTGTTATTTGTTTTA |
| R | AGCTTAAAACAAATAACAATAAAAAGGAAAATAAAACATCTAAGGTCAATTTAATAACT | |
| Del 2 | F | CTAGATACTTGCTTTGACCTTAGATGTTTTATTTTCCTTTTTATTGTTATTTGTTTTA |
| R | AGCTTAAAACAAATAACAATAAAAAGGAAAATAAAACATCTAAGGTCAAAGCAAGTAT | |
| Del 3 | F | CTAGATACTTGCTGTTATTAAATTGACCTTTTTTCCTTTTTATTGTTATTTGTTTTA |
| R | AGCTTAAAACAAATAACAATAAAAAGGAAAAAAGGTCAATTTAATAACAGCAAGTAT | |
| Del 4 | F | CTAGATACTTGCTGTTATTAAATTGACCTTAGATGTTTTAATTGTTATTTGTTTTA |
| R | AGCTTAAAACAAATAACAATTAAAACATCTAAGGTCAATTTAATAACAGCAAGTAT | |
| Del 5 | F | CTAGATACTTGCTGTTATTAAATTGACCTTAGATGTTTTATTTTCCTTTTTATTGT |
| R | AGCTACAATAAAAAGGAAAATAAAACATCTAAGGTCAATTTAATAACAGCAAGTAT | |
Effect of all-trans retinoic acid (ATRA) on the MSRA promoters
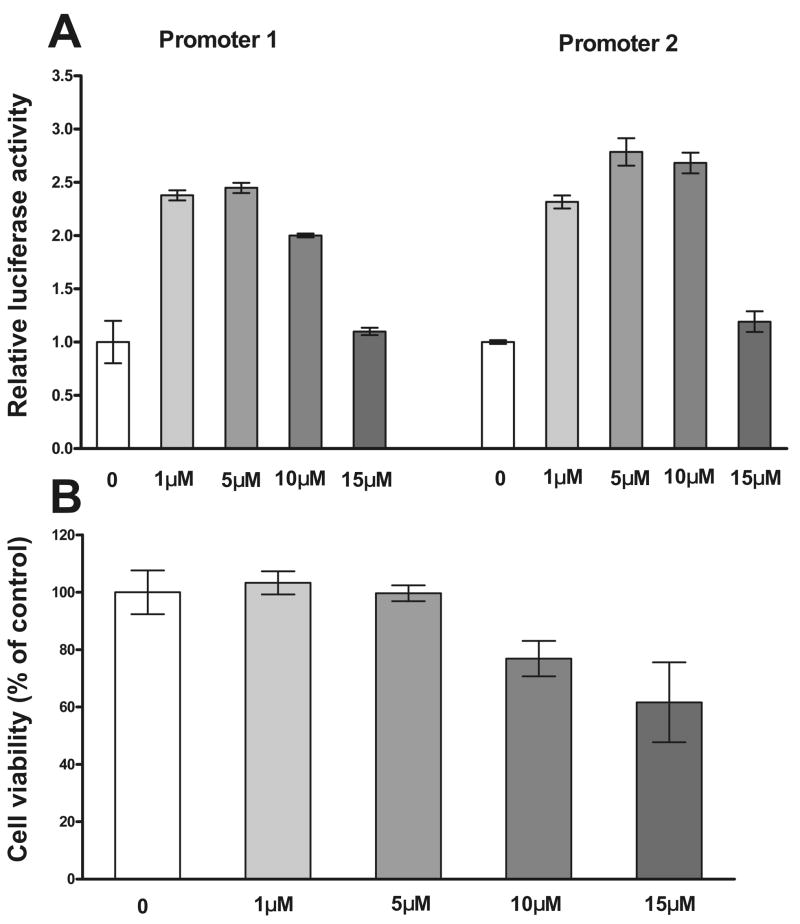
The computer-aided analysis of both promoter regions suggested putative retinoic acid response elements (RARα) in both MSRA promoters. Moreover, analysis of the 65 bp promoter 2 enhancer region and the results from the above deletion constructs (deletion 4, Fig. 5) which interfered with a putative RARα site suggested that these element may be of importance. To test this assumption D407 cells were transiently transfected with constructs 1–2 and 2–3 and treated with increasing concentrations of ATRA (0–15 μM), 18h after transfection. The cells were harvested 24 h after ATRA treatment and luciferase activity was measured (Fig. 6A). Since ATRA may be toxic, cellular dehydrogenase activity, a measure of cell viability, was monitored over the same concentration range (Fig. 6B). The lower concentrations of ATRA (1 and 5 μM) roughly doubled the activity of both MSRA promoters (Fig. 6A) with no effect on cell viability (Fig. 6B). The promoter induction was still measurable at 10 μM but cell viability was reduced by approximately 25% (Fig. 6A and B). At 15 μM the loss in cell viability was approximately 40 % and this correlates with the drop in activity observed for both promoters.
Fig. 6.
Effect of all-trans retinoic acid (ATRA) in the activity of MSRA promoters. D407 cells were transfected with constructs of promoter 1(construct 1–2, −1232 to −1) and promoter 2 (construct 2–3, −971 to −1). The cells were treated with ATRA 18 h after transfection and luciferase activity was measure 24 h after ATRA treatment. A. Relative luciferase activity of promoter 1 and 2 constructs after treatment with ATRA. B. Cell viability (cellular dehydrogenase activity) of the cells at the different ATRA concentrations. Data (Mean ± SD of three measurements) are expressed as the fold of luciferase activity related to the activity of non-treated cells.
Expression of RARs in D407 cells
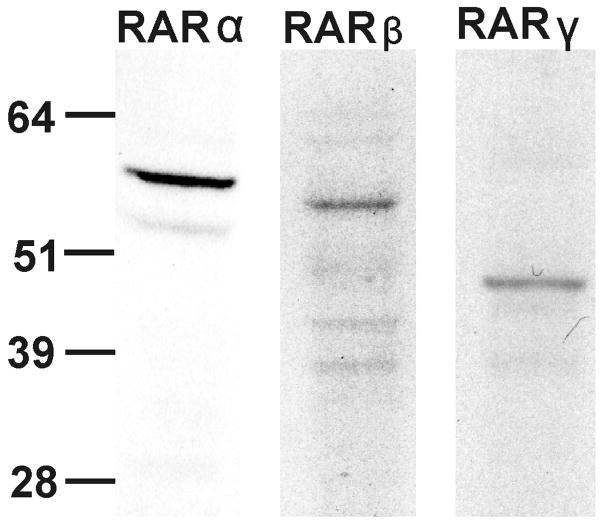
Since both MSRA promoters responded to ATRA we performed immunoblots using specific antibodies to RARα, β and γ to determine if they were expressed in nuclear extracts from D407 cells (Fig. 7). The immunoblots indicate that all three RARs are expressed in D407 cells (Fig. 7). For subsequent experiments we focused on RARα for two particular reasons: RARα seems to be more abundant than the other RARs and the computer-aided analyses indicated RARα-specific elements.
Fig. 7.
Expression of retinoic acid receptors in D407 nuclear extracts. RARα, β and γ were detected by immunoblot using antibodies specific to each subtype. Each lane contains 15 μg of nuclear protein extract. For more details see Material and Methods.
Effect of RARα on the activity of MSRA promoters
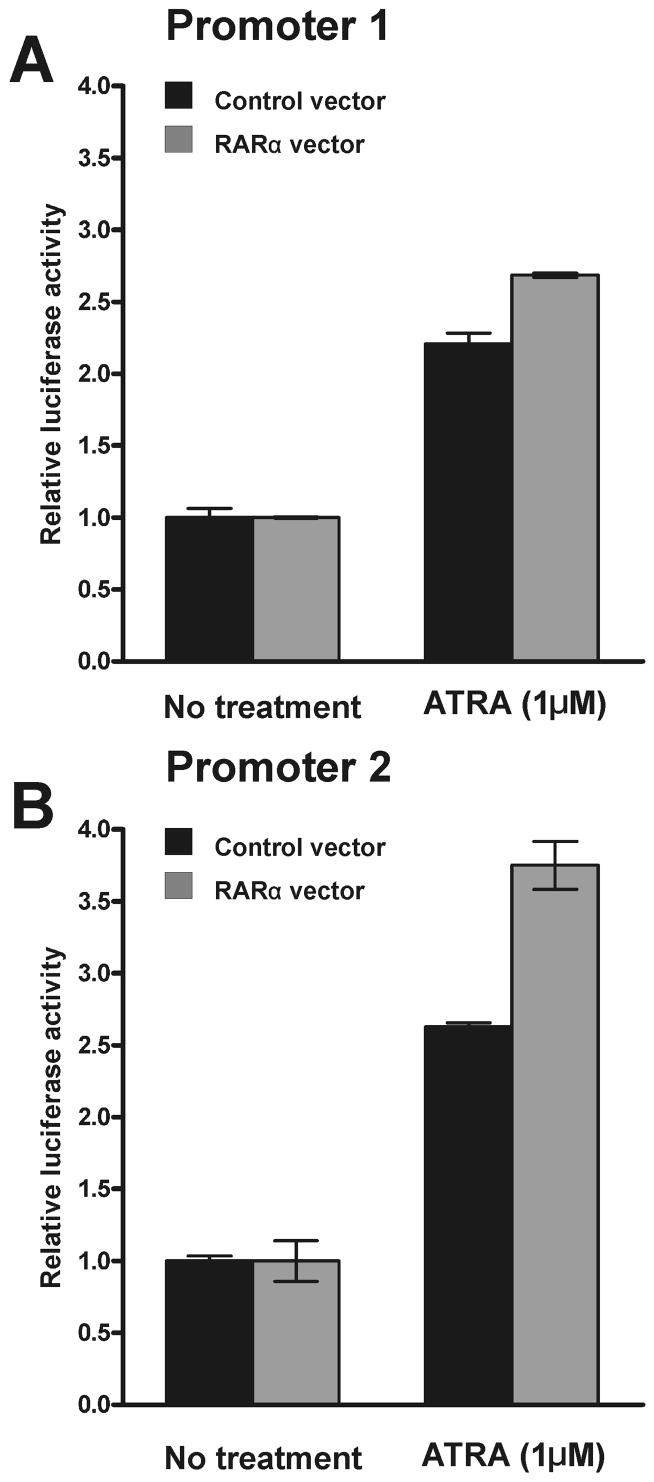
To elucidate the effect of retinoic acid receptors on the activity of the MSRA promoters, RARα was overexpressed in D407 cells. One set of D407 cells were co-transfected with the construct 1–2 (promoter 1, −1232 to −1, Fig. 3D) and another set of cells with the construct 2–3 (promoter 2, −971 to −1, Fig. 2D). In addition, both set of cells received the RARα constructand a control plasmid as a mock transfection control. The cells were treated with 1 μM ATRA 18 h after transfection and the luciferase activity was measured 24 h after the treatment. The results from the experiments are shown in Fig. 8.
Fig. 8.
Effect of RARα overexpression on the activity of the MSRA promoters. RARα expression construct was co-transfected with promoter 1 and promoter 2 luciferase reporter constructs (1–2 and 2–3, respectively) in D407 cells. The cells were treated with 1 μM ATRA 18 h after transfection and analyzed 24 h after ATRA treatment. A. Promoter 1 response. B. Promoter 2 response. For more details see methods. Data (Mean ± SD of three measurements) are representative of three independent experiments.
Without ATRA treatment, neither promoter responded to the RARα overexpression (Fig. 8 A and B, no treatment). As shown above (Fig. 6) treatment with 1 μM ATRA increased the activity of both promoters (Fig. 8). This effect was likely due to the constitutive expression of RARs in D407 cells (Fig. 7). The cells co-transfected with the RARα overexpression plasmid demonstrated an increase activity for both promoters (Fig. 8A and B) with promoter 2 being slightly more responsive.
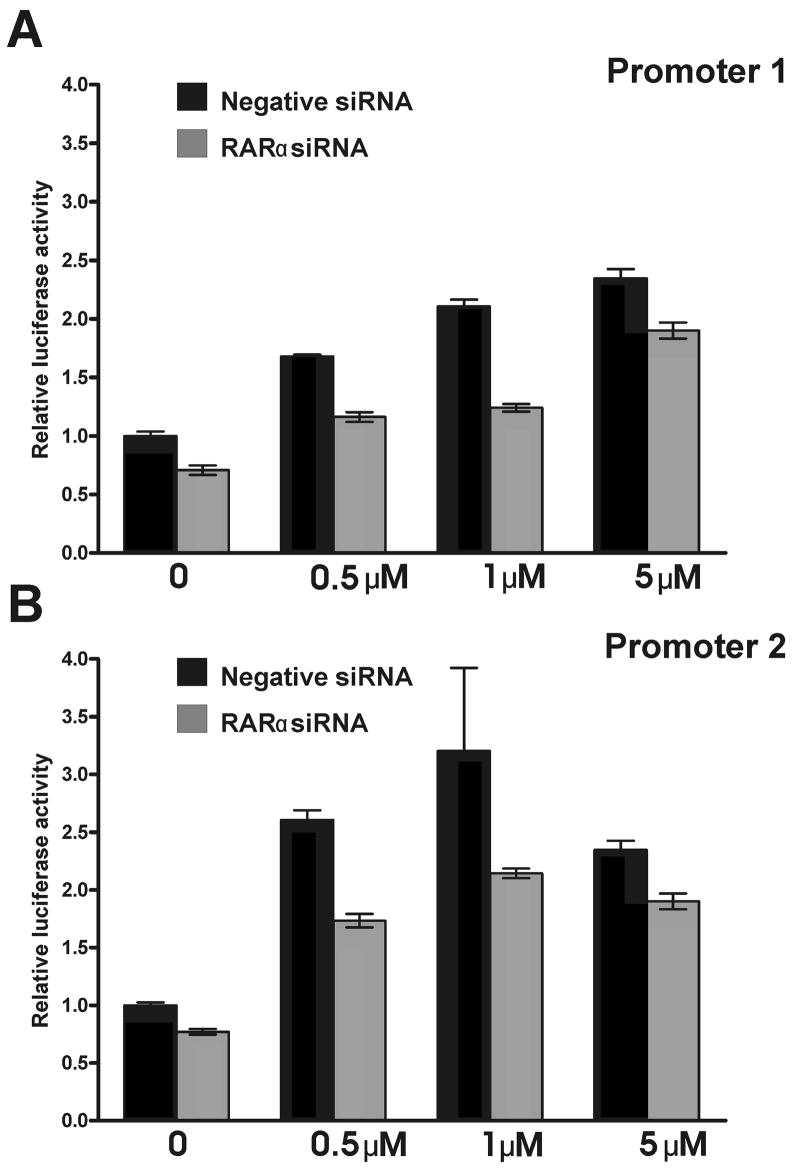
To confirm the interaction of RARα with the MSRA promoters, D407 cells were cotransfected with the luciferase constructs 1–2 or 2–3, and RARα siRNA or a negative control siRNA. The RARα siRNA used suppressed the native RARα mRNA levels by 70% (data not shown). The RARα siRNA attenuated the response of both promoters to ATRA when compared to the siRNA negative control (Fig. 9). The reduction was approximately 20% without ATRA treatment and around 40% after the ATRA treatments.
Fig. 9.
Effect RARα siRNA knockdown on the activity of MSRA promoters. D407 cells were co-transfected with promoter 1 and promoter 2 luciferase reporter constructs (1–2 and 2–3, respectively) and a siRNA for RARα or a negative siRNA control. The RARα siRNA knocks down approximately 70% of the native RARα mRNA levels. After the co-transfection (24 h), the cells were treated with 0.5, 1 and 5 μM ATRA and luciferase activity was measured 24 h after the ATRA treatment. A Promoter 1 response. B. Promoter 2 response.
The data suggest that RARα mediates the responses of both promoters and promoter 2 may be somewhat more responsive to ATRA than promoter 1.
Induction of native msrA transcripts by ATRA
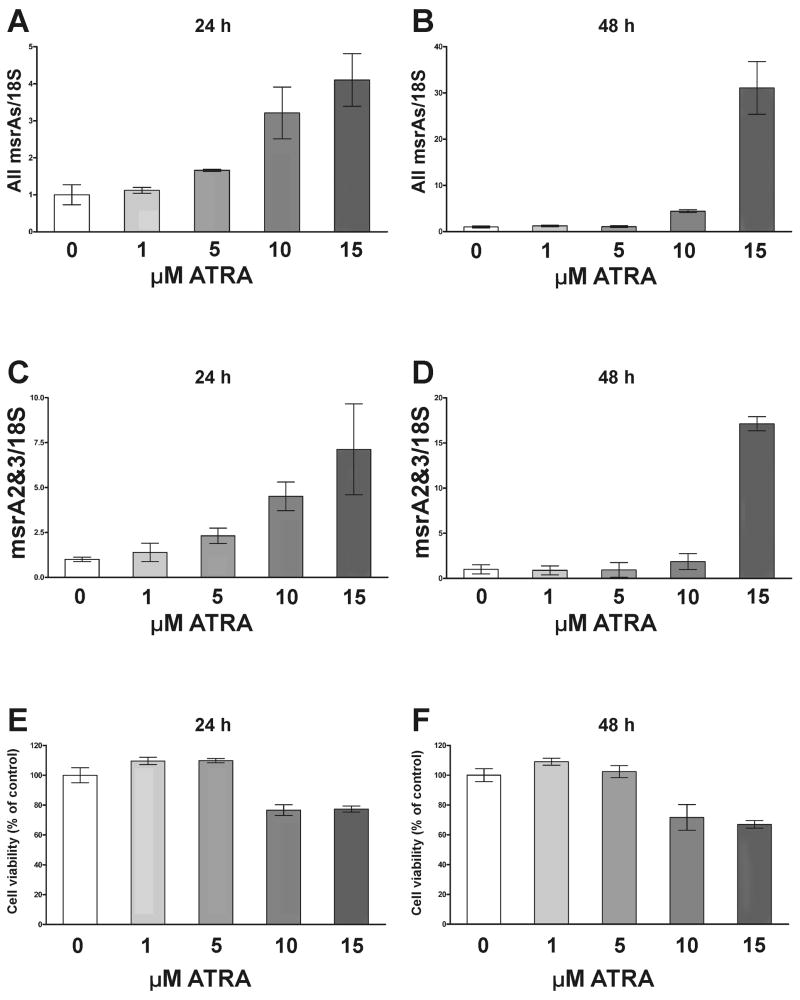
To demonstrate that the transcriptional induction observed with the luciferase reporter constructs was indeed relevant to MSRA expression, msrA transcripts were measured by qRT-PCR in RNA from D407 cells treated with ATRA (Fig. 10). The cells were treated with 0–15 μM ATRA for 24 h and 48 h, and the msrA transcripts measured using the same primers and conditions as in Fig. 1 (Table 1). One primer set measured all msrAs (Fig. 10A and B) and the other set measured msrA2/3 from promoter 2 (Fig. 10C and D). Cell viability was determined for both experiments (Fig. 10E and F) by assaying for cellular dehydrogenase activity.
Fig. 10.
Effect of ATRA on the expression of native msrA transcripts. D407 cells were treated with 0, 1, 5, 10 and 15 μM of ATRA for 24 h and 48 h. Expression of msrA transcripts was determined by qRT-PCR using the same primers and conditions as Fig. 1 (Table 1). A. All msrA transcripts (msrA1, 2 and 3) from both promoters. B. MsrA transcripts from promoter 2 (msrA2/3). Cell viability (cellular dehydrogenase) was performed under the same treatment conditions. C. Cell viability 24 h after treatment. D. Cell viability 48 h after treatment. Values were normalized to the 18S ribosomal RNA and related to the control. Data are presented like Mean ± SD of at least three samples.
After 24 h all msrAs (msrA 1, 2 and 3) transcripts demonstrated a dose-dependent induction (1.7 to 4-fold) over control at the 5 to 15 μM concentrations (Fig. 10A). The msrA2/3 transcripts from promoter 2 seemed to be more responsive with a 2.5–8 fold increase over controls (Fig. 10C). After 48 h all msrAs increased by approximately 30 fold (Fig. 10B) at 15 μM. The msrA2/3 transcripts increased by approximately 18 fold (Fig. 10D) with 15 μM ATRA. The cell viability (cellular dehydrogenase activity) was reduced by 20–30% with the 10 and 15 μM ATRA concentrations (Fig. 10E and F).
DISCUSSION
In this study we demonstrate that the MSRA gene is regulated by two distinct promoters. We partially characterized both MSRA promoters with emphasis on the downstream, promoter 2. This second MSRA promoter is particularly interesting because it regulates the transcription of two distinct mRNAs that generate MSRA isoforms with distinct N-termini that targets them to the cytosol and the nucleus [16]. These isoforms have been previously described as originating by alternative splicings [18, 19] but we clearly demonstrate that their expression is controlled by a second MSRA promoter. We have also established that retinoic acid is involved in the regulation of MSRA expression via RARα and suspect other RAR isoforms may also be involved.
The transcriptional regulation of MSRA is not well understood. In Saccharomyces cerevisiae calcium phospholipid-binding protein (CPBP), a homologue of elongation factor 1 gamma, has been shown to regulate MSRA gene expression [24]. Also, in yeast, thioredoxins have been shown to be essential for MSRA transcriptional activity [25]. In Drosophila the hormone ecdysone (essential in insect molting) induced MSRA via the EcR-USP (ecdysone receptor-ultraspiracle) complex [26]. EcR and USP belong to the same family of the mammalian retinoic acids, thyroid hormone and vitamin D receptors [27]. Thus, this previous work indirectly supports our findings regarding the interactions of the MSRA promoters with retinoic acid receptors.
In the human tissues analyzed by real time RT-PCR, brain and kidney have much higher levels of msrAs than other tissues (Fig. 1A). This higher expression in kidney and brain was previously described by RNA dot blot analysis [28]. Kidney seems to be favored by promoter 1 which generates the mitochondrial msrA1 transcript [16, 17]. Promoter 2 which controls the expression of the cytosolic and nuclear transcripts msrA2/3 is most highly active in brain followed by the kidney and neural retina (Fig. 1B). In the retina, MSRA is known to be highly expressed in only three cell types, RPE, ganglion cells and photoreceptors [16]. Using the same primer sets as in Fig. 1 and monkey RNA from the RPE and choriocapillaris regions of the retina, all msrAs (msrA1, 2 and 3) are expressed 4.5 fold more than in the neural retina (data not shown). The msrA2/3 transcripts from promoter 2 were 13 fold greater than in the monkey neural retina (data not shown). Moreover, the RPE-derived D407 cells demonstrated the highest level of activity for promoter 2 of all the cell lines tested (Fig. 3). This suggests that MSRA may play an important role in protecting the RPE from oxidative as well as retinoic acid damage.
The transcriptional regulation of MSRA is complex and there is evidence of tissue-specific suppressors (Fig. 3). In D407 cells there is a doubling in promoter 1 activity between construct 1–1 and 1–2 (Fig. 3A). This suggests the presence of a suppressor(s) between −1232 and −1919 which affects D407 cells but not HEK 293 and SH-SY5Y (Fig. 3). In HEK 293 cells there was a sharp decrease in activity between 1–2 and 1–3 (−1232 to −408). De Luca et al. [21] also in HEK 293 cells demonstrated little change in activity between −1341 and −309 and a large increase in activity between −309 and −155. Since De Luca et. al [21] did not test any constructs between −1341 and −309 and we did not test any promoter 1 constructs shorter than −408, it is difficult to make any direct comparison with our present results.
Promoter 2 also seems to have some suppressor activity between −971 and −1979. This seems to be a general effect since it is similar in all cell types (Fig. 3). Promoter 2 has only 2 to 3-fold increased activity over control in HEK 293 and SH-SY5Y cells. However, construct 2–3 has approximately 25-fold increased activity over control in D407 cells. The reason(s) for this difference are unclear but cell-specific interactions with the enhancer between −693 and −628 (Fig. 3) may provide a partial explanation.
The 65 bp enhancer region identified in promoter 2 seems to interact with multiple transcription factors. Deletion constructs in the region between constructs 2–3 and 2–4 (Fig. 3) identified an area of approximately 65 bp between −693 and −628 that provided high levels of expression (approximately 50-fold over controls). Further deletions within the 65 bp enhancer region failed to completely obliterate the activity (Fig. 4) and in two instances (deletions 3 and 5) it was further increased. This region also has putative RARE elements [29] and the deletion that disrupted these elements (Fig.5) decreased but did not eliminate the activity. This suggests that this putative enhancer region is very important to the function of promoter 2.
ATRA, the natural agonist of RARs [29] has an important effect on the transcriptional regulation of MSRA. D407 cells transfected with promoter 1 and promoter 2 constructs (1–2 and 2–3, respectively) and then treated with ATRA demonstrated a marked increase in activity over controls (Fig. 6). RARs generally form heterodimers with RXRs in the presence of their ligands then activate the RAREs in the promoters of target genes [29–31]. In D407 cells, RARs and RXR are expressed constitutively (Fig. 7). This effect of ATRA on the MSRA promoter activity is mediated, at least in part, by RARα. Co-transfection with plasmids overexpressing RARα in ATRA-treated cells produced a measurable increase in the activity for both promoters (Fig. 8). Promoter 2 responds more vigorously than promoter 1 (Fig. 8) perhaps due to the putative RARE elements in the 65 bp enhancer region although this was not conclusively demonstrated. The siRNA knockdown of RARα mRNA expression significantly attenuated the activity of both promoters and their response to ATRA (Fig. 9).
ATRA also had an effect on the native MSRA promoters in a dose dependent manner (Fig. 10). The response for promoter 2 was detectable at 1–5 μM in 24 h and before any significant cytotoxicity was detected (Fig. 10C and E). The increased responses at the 1 and 5 μM ATRA concentrations (2–3 fold) were similar to those observed with the shortened promoter constructs in Fig. 5A ( please note scale difference). However, both promoters responded vigorously at 15 μM ATRA (Fig. 10B and D) after 48 h. At this concentration cytotoxicity was significant with approximately 30% cell death (Fig. 10E and F). Thus, the 18 and 30-fold increases in activity observed with 15 μM ATRA in 48 h (Fig. 10, promoter 2 and all promoters, respectively) may also be attributed to cell stress and not exclusively to ATRA. This stress response by both promoters needs to be further investigated.
The findings of retinoic acids involvement in the transcriptional regulation of MSRAs are not only novel but potentially very important. Retinoic acids have been shown to modulate anti-oxidant enzymes in different tissues [32, 33]. In the retina, ATRA is generated by the photoreceptors and RPE as a by-product of the visual process [34]. Retinoic acids can induce apoptosis in RPE cells [32] by generating reactive oxygen species [32, 35]. The generation of reactive oxygen species seems to be due to a direct effect of retinoic acids on the mitochondria [36, 37]. Thus, our data suggests that MSRA may be part of a pro-active protective mechanism that responds to ATRA before reactive oxygen species are formed. This may be of particular importance to the retina and RPE cells in particular because of the relative large amounts of ATRA generated in this tissue [34].
Our findings, when taking in context with what is known about MSRA’s function, suggest that this enzyme plays and important role in the anti-oxidative mechanisms of the RPE and possibly in the pathogenesis of RPE-related diseases like age-related macular degeneration [38]. This disease as well as others may benefit from increased expression of MSRA. Thus, understanding the transcriptional regulation of this gene may provide some potential pharmacological solutions to prevent neuronal damage especially in aging diseases.
MATERIALS AND METHODS
Materials
Human total RNAs were purchased from BD Biosciences (Mountain View, CA). Human genomic DNA was purchased from Clontech (Mountain View, CA). Oligonucleotides were purchased from Integrated DNA Technologies, Inc. (Coralville, IO). Endonucleases were purchased from New England Biolabs (Ipswich, MA). ATRA was purchased from Sigma (St. Louis, MS) and used dissolved in DMSO. The transfection control plasmid pRL-TK (thymidine kinase promoter of Herpes Simplex virus with renilla luciferase reporter gene) was purchased from Promega (Madison, WI). Mouse anti-human RARα and mouse anti-human RARβ antibodies were purchased from Biomol International Inc. (Plymouth Meeting, PA). Rabbit anti-human RARγ was purchased from Santa Cruz Biotechnology, Inc. (Santa Cruz, CA).
RNA isolation and Reverse transcription
Total RNA from D407 cells was isolated with Qiagen RNeasy mini kit using a QiaCube instrument (Qiagen, Valencia, Ca) following the manufacturer’s protocol. cDNA was synthesized from 2 μg of total RNA previously treated with DNase I (Invitrogen Corp, Carlsbad, CA) in a 20 μL reaction using SuperScript III Reverse Transcriptase (Invitrogen Corp, Carlsbad, CA).
Real time semi-quantitative RT-PCR
Real time semi-quantitative RT-PCR (qRT-PCR) was performed using SYBR green in an ABI 7500 instrument (Applied Biosystems Inc., Foster City, CA). A serial dilution of cDNA from the same source as samples was used to obtain a calibration curve. Targets were quantified by determining the cycle threshold (Ct) and using the calibration curves. The relative values were normalized with 18S ribosomal RNA. Primers to quantify all msrAs were designed between exons 5 and 6 and primers for msrA2/3 transcripts were designed on exon 2–1 (Table 1, and reference 16).
Preparation of luciferase reporter constructs
Different areas of promoters 1 and 2 were amplified from human genomic DNA beginning at the transcription start site to different 5’upstream region. The transcription start sites for all three transcripts were previously determined by 5’RACE [16]. The amplifications were performed using pfu DNA polymerase (Stratagene, La Jolla, CA). The PCR products were purified using the PCR purification Kit from Qiagen (Valencia, CA). The purified products were mixed with pGL4.10 reporter vector (Promega Corp, Madison, WI) which had been previously digested with EcoRV endonuclease and ligated using the Quick Ligase Kit (New England Biolabs, Ipswich, MA). Primers used to amplify promoters 1 and 2 are listed in the Table 1. Promoter sequences around 65 bp or less were cloned using adapter oligos with NheI and HindIII ends into pGL4.10 vector digested with the same endonucleases. All constructs were verified by direct sequencing.
Cloning of human RAR for expression
The open reading frame of RARα transcription factor was amplified by PCR from human retina cDNA using the forward primer, 5’-ACCATGGCCAGCAACAGCAG.-3’ and the reverse primer, 5’-ATTCACGGGGAGTGGGTGG-3’. PCR products were cloned into pcDNA 3.1/V5-His-TOPO vector (Invitrogen Corp, Carlsbad, CA) which drives expression using the CMV promoter.
DNA sequencing
Sequencing of the different plasmid constructs was performed using the BigDye terminator v3.1 cycle sequencing kit and an ABI 3130 Genetic Analyzer instrument (Applied Biosystems Inc., Foster City, CA) following the manufacturer’s protocol.
Cell cultures
HEK 293 and SH-SY5Y cells were purchased from American Type Culture Collection (Manassas, VA). D407 cells were a kind gift from Dr. Richard Hunt (Department of Pharmacology and Microbiology, University of South Carolina, Columbia, SC). D407 were grown in DMEM medium supplemented with 4% fetal bovine serum (FBS). HEK293 were grown with DMEM supplemented with 10% FBS and SH-SY5Y neuroblastoma cells were grown with DMEM/F12 (1:1) supplemented with 10% FBS. Penicillin 10 U/mL, streptomycin 100ug/uL and 2mM of L-glutamine were added to all the cell media. DMEM and DMEM/F12 media were purchased from Atlanta biologicals (Atlanta, GA) and all other components used for cell culture were from Invitrogen Corp (Carlsbad, CA).
Transient transfections and expression
The transfections were performed on 1x10⁶ cells by electroporation using the Cell Line nucleofector V Kit and the Nucleofector ™ II instrument (Amaxa Biosystems Inc., Gaithersburg, MD) according to the manufacturer’s protocol. D407, SH-SY5Y and HEK293 cells were co-transfected with the different hMSRA-pGL4 constructs and a renilla luciferase transfection control plasmid pRL-TK. Cells were plated on 24-well plates and fresh media was added 18 h after transfection. To determine the effects of RARα overexpression on the activity of MSRA promoters, D407 cells were transfected with 0.5 μg of the MSRA-pGL4 constructs, 1–2 or 2–3, 10 ng pRL-TK, and 4 μg of the expression plasmid RARα. The plasmid vector pcDNA 3.1/V5-His-TOPO/lacZ (Invitrogen Corp, Carlsbad, CA) was used for the mock transfections.
Knockdown of RARα using small interference RNA (siRNA)
The RARα siRNA (cat# SI00019369) and a negative control siRNA (cat# 1022083) were purchased from Qiagen Inc. (Valencia, CA). D407 cells (2 x 10⁶ cells) were transfected with 500 nM of each siRNA as described above. The silencing of RARα siRNA was monitored by real time PCR using the forward primer, 5’-TGCCCAGCTCACCACATCTTCAT-3’ and the reverse primer, 5’-CTGTCCCACCCCCTCTGTCACCAA-3’.
Cell viability assay
Cell viability was measured using the Cell Counting Kit-8 purchased from Dojindo Molecular Technologies, Inc. (Gaithersburg, MD). This assay measures cellular dehydrogenase activity. Absorbance was measured in a Wallac 1420 Victor 2 instrument (Perkin Elmer Inc, Waltham, MA).
Luciferase reporter assay
Luciferase expression was measured using the Dual-Luciferase Reporter Assay System (Promega) in a POLARstar OPTIMA Multifunction Microplate Reader instrument (BMG LABTECH Inc., Durham NC). The luciferase activity was quantified 48 h after transfection and normalized to the renilla luciferase internal transfection control.
Treatment with all-trans retinoic acid
All experiments where ATRA was used were performed in dim yellow light to avoid photooxidation. In the studies where the effects of ATRA on MSRA promoter activity was measured (Fig. 6 and 8), ATRA (1, 5, 10 and 15 μM, final concentration) was added to the cells 18 h after transfection and the cells were harvested 24 h after ATRA treatment. In the studies where ATRA was used to induce msrA mRNA expression, 3x10⁵ cells were seeded and the cells treated (in 6-well plates) for 24 and 48 h.
Immunoblots
Nuclear extracts were prepared from D407 cells as previously described [23]. Nuclear proteins (15 μg per lane) were separated in 4–12% SDS-polyacrylamide gels (NuPAGE, Invitrogen Corp. Carlsbad, CA). Proteins were blotted on to nitrocellulose membranes using an iBlot dry blotting system (Invitrogen Corp.) following the manufacturer’s protocol. The membranes were blocked with 5% non-fat milk (BioRad Laboratories, Inc., Hercules, CA). The membranes were then incubated overnight with primary antibodies specific to RARα, β and γ (see above). The blots were developed with anti-mouse (RARα and β) or anti-rabbit (RARγ) horseradish conjugated secondary antibodies using Super Signal West Pico chemiluminescent substrate (Pierce Biotechnology Rockford, IL).
Supplementary Material
Acknowledgments
This work was supported by the National Eye Institute Intramural Research program.
Abbreviations
- ATRA
all-trans retinoic acid
- MSRA
methionine sulfoxide reductase A (protein, gene, general)
- msrA
(refers to mRNA transcripts)
- RAR
retinoic acid receptor
- RPE
retinal pigment epithelium
- RXR
retinoid X-receptor
- qRT-PCR
“real time” reverse transcription-polymerase chain reaction
Footnotes
Publisher's Disclaimer: This is a PDF file of an unedited manuscript that has been accepted for publication. As a service to our customers we are providing this early version of the manuscript. The manuscript will undergo copyediting, typesetting, and review of the resulting proof before it is published in its final citable form. Please note that during the production process errors may be discovered which could affect the content, and all legal disclaimers that apply to the journal pertain.
References
- 1.Weissbach H, Etienne F, Hoshi T, Heinemann SH, Lowther WT, Matthews B, St John G, Nathan C, Brot N. Peptide methionine sulfoxide reductase: structure, mechanism of action, and biological function. Arch Biochem Biophys. 2002;397:172–8. doi: 10.1006/abbi.2001.2664. [DOI] [PubMed] [Google Scholar]
- 2.Kim HY, Gladyshev VN. Methionine sulfoxide reductases: selenoprotein forms and roles in antioxidant protein repair in mammals. Biochem J. 2007;407:321–9. doi: 10.1042/BJ20070929. [DOI] [PubMed] [Google Scholar]
- 3.Brot N, Weissbach H. Biochemistry and physiological role of methionine sulfoxide residues in proteins. Arch Biochem Biophys. 1983;223:271–81. doi: 10.1016/0003-9861(83)90592-1. [DOI] [PubMed] [Google Scholar]
- 4.Sharov VS, Ferrington DA, Squier TC, Schoneich C. Diastereoselective reduction of protein-bound methionine sulfoxide by methionine sulfoxide reductase. FEBS Lett. 1999;455:247–50. doi: 10.1016/s0014-5793(99)00888-1. [DOI] [PubMed] [Google Scholar]
- 5.Moskovitz J, Singh VK, Requena J, Wilkinson BJ, Jayaswal RK, Stadtman ER. Purification and characterization of methionine sulfoxide reductases from mouse and Staphylococcus aureus and their substrate stereospecificity. Biochem Biophys Res Commun. 2002;290:62–5. doi: 10.1006/bbrc.2001.6171. [DOI] [PubMed] [Google Scholar]
- 6.Jung S, Hansel A, Kasperczyk H, Hoshi T, Heinemann SH. Activity, tissue distribution and site-directed mutagenesis of a human peptide methionine sulfoxide reductase of type B: hCBS1. FEBS Lett. 2002;527:91–4. doi: 10.1016/s0014-5793(02)03171-x. [DOI] [PubMed] [Google Scholar]
- 7.Kim HY, Gladyshev VN. Methionine sulfoxide reduction in mammals: characterization of methionine-R-sulfoxide reductases. Mol Biol Cell. 2004;15:1055–64. doi: 10.1091/mbc.E03-08-0629. [DOI] [PMC free article] [PubMed] [Google Scholar]
- 8.Moskovitz J, Flescher E, Berlett BS, Azare J, Poston JM, Stadtman ER. Overexpression of peptide-methionine sulfoxide reductase in Saccharomyces cerevisiae and human T cells provides them with high resistance to oxidative stress. Proc Natl Acad Sci U S A. 1998;95:14071–5. doi: 10.1073/pnas.95.24.14071. [DOI] [PMC free article] [PubMed] [Google Scholar]
- 9.Picot CR, Petropoulos I, Perichon M, Moreau M, Nizard C, Friguet B. Overexpression of MsrA protects WI-38 SV40 human fibroblasts against H2O2-mediated oxidative stress. Free Radic Biol Med. 2005;39:1332–41. doi: 10.1016/j.freeradbiomed.2005.06.017. [DOI] [PubMed] [Google Scholar]
- 10.Kantorow M, Hawse JR, Cowell TL, Benhamed S, Pizarro GO, Reddy VN, Hejtmancik JF. Methionine sulfoxide reductase A is important for lens cell viability and resistance to oxidative stress. Proc Natl Acad Sci U S A. 2004;101:9654–9. doi: 10.1073/pnas.0403532101. [DOI] [PMC free article] [PubMed] [Google Scholar]
- 11.Yermolaieva O, Xu R, Schinstock C, Brot N, Weissbach H, Heinemann SH, Hoshi T. Methionine sulfoxide reductase A protects neuronal cells against brief hypoxia/reoxygenation. Proc Natl Acad Sci U S A. 2004;101:1159–64. doi: 10.1073/pnas.0308215100. [DOI] [PMC free article] [PubMed] [Google Scholar]
- 12.Picot CR, Perichon M, Lundberg KC, Friguet B, Szweda LI, Petropoulos I. Alterations in mitochondrial and cytosolic methionine sulfoxide reductase activity during cardiac ischemia and reperfusion. Exp Gerontol. 2006;41:663–7. doi: 10.1016/j.exger.2006.03.011. [DOI] [PubMed] [Google Scholar]
- 13.Petropoulos I, Mary J, Perichon M, Friguet B. Rat peptide methionine sulphoxide reductase: cloning of the cDNA, and down-regulation of gene expression and enzyme activity during aging. Biochem J. 2001;355:819–25. doi: 10.1042/bj3550819. [DOI] [PMC free article] [PubMed] [Google Scholar]
- 14.Moskovitz J, Bar-Noy S, Williams WM, Requena J, Berlett BS, Stadtman ER. Methionine sulfoxide reductase (MsrA) is a regulator of antioxidant defense and lifespan in mammals. Proc Natl Acad Sci U S A. 2001;98:12920–5. doi: 10.1073/pnas.231472998. [DOI] [PMC free article] [PubMed] [Google Scholar]
- 15.Ruan H, Tang XD, Chen ML, Joiner ML, Sun G, Brot N, Weissbach H, Heinemann SH, Iverson L, Wu CF, Hoshi T. High-quality life extension by the enzyme peptide methionine sulfoxide reductase. Proc Natl Acad Sci U S A. 2002;99:2748–53. doi: 10.1073/pnas.032671199. [DOI] [PMC free article] [PubMed] [Google Scholar]
- 16.Lee JW, Gordiyenko NV, Marchetti M, Tserentsoodol N, Sagher D, Alam S, Weissbach H, Kantorow M, Rodriguez IR. Gene structure, localization and role in oxidative stress of methionine sulfoxide reductase A (MSRA) in the monkey retina. Exp Eye Res. 2006;82:816–27. doi: 10.1016/j.exer.2005.10.003. [DOI] [PMC free article] [PubMed] [Google Scholar]
- 17.Hansel A, Kuschel L, Hehl S, Lemke C, Agricola HJ, Hoshi T, Heinemann SH. Mitochondrial targeting of the human peptide methionine sulfoxide reductase (MSRA), an enzyme involved in the repair of oxidized proteins. Faseb J. 2002;16:911–3. doi: 10.1096/fj.01-0737fje. [DOI] [PubMed] [Google Scholar]
- 18.Kim HY, Gladyshev VN. Alternative first exon splicing regulates subcellular distribution of methionine sulfoxide reductases. BMC Mol Biol. 2006;7:11. doi: 10.1186/1471-2199-7-11. [DOI] [PMC free article] [PubMed] [Google Scholar]
- 19.Haenold R, Wassef R, Hansel A, Heinemann SH, Hoshi T. Identification of a new functional splice variant of the enzyme methionine sulphoxide reductase A (MSRA) expressed in rat vascular smooth muscle cells. Free Radic Res. 2007;41:1233–45. doi: 10.1080/10715760701642096. [DOI] [PubMed] [Google Scholar]
- 20.Sreekumar PG, Kannan R, Yaung J, Spee CK, Ryan SJ, Hinton DR. Protection from oxidative stress by methionine sulfoxide reductases in RPE cells. Biochem Biophys Res Commun. 2005;334:245–53. doi: 10.1016/j.bbrc.2005.06.081. [DOI] [PubMed] [Google Scholar]
- 21.De Luca A, Sacchetta P, Di Ilio C, Favaloro B. Identification and analysis of the promoter region of the human methionine sulphoxide reductase A gene. Biochem J. 2006;393:321–9. doi: 10.1042/BJ20050973. [DOI] [PMC free article] [PubMed] [Google Scholar]
- 22.Moskovitz J, Weissbach H, Brot N. Cloning the expression of a mammalian gene involved in the reduction of methionine sulfoxide residues in proteins. Proc Natl Acad Sci U S A. 1996;93:2095–9. doi: 10.1073/pnas.93.5.2095. [DOI] [PMC free article] [PubMed] [Google Scholar]
- 23.Andrews NC, Faller DV. A rapid micropreparation technique for extraction of DNA-binding proteins from limiting numbers of mammalian cells. Nucleic Acids Res. 1991;19:2499. doi: 10.1093/nar/19.9.2499. [DOI] [PMC free article] [PubMed] [Google Scholar]
- 24.Hanbauer I, Boja ES, Moskovitz J. A homologue of elongation factor 1 gamma regulates methionine sulfoxide reductase A gene expression in Saccharomyces cerevisiae. Proc Natl Acad Sci U S A. 2003;100:8199–204. doi: 10.1073/pnas.1432898100. [DOI] [PMC free article] [PubMed] [Google Scholar]
- 25.Hanbauer I, Moskovitz J. The yeast cytosolic thioredoxins are involved in the regulation of methionine sulfoxide reductase A. Free Radic Biol Med. 2006;40:1391–6. doi: 10.1016/j.freeradbiomed.2005.12.017. [DOI] [PubMed] [Google Scholar]
- 26.Roesijadi G, Rezvankhah S, Binninger DM, Weissbach H. Ecdysone induction of MsrA protects against oxidative stress in Drosophila. Biochem Biophys Res Commun. 2007;354:511–6. doi: 10.1016/j.bbrc.2007.01.005. [DOI] [PubMed] [Google Scholar]
- 27.Devarakonda S, Harp JM, Kim Y, Ozyhar A, Rastinejad F. Structure of the heterodimeric ecdysone receptor DNA-binding complex. Embo J. 2003;22:5827–40. doi: 10.1093/emboj/cdg569. [DOI] [PMC free article] [PubMed] [Google Scholar]
- 28.Kuschel L, Hansel A, Schonherr R, Weissbach H, Brot N, Hoshi T, Heinemann SH. Molecular cloning and functional expression of a human peptide methionine sulfoxide reductase (hMsrA) FEBS Lett. 1999;456:17–21. doi: 10.1016/s0014-5793(99)00917-5. [DOI] [PubMed] [Google Scholar]
- 29.Mangelsdorf DJ, Thummel C, Beato M, Herrlich P, Schutz G, Umesono K, Blumberg B, Kastner P, Mark M, Chambon P, Evans RM. The nuclear receptor superfamily: the second decade. Cell. 1995;83:835–9. doi: 10.1016/0092-8674(95)90199-x. [DOI] [PMC free article] [PubMed] [Google Scholar]
- 30.Germain P, Chambon P, Eichele G, Evans RM, Lazar MA, Leid M, De Lera AR, Lotan R, Mangelsdorf DJ, Gronemeyer H. International Union of Pharmacology. LX. Retinoic acid receptors. Pharmacol Rev. 2006;58:712–25. doi: 10.1124/pr.58.4.4. [DOI] [PubMed] [Google Scholar]
- 31.Nagpal S, Chandraratna RA. Recent developments in receptor-selective retinoids. Curr Pharm Des. 2000;6:919–31. doi: 10.2174/1381612003400146. [DOI] [PubMed] [Google Scholar]
- 32.Conte da Frota ML, Jr, Gomes da Silva E, Behr GA, Roberto de Oliveira M, Dal-Pizzol F, Klamt F, Moreira JC. All-trans retinoic acid induces free radical generation and modulate antioxidant enzyme activities in rat sertoli cells. Mol Cell Biochem. 2006;285:173–9. doi: 10.1007/s11010-005-9077-3. [DOI] [PubMed] [Google Scholar]
- 33.Samuel W, Kutty RK, Nagineni S, Vijayasarathy C, Chandraratna RA, Wiggert B. N-(4-hydroxyphenyl)retinamide induces apoptosis in human retinal pigment epithelial cells: retinoic acid receptors regulate apoptosis, reactive oxygen species generation, and the expression of heme oxygenase-1 and Gadd153. J Cell Physiol. 2006;209:854–65. doi: 10.1002/jcp.20774. [DOI] [PubMed] [Google Scholar]
- 34.McCaffery P, Mey J, Drager UC. Light-mediated retinoic acid production. Proc Natl Acad Sci U S A. 1996;93:12570–4. doi: 10.1073/pnas.93.22.12570. [DOI] [PMC free article] [PubMed] [Google Scholar]
- 35.Hail N, Jr, Kim HJ, Lotan R. Mechanisms of fenretinide-induced apoptosis. Apoptosis. 2006;11:1677–94. doi: 10.1007/s10495-006-9289-3. [DOI] [PubMed] [Google Scholar]
- 36.Rigobello MP, Scutari G, Friso A, Barzon E, Artusi S, Bindoli A. Mitochondrial permeability transition and release of cytochrome c induced by retinoic acids. Biochem Pharmacol. 1999;58:665–70. doi: 10.1016/s0006-2952(99)00149-5. [DOI] [PubMed] [Google Scholar]
- 37.Schmidt-Mende J, Gogvadze V, Hellstrom-Lindberg E, Zhivotovsky B. Early mitochondrial alterations in ATRA-induced cell death. Cell Death Differ. 2006;13:119–28. doi: 10.1038/sj.cdd.4401715. [DOI] [PubMed] [Google Scholar]
- 38.Gehrs KM, Anderson DH, Johnson LV, Hageman GS. Age-related macular degeneration--emerging pathogenetic and therapeutic concepts. Ann Med. 2006;38:450–71. doi: 10.1080/07853890600946724. [DOI] [PMC free article] [PubMed] [Google Scholar]
Associated Data
This section collects any data citations, data availability statements, or supplementary materials included in this article.


