

Abstract
We have investigated the interaction of D-amino acid oxidase (DAAO) with single walled carbon nanotubes (CNT) by spectroscopic ellipsometry. Dynamic adsorption experiments were performed at different experimental conditions. In addition, the activity of the enzyme adsorbed at different conditions was studied. Our results indicate that DAAO can be adsorbed to CNT at different pH values and concentrations by a combination of hydrophobic and electrostatic interactions. Considering that the highest enzymatic activity was obtained by adsorbing the protein at pH 5.7 and 0.1 mg.mL−1, our results indicate that DAAO can adopt multiple orientations on the surface; which are ultimately responsible for significant differences in catalytic activity.
Keywords: D-Amino Acid Oxidase, Spectroscopic Ellipsometry, Carbon Nanotubes, Protein Adsorption, Biosensors
Introduction
Sensitive, selective, and cost-effective analysis of biomolecules is important in clinical diagnostics and treatment. Among others, electrochemical biosensors based on enzyme-modified electrodes are very attractive because they integrate the selectivity of enzymatic reactions with highly sensitive electrochemical signal transduction.1-3 Biosensors are currently applied in clinical,1,3 environmental,4,5 agricultural,2 and pharmaceutical fields. Although different materials can be used as substrates, carbon nanotubes (CNT) have an enormous potential because they can act simultaneously as immobilization matrices and as electrochemical transducers.6-12 In addition, CNT are generally considered biocompatible,10,13,14 stable over a large range of potentials, catalytically active towards many electrochemical reactions,11,12,15,16 and provide significant increases in electrode area.15 Although considerable progress has been made by encapsulating or cross-linking enzymes,17-19 the analytical performance of CNT-biosensors still suffers from some fundamental deficiencies such as, slow response (≥ 10 sec) and limited sensitivity (∼μM). One additional problem associated with CNT-based biosensors is that the driving forces and consequences of the interaction between enzymes and CNT cannot be easily anticipated.
Although different enzymes have been used in biosensors,3-5,20 group-selective enzymes (i.e., enzymes that recognize a particular functional group instead of a particular analyte)21,22 are advantageous because they increase the versatility of the sensor, allowing the detection of several analytes with similar structure. This is the case of D-amino acid oxidase (EC 1.4.3.3, DAAO). DAAO is a flavoprotein that catalyzes the dehydrogenation of different D-amino acids to their imino- counterparts via a reduced flavin-product complex. The reduced flavin is then re-oxidized by O2 to yield H2O2, whereas the imino acid spontaneously hydrolyzes to the corresponding keto acid and NH4+.23 DAAO is strictly stereospecific and oxidizes a variety of D-amino acids, with a preference for those having small hydrophobic side chains, followed by those bearing polar, aromatic, and basic groups.24,25 Although the 3-D structure of DAAO has provided researchers the rationale for its high catalytic efficiency,26-28 the biological role of DAAO in animals is not clear yet. Recent progress in the detection of D-amino acids has linked DAAO to aging29,30 and pathological conditions such as schizophrenia,25,31,32 epilepsy, Alzheimer's disease, and renal disease.33 It has also been shown that the DAAO activity can be used as a possible cancer diagnostic test for some organs.34 Recent reviews33,35 have also pointed that D-serine and D-aspartate play significant roles in the metabolism of excitatory amino acid (being a co-agonist of the N-methyl-d-aspartate receptor), development, and endocrine function, particularly in testis, pituitary gland, and pineal gland. Other D-amino acids including D-alanine, D-leucine, D-proline, and D-glutamate have been also recently identified in the central nervous system.35 Industrially, DAAO has captured an increased attention because it can be utilized in the production of semi-synthetic cephalosporin antibiotics,36 α-ketoacids, unnatural amino acids, and various sintons (starting compounds for the production of chiral medications such as omapatrylate).24 Probably the most important industrial application of DAAO is the production of 7-amino cephalosporanic acid, which has been successfully implemented in large-scale.37
Several advantages are associated with the use of immobilized DAAO.36,38,39 DAAO can be coupled to a solid matrix via both the amino- and the carboxy- groups of the protein.38 Researchers reported that, although very high stability can be achieved (90% of the initial activity was recovered after 200 h) when DAAO from Rhodotorula gracilis (RgDAAO) was immobilized using ion exchange resins, only 20−30% of the activity of the free enzyme was preserved after the covalent immobilization.36 Pernot et al. reported that, due to a partitioning effect, the immobilization of RgDAAO yielded Km values significantly lower than those of the free enzyme in solution.25 DAAO from Trigonopsis variabilis (TvDAAO) has also been covalently immobilized to a variety of substrates.37
Although significant mechanistic differences have been reported among different DAAO variants,40 a comprehensive analysis of the driving forces and consequences of the interaction of DAAO with solid surfaces is still missing, in particular, with nanostructured surfaces such as CNT. Consequently, the hypothesis of this project was that experimental conditions can be rationally selected to maximize the adsorption of enzymes to carbon nanotubes, while preserving the enzymatic activity. Since the experimental conditions used for the adsorption have been identified to have a central effect on the enzyme conformation and activity, the objective of this paper was to describe the interaction phenomena (adsorption/desorption kinetics and amount) of DAAO to carbon nanotubes under different conditions (concentration of DAAO, pH, ionic strength). The ultimate goal is to avoid harsh immobilization conditions and trapping membranes,41,42 leading to a biologically active CNT-DAAO composite that can be subsequently applied as a biosensor.
Experimental Section
Reagents and solutions
All chemicals were analytical reagent grade and used as received. Sodium pyrophosphate (Na4P2O7), sodium chloride, and sodium hydroxide were purchased from Fisher Scientific (Fair Lawn, NJ). Sodium pyrophosphate (5 mM) was selected as the background electrolyte because it provides high buffer capacity (pKa1= 6.70, pKa2= 9.32) around the isoelectric point of the protein (IEPDAAO= 6.343 − 7.024) and does not affect the enzymatic activity.44 All aqueous solutions were prepared using 18 MΩ·cm water (NANOpure Diamond, Barnstead; Dubuque, Iowa). The pH of the solutions was adjusted using either 1 M NaOH or 1 M HCl (Fisher Scientific; Fair Lawn, NJ) and measured using a glass electrode and a digital pH meter (Orion 420A+, Thermo; Waltham, MA). D-amino acid oxidase (Sigma; Saint Louis, MO) from porcine kidney was purchased as a lyophilized powder (≥1.5 U·mg−1) and kept at −4 °C until used. Stock solutions of protein (0.1 mg·mL−1) were prepared by dissolving a known amount of protein in pyrophosphate buffer. Other protein solutions were prepared by diluting the corresponding amount of stock in pyrophosphate buffer. In all cases, the concentration of the stock solution was confirmed by spectrophotometry.
Substrates
CNT-coated silica (Si/SiO2/CNT) surfaces were used for the present studies. As described in earlier studies, 45,46 Si/SiO2/CNT surfaces were prepared by Eikos Inc. (Franklin, MA), using <111> silicon wafers (Sumco, Phoenix, AZ) as substrates. According to the provider, a layer of CNT was deposited on the wafers using arc-produced single wall CNT having about a 1.3 nm diameter. The raw material formed in the arc reactor was purified, to remove metal catalyst and non-tubular forms of carbon, by a process of acid reflux, followed by washing and centrifugation. Once purified, the nanotubes were dispersed in water and alcohol to form an ink. This dispersion was then spray coated onto the Si/SiO2 wafer heated to 65 °C while monitoring deposition rate. The coating formed is essentially a layer of pure CNT and contains no residual organic additives or polymeric constituents. Contact angle measurements of the Si/SiO2/CNT substrates were performed using a VCA-Optima Surface Analysis System (Ast Products Inc; Billerica, MA) and analyzed using the software provided by the manufacturer after 30 sec of dispensing 5 μL of de-ionized water. The average contact angle for the Si/SiO2/CNT surfaces was 26 ± 1 degrees.
Spectroscopic ellipsometry
The substrate characterization as well as the dynamic adsorption experiments were performed at room temperature using a variable angle spectroscopic ellipsometer (VASE, J.A. Woollam Co; Lincoln, NE). Spectroscopic ellipsometry has proven suitable to study adsorption of proteins, and provides useful information about the optical constants and structure of the adsorbed film.47-51 The collected data (amplitude ratio (Ψ) and phase difference (Δ) as function of wavelength or time) was modeled using the WVASE software package (J.A. Woollam Co; Lincoln, NE). The mean square error (MSE, performed with a builtin function in WVASE) was used to quantify the difference between the experimental and model generated data. In all cases, the sample under investigation was mounted on a micrometer-position-controlled translation stage with the gradient direction perpendicular to the plane of incidence. Substrates were initially characterized in air, varying the incident angle between 60° and 70° (with respect to the substrate), and the wavelength between 250 nm and 900 nm. Dynamic adsorption experiments were performed in an electrochemical cell (J.A. Woollam Co; Lincoln, NE), mounted directly on the vertical base of the ellipsometer. In all cases, the variation of Ψ and Δ as a function of time was determined at 275 nm, 450 nm, and 650 nm and at an angle of incidence of 70 °, as defined by the inlet/outlet of the UV fused-silica windows. The dynamic results discussed herein were analyzed using only the data collected at 450 nm and 650 nm. Results from data collected at 275 nm (where the protein absorbs light) will be reported separately. Under the selected conditions, a data acquisition rate of 46 sec/spectrum was achieved, enabling the calculation of the initial adsorption/desorption rates.
Unless otherwise indicated, the substrates tested were initially characterized as function of incident angle and wavelength in air. Each strip was then placed in the cell and measured using the selected aqueous buffer as the ambient medium.52 This procedure allowed verification of the thickness of each substrate at the measuring spot; therefore improving the accuracy of the calculation. Then, the dynamic experiment was initiated by pumping background electrolyte through the cell (5 min) to measure the baseline. Next, the valve was switched, protein solution was introduced, and the adsorption process started. An initial fast process, followed by a slower one was always observed. When no significant change in the signal was observed, the dynamic scan (using 3 wavelengths) was stopped, and a more accurate spectroscopic scan was collected in the 250−900 nm range (with 10 nm steps). This scan was used to verify the thickness of the protein layer. Then, the valve was switched back to the background electrolyte to investigate if the protein could be desorbed by simple dilution. Because no change in the signal was observed after ∼15 min, a more aggressive desorption experiment was performed by pumping (at the same flow rate) a solution containing 4 mM SDS. Experiments performed in this way provided data for calculating the initial adsorption rate (dΓ/dt t→0), the saturation amount (ΓSAT), the desorption rate induced by simple dilution, the desorption rate induced by SDS, and the remaining adsorbed amount. A representative sample of the collected data is shown below, in Figure 1C.
Figure 1.

A) Optical model used for modeling the adsorption-desorption kinetics. The model consists of a Si substrate (bulk), the native layer of SiO2, an EMA layer of CNT (98% void, 2% CNT), the DAAO. The ambient layer (air or buffer) has been omitted. B) SEM picture of the CNT layer. C) Spectroscopic scan as measured (points) and calculated (lines) corresponding to a layer or DAAO adsorbed to a Si/SiO2/CNT substrate. Adsorption conditions: DAAO = 0.01 mg·mL−1, pH=8.3. Other conditions as described in the Experimental section.
Cell for in situ adsorption monitoring
Dynamic adsorption experiments were performed in a commercial electrochemical cell (J.A. Woollam Co; Lincoln, NE). In order to control the protein supply to the substrate, the cell was modified by fixing a L-shaped stainless-steel tube to the cell. One end of the tube faced the substrate at the same spot where the incident light beam hits the surface. The other end of the tube was connected, using Tygon tubing, to a peristaltic pump (Minipuls3, Gilson; Middleton, WI). A 2-way valve (V100D, Upchurch Scientific; Oak Arbor, WA) was also connected in series to enable rapid switching between the background electrolyte and the protein solution. These modifications provided control of the hydrodynamic conditions as well as the flux of protein to the surface. The flow, which is characterized by the Reynolds number (Re), can be described by solving the Navier-Stokes53 equation considering the incidence angle with respect to the surface (90 °), the inner diameter of the tube (R = 0.254 mm), the distance from the tube to the surface (h = 1.27 mm), and the flow rate (1.77 mL/min). Although specific characterization of the flow cell is outside the scope of the present manuscript, the experimental setup enabled performing adsorption experiments under stagnation-point flow and provided an alternative experimental design to the ones used by Arwin47,52 or Logothetidis.54
Optical model
Interpretation of ellipsometric measurements from the raw data is rather difficult. Hence, construction of an optical model that describes the substrate microstructure in terms of the refractive index (n), extinction coefficient (k), and thickness (d) is required. The models used to describe the substrate (Si/SiO2/CNT) as well as the adsorbed protein layer are explained below.
CNT films
The substrates were modeled by three uniaxial layers with optical axes parallel to the substrate surface, as illustrated in Figure 1A. The dielectric functions of each sublayer were described by a layer of Si (bulk; d = 1 mm), a layer of SiO2 (d = 2.5 ± 0.5 nm), and a two-media Bruggeman effective medium approximation (EMA)55 layer consisting of 98% void and 2% CNT56 (d = 30 ± 5 nm). This CNT model is in good agreement with published results46 but differ slightly from CNT films prepared under other conditions.45,57-59
Related results (see Supplementary Information) also indicate that although the CNT surface is not perfectly flat and smooth (roughness ∼ 5 nm), DAAO (11 nm × 4 nm) can not interact with the Si/SiO2 substrate underneath the CNT layer.46 Furthermore, other studies have revealed that the nanometer-scale roughness (2 − 60 nm) had little effect on the amount and conformation of adsorbed proteins.60,61 The calculated thickness values used in the optical model Figure 1A) as well as the surface roughness, were verified by performing atomic force microscopy (AFM) and scanning electron microscopy (SEM, as shown in Figure 1B) on the selected substrates.
Adsorbed Protein
Considering that in the wavelength range used here the DAAO film is transparent, the adsorbed proteins were modeled with a non-absorbing layer on top of the CNT substrate. The optical constants of such layer were described using a Cauchy parameterization model according to Equation 1, where A = 1.465, B = 0.01, and C = 0 are computer-calculated fitting parameters and λ is the wavelength of the incident beam. These parameters yielded index of refraction values ranging from 1.527 to 1.477, which are consistent with previously reported values for other adsorbed proteins.52,62,63 As it can be observed in Figure 1C), the experimental data (Ψ and Δ as function of λ) are in good agreement with the described optical model (MSE < 3).
| Equation 1 |
Under the selected experimental conditions, ellipsometry can be used to determine the amount of adsorbed protein (Γ, expressed in mg·m−2) using Equation 2,
| Equation 2 |
where n and n0 are the refractive index of the protein and the ambient, respectively.64 In accordance with previous reports,65-68 the refractive index increment for the molecules in the layer (dn/dc) was assumed to be 0.187 mL·g−1.
Enzymatic Activity of DAAO
The activity of adsorbed DAAO was measured according to a modified version of a previously reported method.44 The method is based on the reaction of a D-amino acid (D-alanine, in our case) to the corresponding α-keto acid and H2O2. The produced H2O2 then reacts with hydrazine to produce hydrazone, which is determined spectrophotometrically. Instead of using a solution of DAAO, the assays were performed by dipping DAAO-coated Si/SiO2/CNT wafers in the reaction solution. For the described experiments, the reaction solution was prepared by mixing 300 μL of flavin adenine nucleotide (FAD, 0.8 μg·mL−1), 100 μL of D-phenylalanine (0.9 mg·mL−1), and 14.6 mL of pyrophosphate buffer (5 mM, pH = 8.3) at room temperature. Then, two Si/SiO2/CNT/DAAO wafers (∼4 cm2) were immersed in the solution and incubated at 37 °C for 7 hrs. Finally, 750 μL of 2,4-dinitrophenyl hydrazine was added, followed by 500 μL of concentrated NaOH. The absorbance of each solution was measured at 445 nm after the reaction was completed and the activity was calculated using the controls (DAAO in solution) as a reference. Negative (Si/SiO2/CNT) and positive controls (DAAO in solution) were processed in parallel, to be used as blank and to account for natural inactivation, respectively. Surface area was calculated as the geometric area of the wafer in contact with the analyte solution. In all cases, Si/SiO2/CNT/DAAO wafers were prepared by immersing a strip of substrate in the solution of the enzyme at the selected conditions (pH and protein concentration) for two hours. Finally, the wafers were rinsed with buffer to remove loosely bound protein and the amount of adsorbed protein was measured in the liquid cell, using the same buffer as ambient. Although the hydrodynamic conditions for the preparation of these substrates are not comparable to those used in the dynamic adsorption experiments, these results demonstrate that surfaces, with equivalent adsorbed amounts of DAAO, can be prepared by selecting equivalent adsorption conditions.
Results and Analysis
In the following sections, data related to the adsorption/desorption of DAAO as function of concentration, pH, and ionic strength as obtained by spectroscopic ellipsometry are reported and discussed.
Adsorption of DAAO
Figure 2 shows the adsorption-desorption profiles measured at different initial DAAO concentrations at pH 8.3. Both the adsorption initial rate and the saturation amount strongly depend on the bulk concentration of protein. In all cases, the higher the protein concentration, the faster the ΓSAT was reached, and the greater the ΓSAT value. For example, 91 % of the saturation amount (ΓSAT = 3.8 mg·mL−1) was obtained in about 35 min when DAAO = 0.1 mg·mL−1. These results are in good agreement with previous reports stating that at high initial adsorption rates, the surface is quickly filled, and the protein molecules have little time to spread. Consequently, more protein molecules can be accommodated on the same surface area and saturation amount increases with increasing concentration of protein in solution.69
Figure 2.
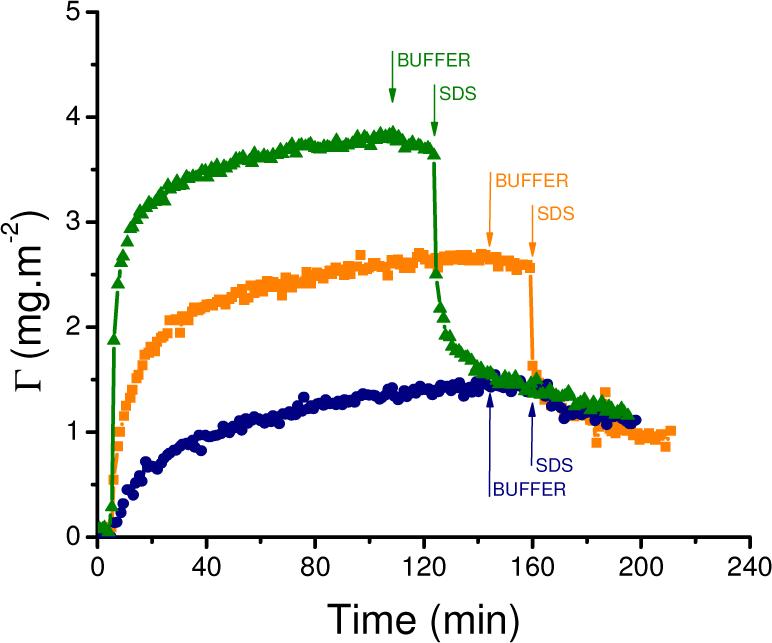
Adsorption kinetics of 0.1 mg·mL−1 (-▲-),0.01 mg·mL−1 (-■-), and 0.001 mg·mL−1 (-●-) DAAO on CNT at pH = 8.3. Desorption induced with buffer (↓BUFFER) and then 4 mM SDS (↓SDS). Other conditions, as described in the Experimental Section.
It is well known that the adsorption process depends, among other variables, on the electrostatic interactions between the proteins and the solid surfaces. In order to investigate the effect of these interactions, adsorption kinetics were measured above, at, and below the isoelectric point (IEP) of the protein (IEPDAAO = 6.343 − 7.024) Figure 3 shows that both the initial adsorption rate and the saturation amount are significantly affected by the pH of the solution (DAAO = 0.01 mg·mL−1). As a result of the balance among the available surface sites, the conformation of the adsorbed protein, and the lateral interaction between adsorbed molecules, the highest adsorbed amount was obtained when the protein charge was minimized (around the IEP, pH = 6.5). These results are in line with a rather general phenomenon in protein adsorption.70 Supporting this, Cohen Stuart has stated that proteins in the isoelectric point do not have a net charge, thus electrostatic repulsion between adsorbed molecules is at a minimum, and proteins can attain closer packing.71 From the adsorption kinetics experiments it is also clear that the largest energetic barrier was found at pH=8.3, where the protein and the surface are negatively charged, resulting in increased electrostatic repulsions between the surface and the proteins.
Figure 3.
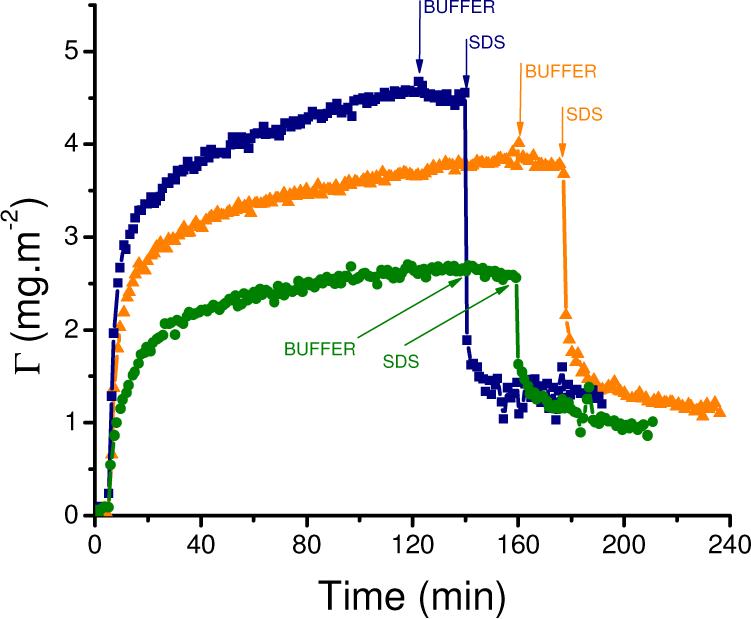
Adsorption kinetics of 0.01 mg/mL DAAO on CNT performed at pH = 5.7 (-▲-), pH = 6.5 (-■-), and pH = 8.3 (-●-). Desorption induced with buffer (↓BUFFER) and then 4 mM SDS (↓SDS). Other conditions, as described in the Experimental Section.
To evaluate the strength of these electrostatic interactions, measurements at different ionic strengths (and two protein concentrations) were also performed. As shown in Figure 4, only slight changes in both the initial adsorption rate and the saturation amount were obtained by the addition of 100 mM NaCl to the background electrolyte (5 mM pyrophosphate, pH = 8.3). These small differences, which are within the experimental error of the measurements, could be attributed to small variations in the flow rate, protein concentration, or temperature. Although the surface of the CNT layer is rather hydrophilic, these experiments also support the hypothesis that the driving forces for adsorption (hydrophobic interactions, co-adsorption of ions, redistribution of charged groups, etc)72 of DAAO to CNT largely prevail over the electrostatic repulsion.
Figure 4.
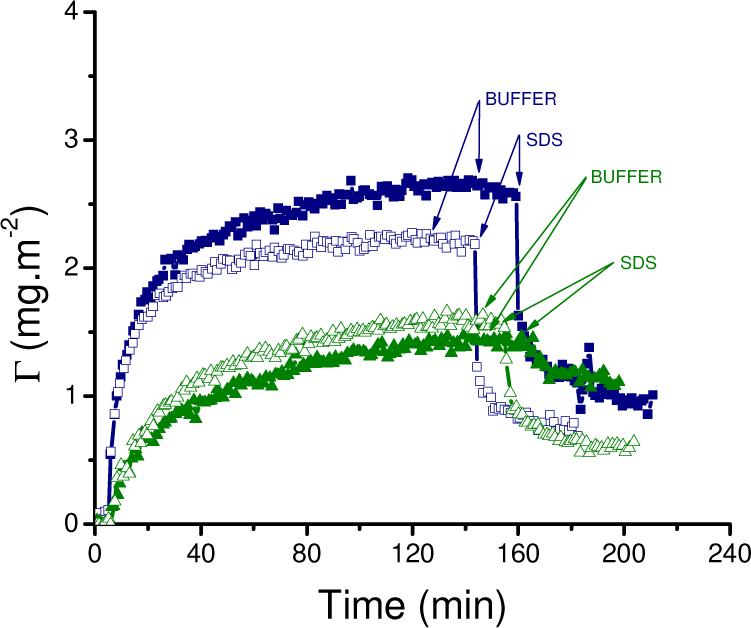
Adsorption kinetics of 0.01 mg·mL−1 (-■-) and 0.001 mg·mL−1 (-▲-) DAAO on CNT performed in 5 mM pyrophosphate buffer pH = 8.3. Desorption induced with buffer (↓BUFFER) and then 4 mM SDS (↓SDS). Experiments performed upon the addition of 100 mM NaCl are marked with open symbols. Other conditions, as described in the Experimental Section.
Desorption of DAAO
In order to obtain information about the stability of the adsorbed layer, desorption experiments were performed by simple dilution (switching from the protein containing solution, to the background electrolyte) and by competitions with SDS.73,74 Because >98% of the adsorbed protein remains attached after a 15-min buffer rinsing step, it can be concluded that DAAO can not be desorbed from the CNT surface by dilution. However, DAAO can be desorbed by competition with surfactants such as SDS (4 mM, see Figures 2-4). Interestingly, different adsorption experiments showed similar desorption kinetics (average dΓ/dtDES = 1.4 ± 0.4 mg.m−2min−1) and similar remaining amounts of protein attached to the CNT surface (average Γ2 = 1.0 ± 0.4 mg.m−2). This suggests that regardless of the adsorption conditions, a relatively constant amount of DAAO undergoes structural changes upon adsorption, maximizes the interaction with the surface, and remains attached. Analogous behaviors have been previously reported for other proteins on different surfaces (lysozyme,75 albumin, and fibrinogen69,76-80). However, our results revealed significant differences respect to the interaction between albumin and similar CNT films.46 The fact that a fraction of the adsorbed DAAO can be displaced by competition is relevant to the development of biosensors because it could enable reconditioning the surface by a simple rinsing step.
Activity of DAAO adsorbed on CNT
Although proteins in aqueous solutions readily adsorb to almost any available solid–liquid interface, the adsorption process often involves changes in protein conformation at the surface, and in some cases this can result in inactivation of the adsorbed protein.81 For this reason, protein activity can be regarded as one of the most sensitive probes for studying the changes in protein conformation, since it reflects subtle readjustments of the active site. The purpose of these experiments was, therefore, to understand whether or not the nanoenvironment of the CNT and adsorption conditions affects the activity of the adsorbed enzyme. Figure 5 shows the enzymatic activity and the adsorbed amount of DAAO (measured after equilibrium was reached) as a function of the protein adsorption conditions. These results provide evidence that the enzymatic activity correlates with the adsorbed amount of protein, if the adsorption reaction is performed at pH = 5.7. More importantly, Figure 5 shows that although surfaces may contain different amounts of enzyme, they always displayed lower enzymatic activity when prepared at or above the isoelectric point of the protein.
Figure 5.
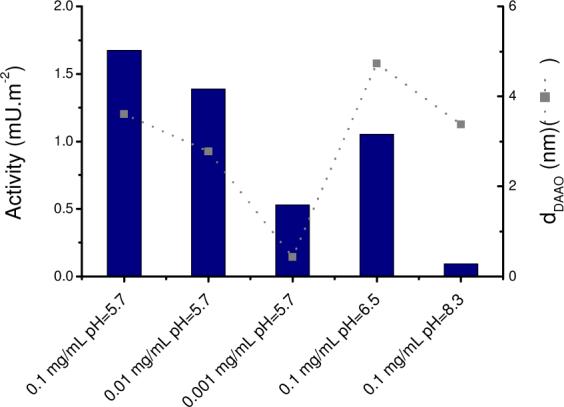
Comparison between the enzymatic activity and amount of DAAO adsorbed to CNT under different experimental conditions. Lines included to guide the eye. Other conditions, as described in the Experimental Section.
Discussion and Conclusions
In general, all adsorption experiments exhibited a similar general behavior: (1) DAAO adsorbed to the CNT layer by a single step; (2) DAAO was not significantly affected by rinsing the surface with buffer; and (3) part of the adsorbed layer was removed by rinsing the surface with 4 mM SDS. Neither the desorption kinetics nor the remaining amount of protein attached to the CNT surface was affected by the amount of DAAO adsorbed (ΓSAT). Based on these experimental observations, the total adsorbed (ΓSAT) amount could be represented by the sum of two different populations of DAAO: one that could be removed by SDS (Γ1), and one (Γ2) that remains attached after washing the surface with the surfactant (ΓSAT = Γ1 + Γ2). Table 1 summarizes results regarding the initial adsorption rates, Γ1, Γ2, and ΓSAT.
Table 1.
Calculated initial adsorption rate (dΓ/dtADS), saturation amount (ΓSAT), initial desorption rate induced by 4 mM SDS (dΓ/dtDES), and remaining amount of protein after rinsing the surface with 4 mM SDS (Γ2) during 120 min. Other conditions, as described in the Experimental section.
| pH | NaCl (mM) | DAAO (mg·mL−1) | dΓ/dtADS (mg·m−2·min−1) | ΓSAT (mg·m−2) | dΓ/dtDES (mg·m−2·min−1) | Γ1 (mg·m−2) | Γ2 (mg·m−2) |
|---|---|---|---|---|---|---|---|
| 8.3 | 0 | 0.1 | 2.8 | 3.5 | 1.5 | 2.3 | 1.2 |
| 0 | 0.01 | 0.3 | 2.5 | 1.2 | 1.6 | 0.9 | |
| 0 | 0.001 | 0.1 | 1.5 | 0.2 | 0.4 | 1.1 | |
| 100 | 0.01 | 0.3 | 2.7 | 1.2 | 1.9 | 0.8 | |
| 100 | 0.001 | 0.1 | 1.7 | 0.3 | 1.1 | 0.6 | |
| 6.5 | 0 | 0.1 | 7.1 | 6.9 | 1.8 | 5.7 | 1.2 |
| 0 | 0.01 | 0.7 | 4.0 | 1.9 | 2.8 | 1.2 | |
| 0 | 0.001 | 0.1 | 2.0 | 0.5 | 0.7 | 1.3 | |
| 5.7 | 0 | 0.1 | 6.6 | 6.4 | 1.9 | 4.7 | 1.7 |
| 0 | 0.01 | 0.8 | 3.9 | 1.0 | 2.6 | 1.3 | |
| 0 | 0.001 | 0.1 | 2.7 | 1.4 | 1.8 | 0.9 |
Thickness values obtained from spectroscopic ellipsometry indicate that DAAO can adopt multiple orientations (horizontal or tilted with different angles, with respect to the surface). In agreement with other reports,46,70,71 it can be observed that the maximum adsorbed amount occurs at the isoelectric point of the protein and that both the initial adsorption rate and the population loosely attached (Γ1) to the surface increase as the bulk protein concentration increases. On the other hand, the population that remains adsorbed upon washing with 4 mM SDS (Γ2) does not depend (within experimental error) on the adsorbed amount of DAAO. In all cases, about 1 mg·m−2 of protein remained attached to the CNT surface. This behavior could be attributed to a stronger interaction of DAAO (53% hydrophobic amino acids) with hydrophobic sites in the CNT film. Probably, the majority of the observed enzymatic activity (Figure 5) is imparted by Γ1.
Considering that DAAO (MW = 80.6 KDa) exhibits an elongated ellipsoidal framework with approximate dimensions of 11 nm (length) × 4 nm (width),27 our results suggest the formation of a monolayer of DAAO on the CNT surface. The largest thickness of adsorbed DAAO was obtained at pH = 6.5 (dDAAO = 6.5 nm), when the electrostatic interactions are minimized. At this pH, DAAO could adopt a tip-to-surface alignment, with an angle of approximately 66 degrees, with respect to the CNT surface. The enzymatic activity of the DAAO adsorbed at pH = 6.5, also concurs with the general belief that high structural stability (and therefore a smaller tendency to spread) can be achieved around the isoelectric point of the protein.71 If we now consider the results obtained at 0.1 mg·mL−1 of DAAO above and below the isoelectric point (Figure 5), it can be observed that although the conformation of adsorbed DAAO was similar (dDAAO = 5.0 nm at pH = 5.7; dDAAO = 4.7 nm at pH = 8.3), the enzymatic activity of these nanocomposites was significantly different (1.7 mU·m−2 at pH = 5.7; 0.09 mU·m−2 at pH = 8.3). In order to explain these results, the charge of DAAO as function of pH was computed using the most recent sequence registered in the Protein Data Bank (1ve9). It was observed that the charge at pH = 5.7 was approximately +7.2, while the charge at pH=8.3 was approximately −3.1 (see Supplementary information). These results indicate that electrostatic interactions between the CNT surface and the protein, as well as among the adsorbed molecules could be higher at pH = 5.7, favoring a particular orientation of DAAO, which exposes the active site to the solution but maintain the molecules separated. When DAAO is adsorbed at pH=8.3 (and the charge is only −3.1), molecules could adopt a different conformation, be close enough to interact with each other, and block each other's active sites. This hypothesis was supported by the identification of the protein-protein interaction interfaces using POLYVIEW 3D. It was observed (See Supplementary Information), that DAAO could interact with other molecules using residues located in only one side of the protein, and that those residues are situated above the active site of DAAO. Although no reference was made to the activity, this side-to-side interaction has been proposed for RgDAAO.40
In agreement with previous reports performed with other proteins (such as albumin, 46,82,83 C1q,84 or fibronectin85), the adsorption of DAAO to CNT is controlled by a combination of hydrophobic and electrostatic and interactions. Despite of the amount, the adsorbed DAAO could undergo small changes in orientation/conformation on the CNT surface, which are responsible for significant differences in the biological activity of the adsorbed protein. Our results indicate that the rational preparation of biosensors requires a careful combination of the protein structure and the surface81 as well as obtaining detailed information related to the adsorption process. Although predicting the final performance of a biosensor is not trivial at present, a combination of experiments and theoretical calculations could soon allow the rational development of biosensors and biocatalysts.
Supplementary Material
Acknowledgments
Financial support for this project was provided in part by The University of Texas at San Antonio, and the National Institute of General Medical Sciences (NIGMS) / National Institutes of Health (1SC3GM081085). The authors would also like to thank D. Olmos and Dr. M. Yacaman (Department of Physics, UTSA) for their assistance with SEM imaging, Dr. M. Miller (SwRI) for assistance with AFM, and Ron Synowicki (J.A. Woollam Co.) for his help with the ellipsometer.
References
- 1.D'Orazio P. Clin. Chim. Acta. 2003;334:41–69. doi: 10.1016/s0009-8981(03)00241-9. [DOI] [PubMed] [Google Scholar]
- 2.Alaejos MS, Garcia Montelongo FJ. Chem. Rev. 2004;104:3239–3266. doi: 10.1021/cr0304471. [DOI] [PubMed] [Google Scholar]
- 3.Wang J. Biosens. Bioelectron. 2006;21:1887–1892. doi: 10.1016/j.bios.2005.10.027. [DOI] [PubMed] [Google Scholar]
- 4.Rogers KR. Anal. Chim. Acta. 2006;568:222–231. doi: 10.1016/j.aca.2005.12.067. [DOI] [PubMed] [Google Scholar]
- 5.Gooding JJ. Anal. Chim. Acta. 2006;559:137–151. doi: 10.1016/j.aca.2005.05.083. [DOI] [PubMed] [Google Scholar]
- 6.Cai C, Chen J. Anal. Biochem. 2004;332:75–83. doi: 10.1016/j.ab.2004.05.057. [DOI] [PubMed] [Google Scholar]
- 7.Zhang M, Smith A, Gorski W. Anal. Chem. 2004;76:5045–50. doi: 10.1021/ac049519u. [DOI] [PubMed] [Google Scholar]
- 8.Lenihan JS, Gavalas VG, Wang J, Andrews R, Bachas LG. J Nanosci Nanotechnol. 2004;4:600–604. doi: 10.1166/jnn.2004.150. [DOI] [PubMed] [Google Scholar]
- 9.Lin Y, Taylor S, Li H, Fernando KAS, Qu L, Wang W, Gu L, Zhou B, Sun Y-P. J. Mater. Chem. 2004;14:527–541. [Google Scholar]
- 10.Liu Y, Qu X, Guo H, Chen H, Liu B, Dong S. Biosens. Bioelectron. 2006;21:2195–2201. doi: 10.1016/j.bios.2005.11.014. [DOI] [PubMed] [Google Scholar]
- 11.Qi H, Zhang C, Li X. Sens. Actuators B. 2006;114:364–370. [Google Scholar]
- 12.Weber J, Kumar A, Kumar A, Bhansali S. Sens. Actuators B. 2006;117:308–313. [Google Scholar]
- 13.Garibaldi S, Brunelli C, Bavastrello V, Ghigliotti G, Nicolini C. Nanotechnology. 2006:391–397. [Google Scholar]
- 14.Smart SK, Cassady AI, Lu GQ, Martin DJ. Carbon. 2006;44:1034–1047. [Google Scholar]
- 15.Zhang M, Gorski W. Anal. Chem. 2005;77:3960–3965. doi: 10.1021/ac050059u. [DOI] [PubMed] [Google Scholar]
- 16.Sánchez S, Roldán M, Pérez S, Fàbregas E. Anal. Chem. 2008;80:6508–6514. doi: 10.1021/ac7025282. [DOI] [PubMed] [Google Scholar]
- 17.Eggins BR. Chemical sensors and biosensors. Wiley; West Sussex, England: 2002. pp. 98–106. [Google Scholar]
- 18.Krajewska B. Enzyme Microb. Tech. 2004;35:126–139. [Google Scholar]
- 19.López MS-P, López-Cabarcos E, López-Ruiz B. Biomol. Eng. 2006;23:135–147. doi: 10.1016/j.bioeng.2006.04.001. [DOI] [PubMed] [Google Scholar]
- 20.Ricci F, Palleschi G. Biosens. Bioelectron. 2005;21:389–407. doi: 10.1016/j.bios.2004.12.001. [DOI] [PubMed] [Google Scholar]
- 21.Tessema M, Larsson T, Buttler T, Csoregi E, Ruzgas T, Nordling M, Lindquist S-E, Pettersson G, Gorton L. Anal. Chim. Acta. 1997;349:179–188. [Google Scholar]
- 22.Wang J, Chen G. Talanta. 2003;60:1239–1244. doi: 10.1016/S0039-9140(03)00233-9. [DOI] [PubMed] [Google Scholar]
- 23.Umhau S, Pollegioni L, Molla G, Diederichs K, Welte W, Pilone MS, Ghisla S. PNAS. 2000;97:12463–12468. doi: 10.1073/pnas.97.23.12463. [DOI] [PMC free article] [PubMed] [Google Scholar]
- 24.Tishkov VI, Khoronenkova SV. Biochem. 2005;70:40–54. [PubMed] [Google Scholar]
- 25.Pernot P, Mothet J-P, Schuvailo O, Soldatkin A, Pollegioni L, Pilone M, Adeline M-T, Cespuglio R, Marinesco S. Anal. Chem. 2008;80:1589–1597. doi: 10.1021/ac702230w. [DOI] [PubMed] [Google Scholar]
- 26.Mattevi A, Vanoni MA, Todone F, Rizzi M, Teplyakov A, Coda A, Bolognesi M, Curti B. PNAS. 1996;93:7496–7501. doi: 10.1073/pnas.93.15.7496. [DOI] [PMC free article] [PubMed] [Google Scholar]
- 27.Mizutani H, Miyahara I, Hirotsu K, Nishina Y, Shiga K, Setoyama C, Miura R. J Biochem. 1996;120:14–17. doi: 10.1093/oxfordjournals.jbchem.a021376. [DOI] [PubMed] [Google Scholar]
- 28.Pollegioni L, Iametti S, Fessas D, Caldinelli L, Piubelli L, Barbiroli A, Pilone MS, Bonomi F. Protein Sci. 2003;12:1018–1029. doi: 10.1110/ps.0234603. [DOI] [PMC free article] [PubMed] [Google Scholar]
- 29.Nagata Y, Akino T, Ohno K, Kataoka Y, Ueda T, Sakurai T, Shiroshita K, Yasuda T. Clin. Sci. 1987;73:105–8. doi: 10.1042/cs0730105. [DOI] [PubMed] [Google Scholar]
- 30.D'Aniello A, D'Onofrio G, Pischetola M, D'Aniello G, Vetere A, Petrucelli L, Fisher GH. J. Biol. Chem. 1993;268:26941–26949. [PubMed] [Google Scholar]
- 31.Hall D, Gogos JA, Karayiorgou M. Genes Brain Behav. 2004;3:240–248. doi: 10.1111/j.1601-183X.2004.00078.x. [DOI] [PubMed] [Google Scholar]
- 32.Quan Z, Song Y, Feng Y, LeBlanc MH, Liu Y-M. Anal. Chim. Acta. 2005;528:101–106. [Google Scholar]
- 33.Hamase K, Morikawa A, Zaitsu K. J. Chromatogr. B. 2002;781:73–91. doi: 10.1016/s1570-0232(02)00690-6. [DOI] [PubMed] [Google Scholar]
- 34.Sasamura T, Matsuda A, Kokuba Y. Ann Clin Biochem. 2002;39:595–8. doi: 10.1177/000456320203900608. [DOI] [PubMed] [Google Scholar]
- 35.Fuchs SA, Berger R, Klomp LWJ, de Koning TJ. Mol. Gen. Metab. 2005;85:168–180. doi: 10.1016/j.ymgme.2005.03.003. [DOI] [PubMed] [Google Scholar]
- 36.Pilone MS, Pollegioni L. Biocatal. Biotransform. 2002;20:145–159. [Google Scholar]
- 37.Dib I, Nidetzky B. BMC Biotechnology. 2008;8:72. doi: 10.1186/1472-6750-8-72. [DOI] [PMC free article] [PubMed] [Google Scholar]
- 38.Betancor L, Hidalgo A, Fernandez-Lorente G, Mateo C, Rodriguez V, Fuentes M, Lopez-Gallego F, Fernandez-Lafuente R, Guisan JM. Biotechnol. Prog. 2003;19:784–748. doi: 10.1021/bp025761f. [DOI] [PubMed] [Google Scholar]
- 39.Fernandez-Lafuente R, Rodriguez V, Mateo C, Fernandez-Lorente G, Arminsen P, Sabuquillo P, Guisan JM. J. Molec. Catalysis B. 1999;7:173–179. [Google Scholar]
- 40.Pollegioni L, Diederichs K, Molla G, Umhau S, Welte W, Ghisla S, Pilone MS. J. Mol. Biol. 2002;324:535–46. doi: 10.1016/s0022-2836(02)01062-8. [DOI] [PubMed] [Google Scholar]
- 41.Duran N, Rosa MA, Annibale A, Gianfreda L. Enzyme Microb. Technol. 2002;31:907–931. [Google Scholar]
- 42.Rivas GA, Rubianes MD, Rodríguez MC, Ferreyra NF, Luque GL, Pedano ML, Miscoria SA, Parrado C. Talanta. 2007;74:291–307. doi: 10.1016/j.talanta.2007.10.013. [DOI] [PubMed] [Google Scholar]
- 43.Yagi K, Ohishi N. J. Biochem. 1972;71:993–998. doi: 10.1093/oxfordjournals.jbchem.a129871. [DOI] [PubMed] [Google Scholar]
- 44.Nagata Y, Akino T, Ohno K. Anal. Biochem. 1985;150:238–242. doi: 10.1016/0003-2697(85)90465-8. [DOI] [PubMed] [Google Scholar]
- 45.Barnes TM, van de Lagemaat J, Levi D, Rumbles G, Coutts TJ, Weeks CL, Britz DA, Levitsky I, Peltola J, Glatkowski P. Phys. Rev. B. 2007;75:23541001–2354110. [Google Scholar]
- 46.Valenti LE, Fiorito PA, Garcia CD, Giacomelli CE. J. Colloid Interface Sci. 2007;307:349–356. doi: 10.1016/j.jcis.2006.11.046. [DOI] [PubMed] [Google Scholar]
- 47.Arwin H. Thin Solid Films. 1998;313−314:764–774. [Google Scholar]
- 48.Vinnichenko M, Gago R, Huang N, Leng YX, Sun H, Kreissig U, Kulish MP, Maitz MF. Thin Solid Films. 2004;455−456:530–534. [Google Scholar]
- 49.Karlsson LM, Schubert M, Ashkenov N, Arwin H. Thin Solid Films. 2004;455−456:726–730. [Google Scholar]
- 50.Wang X, Wang Y, Xu H, Shan H, Lu JR. J. Colloid Interface Sci. 2008;323:18–25. doi: 10.1016/j.jcis.2008.04.024. [DOI] [PubMed] [Google Scholar]
- 51.Lousinian S, Logothetidis S, Laskarakis A, Gioti M. Biomol. Eng. 2007;24:107–112. doi: 10.1016/j.bioeng.2006.05.014. [DOI] [PubMed] [Google Scholar]
- 52.Poksinski M, Arwin H. Thin Solid Films. 2004;455−456:716–721. [Google Scholar]
- 53.Adamczyk Z, Siwek B, Warszynski P. J. Colloid Interface Sci. 2002;248:244–254. doi: 10.1006/jcis.2002.8243. [DOI] [PubMed] [Google Scholar]
- 54.Lousinian S, Logothetidis S. Microelectron. Eng. 2007;84:479–485. [Google Scholar]
- 55.Fujikawa H. Spectroscopic Ellipsometry. John Wiley; New York: 2006. [Google Scholar]
- 56.Arakawa ET, Dolfini SM, Ashley JC, Williams MW. Phys. Rev. B. 1985;31:8097–8101. doi: 10.1103/physrevb.31.8097. [DOI] [PubMed] [Google Scholar]
- 57.Wu Z, Chen Z, Du X, Logan JM, Sippel J, Nikolou M, Kamaras K, Reynolds JR, Tanner DB, Hebard AF, Rinzler AG. Science. 2004;305:1273–6. doi: 10.1126/science.1101243. [DOI] [PubMed] [Google Scholar]
- 58.Elim HI, Ji W, Ma GH, Lim KY, Sow CH, Huan CHA. Appl. Phys. Lett. 2004;85:1799–1801. [Google Scholar]
- 59.Fanchini G, Miller S, Parekh BB, Chhowalla M. Nano Lett. 2008;8:2176–2179. doi: 10.1021/nl080563p. [DOI] [PubMed] [Google Scholar]
- 60.Cai K, Bossert J, Jandt KD. Colloids Surf. B. 2006;49:136–144. doi: 10.1016/j.colsurfb.2006.02.016. [DOI] [PubMed] [Google Scholar]
- 61.Han M, Sethuraman A, Kane RS, Belfort G. Langmuir. 2003;19:9868–9872. [Google Scholar]
- 62.Logothetidis S, Gioti M, Lousinian S, Fotiadou S. Thin Solid Films. 2005;482:126–132. [Google Scholar]
- 63.Filippini D, Winquist F, Lundström I. Anal. Chim. Acta. 2008;625:207–214. doi: 10.1016/j.aca.2008.07.022. [DOI] [PubMed] [Google Scholar]
- 64.De Feijter JA, Benjamins J, Veer FA. Biopolymers. 1978;17:1759–1772. [Google Scholar]
- 65.Lassen B, Malmsten M. J. Colloid Interface Sci. 1996;179:470–477. [Google Scholar]
- 66.Kurrat R, Prenosil JE, Ramsden JJ. J. Colloid Interface Sci. 1997;185:1–8. doi: 10.1006/jcis.1996.4528. [DOI] [PubMed] [Google Scholar]
- 67.Giacomelli CE, Esplandiu MJ, Ortiz PI, Avena MJ, De Pauli CP. J. Colloid Interface Sci. 1999;218:404–411. doi: 10.1006/jcis.1999.6434. [DOI] [PubMed] [Google Scholar]
- 68.Vinnichenko M, Gago R, Huang N, Leng YX, Sun H, Kreissig U, Kulish MP, Maitz MF. Thin Solid Films. 2004;455−456:530–534. [Google Scholar]
- 69.van der Veen M, Stuart MC, Norde W. Colloids Surf. B. 2007;54:136–142. doi: 10.1016/j.colsurfb.2006.08.017. [DOI] [PubMed] [Google Scholar]
- 70.Haynes CA, Norde W. Colloids Surf. B. 1994;2:517–566. [Google Scholar]
- 71.van der Veen M, Norde W, Stuart MC. Colloids Surf. B. 2004;35:33–40. doi: 10.1016/j.colsurfb.2004.02.005. [DOI] [PubMed] [Google Scholar]
- 72.Norde W. In: Biopolymers at Interfaces. Malmsten M, editor. Vol. 110. Marcel Dekker; New York: 2003. [Google Scholar]
- 73.Pugnaloni LA, Ettelaie R, Dickinson E. Colloids Surf. B. 2003;31:149–157. [Google Scholar]
- 74.Miller R, Grigoriev DO, Kragel J, Makievski AV, Maldonado-Valderrama J, Leser M, Michel M, Fainerman VB. Food Hydrocolloid. 2005;19:479–483. [Google Scholar]
- 75.Larsericsdotter H, Oscarsson S, Buijs J. J. Colloid Interface Sci. 2004;276:261–268. doi: 10.1016/j.jcis.2004.03.056. [DOI] [PubMed] [Google Scholar]
- 76.Giacomelli CE, Norde W. J. Colloid Interface Sci. 2001;233:234–240. doi: 10.1006/jcis.2000.7219. [DOI] [PubMed] [Google Scholar]
- 77.Norde W, Zoungrana T. Biotechnol. Appl. Biochem. 1998;28:133–143. [PubMed] [Google Scholar]
- 78.Giacomelli CE, Norde W. In: Encyclopedia of Surface and Colloid Science. Hubbard AT, editor. Vol. 1. Marcel Dekker; New York: 2003. [Google Scholar]
- 79.Bernabeu P, Tamisier L, De Cesare A, Caprani A. Electrochim. Acta. 1988;33:1129–1136. [Google Scholar]
- 80.Zhang Y, Fung Y, Sun H, Zhu D, Yao S. Sens. Actuators B. 2005;108:933–942. [Google Scholar]
- 81.Karajanagi SS, Vertegel AA, Kane RS, Dordick JS. Langmuir. 2004;20:11594–11599. doi: 10.1021/la047994h. [DOI] [PubMed] [Google Scholar]
- 82.Shen J-W, Wu T, Wang Q, Kang Y. Biomaterials. 2008;29:3847. doi: 10.1016/j.biomaterials.2008.06.013. [DOI] [PubMed] [Google Scholar]
- 83.Edri E, Regev O. Anal. Chem. 2008;80:4049–4054. doi: 10.1021/ac800124x. [DOI] [PubMed] [Google Scholar]
- 84.Salvador-Morales C, Flahaut E, Sim E, Sloan J, H. Green ML, Sim RB. Mol. Immunol. 2006;43:193–201. doi: 10.1016/j.molimm.2005.02.006. [DOI] [PubMed] [Google Scholar]
- 85.Khang D, Kim SY, Liu-Snyder P, Palmore GTR, Durbin SM, Webster TJ. Biomaterials. 2007;28:4756–4768. doi: 10.1016/j.biomaterials.2007.07.018. [DOI] [PubMed] [Google Scholar]
Associated Data
This section collects any data citations, data availability statements, or supplementary materials included in this article.