Abstract
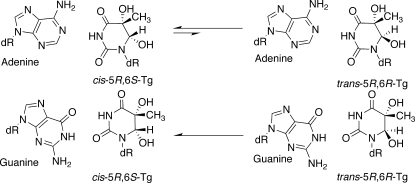
Thymine glycol (Tg), 5,6-dihydroxy-5,6-dihydrothymine, is formed in DNA by the reaction of thymine with reactive oxygen species. The 5R Tg lesion was incorporated site-specifically into 5′-d(G1T2G3C4G5Tg6G7T8T9T10G11T12)-3′; Tg = 5R Tg. The Tg-modified oligodeoxynucleotide was annealed with either 5′-d(A13C14A15A16A17C18A19C20G21C22A23C24)-3′, forming the Tg6•A19 base pair, corresponding to the oxidative damage of thymine in DNA, or 5′-d(A13C14A15A16A17C18G19C20G21C22A23C24)-3′, forming the mismatched Tg6•G19 base pair, corresponding to the formation of Tg following oxidative damage and deamination of 5-methylcytosine in DNA. At 30 °C, the equilibrium ratio of cis-5R,6S:trans-5R,6R epimers was 7:3 for the duplex containing the Tg6•A19 base pair. In contrast, for the duplex containing the Tg6•G19 base pair, the cis-5R,6S:trans-5R,6R equilibrium favored the cis-5R,6S epimer; the level of the trans-5R,6R epimer remained below the level of detection by NMR. The data suggested that Tg disrupted hydrogen bonding interactions, either when placed opposite to A19 or G19. Thermodynamic measurements indicated a 13 °C reduction of Tm regardless of whether Tg was placed opposite dG or dA in the complementary strand. Although both pairings increased the free energy of melting by 3 kcal/mol, the melting of the Tg•G pair was more enthalpically favored than was the melting of the Tg•A pair. The observation that the position of the equilibrium between the cis-5R,6S and trans-5R,6R thymine glycol epimers in duplex DNA was affected by the identity of the complementary base extends upon observations that this equilibrium modulates the base excision repair of Tg [Ocampo-Hafalla M. T.; Altamirano A.; Basu A. K.; Chan M. K.; Ocampo J. E.; Cummings A. Jr.; Boorstein R. J.; Cunningham R. P.; Teebor G. W. DNA Repair (Amst)2006, 5, 444−454].
Introduction
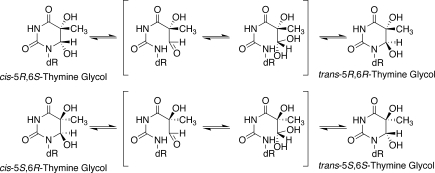
The common thymine oxidation product in DNA, 5,6-dihydroxy-5,6dihydro-2′-thymine, known as thymine glycol (Tg), is formed by exposure to ionizing radiation as well as a variety of chemical oxidizing agents.1,2 Tg is also formed by oxidation of 5-methylcytosine followed by hydrolytic deamination of the unstable 5-methylcytosine glycol.3,4 Once formed, the C5 and C6 atoms in Tg are chiral, and thus, Tg exists in DNA as two diastereomeric pairs of epimers, the 5R cis,trans pair (5R,6S;5R,6R) and the 5S cis,trans pair (5S,6R;5S,6S) (Scheme 1).5–7 For the 5R pair of epimers, the rate of epimerization at the nucleoside level is 5.8 × 10⁻³ min−1.6 The 5R pair is more abundant and more stable.6 For both the 5R and 5S pairs, the cis epimers predominate at the nucleoside level.6 Tg has been detected in animal and human urine.8,9 It is estimated that human cells repair hundreds of thymine glycol lesions per day.8,9
Scheme 1. Interconversion of the cis-5R,6S- and trans-5R,6R-Tg Lesions and the cis-5S,6R- and trans-5S,6S-Tg Lesions.
Tg inhibits DNA synthesis by many prokaryotic and eukaryotic DNA polymerases one nucleotide before and opposite the lesion site, although several DNA polymerases lacking 3′ 5′ exonuclease activity can bypass it, albeit more slowly than a control.10–12 The bypass of Tg by Y-family DNA polymerases is stereospecific, with pol η bypassing the 5R epimers more efficiently13 and pol κ bypassing the 5S epimers more efficiently.14 The base excision repair processing of Tg is also dependent upon stereochemistry. The human hNTH1 glycosylase, which repairs pyrimidine lesions arising from oxidative damage,15 shows a 13:1 preference for excising the 5R epimers vs the 5S epimers, whereas the hNEIL1 glycosylase16,17 shows a 1.5:1 preference for excising the 5R epimers vs the 5S epimers.18 Similar observations have been made for prokaryotic, yeast, and murine glycosylases.19 Ocampa-Hafalla et al.20 have shown that the repair of Tg by DNA N-glycosylases/AP lyases is modulated by the cis−trans epimerization of these two sets of diastereomers. The base excision repair of these lesions also depends upon the identity of the opposing base. The hNth glycosylase repairs the cis-5R,6S Tg more efficiently when it is placed opposite adenine than when placed opposite guanine.20
The more abundant 5R Tg lesion6 was structurally examined in the 5′-ATgA-3′ sequence, paired opposite dA.21 These studies concluded that Tg induced a localized structural perturbation, and that Tg was extrahelical.21 It had also been reported that the structure of the 5R Tg lesion in the 5′-GTgC-3′ sequence was disordered.22 These NMR studies did not address the potential structural consequences of cis-trans epimerization of Tg in duplex DNA. More recently, a binary primer-template complex, containing a site-specifically 5R-Tg-modified template, was crystallized with the replicative RB69 DNA polymerase.23 The resulting structure, representing the situation immediately following incorporation of dATP opposite Tg, revealed the presence of the cis 5R,6S Tg epimer at the active site.23 The cis 5R,6S Tg epimer was intrahelical and formed a Watson−Crick base pair with the dA at the primer 3′-terminus.23 This confirmed modeling studies in which the cis 5R,6S Tg epimer was predicted to pair with dA.11 Moreover, in the crystal structure with the RB69 polymerase, the Tg methyl group was in the axial conformation, hindering stacking of the adjacent 5′-template guanine.23 These structural results provided a possible rationale for earlier observations that extension past the 5R Tg lesion by the Klenow fragment of Escherichia coli DNA polymerase I or T4 DNA polymerase was prohibited.24
Presently, the 5R-Tg adduct has been incorporated site-specifically into 5′-d(G1T2G3C4G5Tg6G7T8T9T10G11T12)-3′ and annealed with either 5′-d(A13C14A15A16A17C18A19C20G21C22A23C24)-3′, forming a duplex containing the Tg6•A19 base pair, corresponding to the oxidative damage of thymine in DNA, or 5′-d(A13C14A15A16A17C18G19C20G21C22A23C24)-3′, forming a duplex containing the mismatched Tg6:G19 base pair, corresponding to the formation of Tg following oxidative damage and deamination of 5-methylcytosine in DNA. For the duplex containing the Tg6•A19 pair, the cis-5R,6S and trans-5R,6R epimers exist in a cis:trans ratio of 7:3 at 30 °C. In contrast, for the duplex containing the Tg6:G19 pair, the cis:trans equilibrium strongly favors the cis-5R,6S epimer; the level of the trans-5R,6R epimer remains below the level of detection by NMR. The β anomer of the 5R Tg lesion remains the predominant deoxyribose C1′ epimer in these double stranded oligodeoxynucleotides. These data suggest that the potentially significant levels of the trans-5R,6R Tg epimer in duplex DNA should not be ignored with respect to the biological processing of the 5R Tg lesion, corroborating observations that the repair of Tg by DNA N-glycosylases/AP lyases is modulated by the cis-trans epimerization.20
Results
Analysis of the 5′-d(GTGCGTg GTTTGT)-3′ Oligodeoxynucleotide
The dodecamer 5′-d(GTGCGTgGTTTGT)-3′, Tg = 5R Tg, was synthesized as reported.25 Mass spectrometric analysis yielded the anticipated molecular ion peak with mass 3732 (m/z). Capillary gel electrophoretic analysis showed that the modified oligodeoxynucleotide eluted as a single peak. Enzymatic hydrolysis of the oligodeoxynucleotide to nucleosides, followed by C-18 HPLC chromatography, also yielded a single peak (Figure S1 in the Supporting Information). The UV trace of the Tg mononucleoside matched that of previous reports.8 Additional peaks corresponding to the dA, dC, dG, and dT mononucleosides were observed in the anticipated intensity ratios. Thus, the Tg-adducted oligodeoxynucleotide consisted of a single chromatographically separable species. NMR data for each of the duplexes containing the Tg6•G19 or Tg6•A19 base pairs was collected immediately upon sample preparation and subsequently repeated after 4 wks; no changes in the spectra were observed, suggesting that the samples had achieved equilibrium.
NMR Spectroscopy
(a) Nonexchangeable DNA Protons
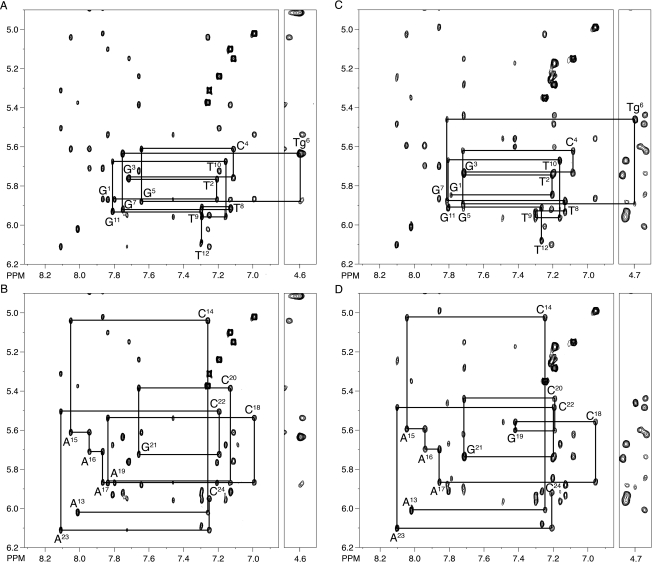
NMR resonances were assigned using standard strategies.26,27 Figure 1 shows an expansion of the NOESY spectrum including the NOEs between purine H8 and pyrimidine H6 protons and the corresponding deoxyribose H1′ protons for the 5′- d(G1T2G3C4G5Tg6G7T8T9T10G11T12)-3′•5′-d(A13C14A15A16A17C18A19C20G21C22A23C24)-3′ duplex, containing the Tg6•A19 base pair. There was no break in the sequential NOE connectivity for the modified strand (Figure 1A). The G5 H1′→Tg6 H6 NOE was observed, as was the Tg6 H6→Tg6 H1′ NOE. There was also no break in connectivity for the complementary strand (Figure 1, Panel B). The 5′- d(G1T2G3C4G5Tg6G7T8T9T10G11T12)-3′•5′-d(A13C14A15A16A17C18G19C20G21C22A23C24)-3′ duplex containing the Tg6•G19 pair also showed no break in connectivity (Figure 1, Panel C). Again, the G5 H1′→Tg6 H6 NOE was observed, as was the Tg6 H6→Tg6 H1′ NOE. There was also no break in connectivity for the complementary strand of the duplex containing the Tg6•G19 pair (Figure 1, Panel D).
Figure 1.
Sequential NOESY assignments of purine H8 and pyrimidine H6 protons to deoxyribose H1′ protons, for the duplexes containing either the Tg6•A19 or Tg6•G19 base pairs. (A) Modified strand of the duplex containing the Tg6•A19 base pair. (B) Complementary strand of the duplex containing the Tg6•A19 base pair. (C) Modified strand of the duplex containing the Tg6•G19 base pair. (D) Complementary strand of the duplex containing the Tg6•G19 base pair. The intranucleotide aromatic to H1′ cross peaks are labeled.
The deoxyribose protons for both duplexes were assigned from a combination of COSY and NOESY data. With the exception of several of the H4′ protons, and the stereotopic assignments of the H5′ and H5” sugar protons, assignments were made unequivocally. NOE intensities were used to assign the deoxyribose H2′ and H2′′ resonances based on the fact that H2′→H3′ cross peak was anticipated to have a greater intensity than the H2′′→H3′ cross peak.28,29 The assignments of the nonexchangeable protons for the two 5R Tg-modified duplexes, and the corresponding unmodified duplex, are provided in Tables S1, S2, and S3 in the Supporting Information.
(b) Exchangeable DNA Protons
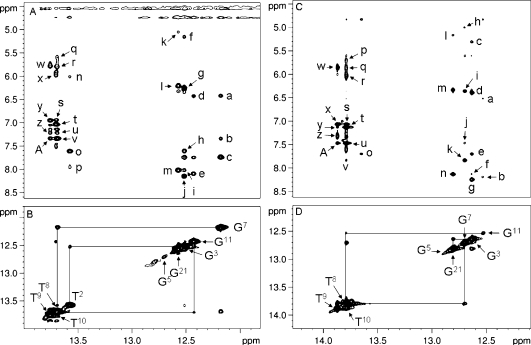
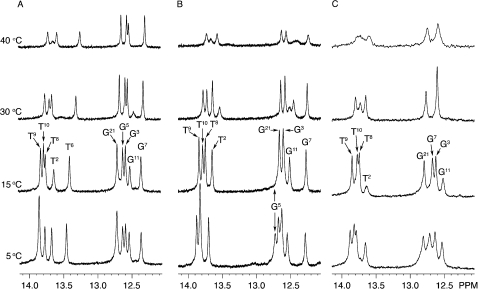
The Tg6 N3H imino resonance was not identified for either duplex. This was attributed to rapid exchange with solvent. The assignments of the remaining Watson−Crick hydrogen-bonded imino and amino protons of the two modified oligodeoxynucleotides were made using standard methods.30 The spectra were similar for both of the 5R-Tg-modified duplexes (Figure 2). In both instances, the G5 N1H imino resonance was broad at 5 °C and disappeared when the temperature was increased to 15 °C, indicating that the presence of Tg influenced Watson−Crick hydrogen bonding at the 5′ neighbor G5•C20 base pair (Figure 3). In contrast, for the unmodified sample, the G5 N1H imino resonance was sharp and was observed at temperatures as high as 40 °C. For both modified duplexes, there was no cross peak between the broad G5 N1H resonance and G21 N1H, located at base pair C4•G21 (Figure 2B and D). This was attributed to its exchange with solvent. The imino resonances for base pairs T2•A23, G3•C22, C4•G21, G7•C18, T8•A17, T9•A16, T10•A15, and G11•C14 were observed (Figure 2A and C). The imino resonances for the terminal base pairs G1•C24 and T12•A13 were not observed, attributed to exchange broadening with water.
Figure 2.
p>(A) Expanded plot showing NOEs from the imino protons to amino protons for the duplex containing the Tg6•A19 base pair. The cross peaks are assigned as a, G7N2H2→G7 N1H; b, A17 H2→G7 N1H; c, C18N4H2→G7 N1H1; d, G11N2H2→G11 N1H; e, C14N4H2→G11 N1H; f, C22 H5→G3 N1H; g, G3N2H2→G3 N1H; h, A23 H2→G3 N1H; i, C4N4H2→G3 N1H; j, C22N4H2→G3 N1H; k, C4 H5→G21 N1H; l, G21N2H2→G21 N1H; m, C4N4H2→G21 N1H; n, A19N6H2→T2 N3H; o, A23 H2→T2 N3H; p, A23N6H1→T2 N3H; q, A17N6H2→T8 N3H; r, A16N6H2→T8 N3H; s, A16 H2→T10 N3H; t, A15 H2→T10 N3H; u, A16N6H1→T8 N3H; v, A17 H2→T8 N3H; w, A16N6H2→T9 N3H; ×, A15N6H2→T10 N3H; y, A16 H2→T9 N3H; z. A16N6H1→T9 N3H; A, A17 H2→T9 N3H. (B) Expanded plot showing the sequential NOE connectivity for the imino protons. (C) Expanded plot showing NOEs from the imino protons to amino protons for the duplex containing the Tg6•G19 base pair. The cross peaks are assigned as a, G11N2H2→G11 N1H; b, C14N4H2→G11 N1H; c, C22 H5→G3 N1H; d, G3N2H2→G3 N1H; e, A23 H2→G3 N1H; f, C4N4H2→G3 N1H; g, C22N4H2→G3 N1H; h, C18 H5→G7 N1H; i, G7N2H2→G7 N1H; j, A17 H2→G7 N1H; k, C18N4H2→G7 N1H; l, C4 H5→G21 N1H; m, G21N2H2→G21 N1H; n, C4N4H2→G21 N1H; o, A23 H2→T2 N3H; p, A17N6H2→T8 N3H; q, A16N6H2→T8 N3H; r, A15N6H2→T10 N3H; s, A16 H2→T10 N3H; t, A15 H2→T10 N3H; u, A17 H2→T8 N3H; v, C18N4H2→T8 N3H; w, A16N6H2→T9 N3H; ×, A16 H2→T9 N3H; y, A15 H2→T9 N3H; z, A16N6H1→T9 N3H; A, A17 H2→T9 N3H. (D) Expanded plot showing the sequential NOE connectivity for the imino protons of the duplex containing the Tg6•G19 base pair. The data was collected at 800 MHz at 250 ms mixing time and a temperature of 7 °C.
Figure 3.
Temperature-dependent analysis of imino protons of the duplexes containing (A) the T6•A19 base pair, (B) the Tg6•A19 base pair, and (C) the Tg6•G19 base pairs, as monitored by 1H NMR.
(c) Tg Protons
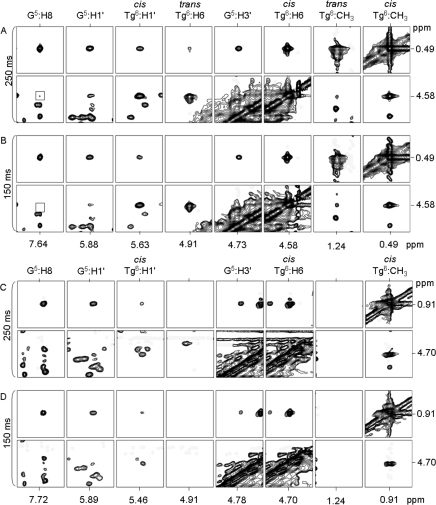
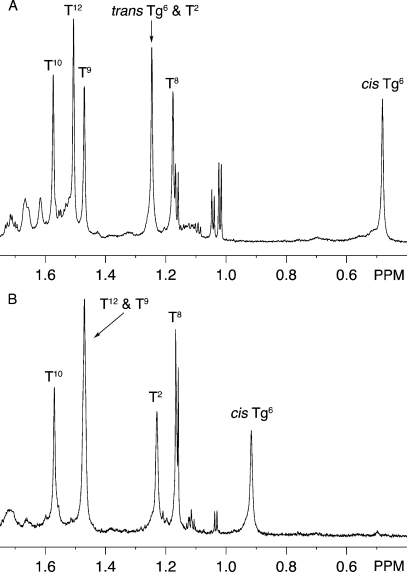
For the duplex containing the Tg6•A19 pair analysis of NOESY data showed the presence of two cross-peaks arising from dipolar couplings between Tg6 CH3 and Tg6 H6 (Figure 4). These were attributed to exchange between two chemical species, involving both the Tg6 CH3 and Tg6 H6 protons (Figure 4, Panels A and B). The integrated volumes of the two exchange cross peaks were consistent at multiple NOE mixing times. For the Tg6•A19 duplex integration of the two Tg6 CH3 resonances indicated that the two species were present at an equilibrium ratio of 7:3 (Figure 5). For the major species, the Tg6 CH3 protons exhibited a chemical shift of 0.49 ppm, while the Tg6 H6 proton resonated at 4.58 ppm. These chemical shifts were consistent with values reported for the Tg CH3 and H6 protons in earlier NMR studies in DNA.21 A total of 23 NOE cross peaks were assigned between Tg6 CH3 and H6 in the major species and DNA (7 for Tg6 H6 and 16 for Tg6 CH3) in the Tg6•A19 duplex. The resonances for the Tg6 CH3 and H6 protons of the minor species were significantly downfield relative to those from the major species, located at 1.24 ppm and 4.91 ppm, respectively. The Tg6 CH3 resonance for the minor species was overlapped with the T2 CH3 resonance (Figure 5). For the minor species, there was only one NOE cross peak observed to a DNA proton, observed between Tg6 H6 and Tg6 H2′. A single set of resonances was observed for the G5 and G7 DNA protons, indicating that the two species observed for Tg6 did not extend to the neighboring nucleotides.
Figure 4.
(A) NOESY data collected for the duplex containing the Tg6•A19 base pair at a NOE mixing time of 250 ms. (B) NOESY data collected for the duplex containing the Tg6•A19 base pair at a NOE mixing time of 150 ms. (C) NOESY data collected for the duplex containing the Tg6•G19 base pair at a NOE mixing time of 250 ms. (D) NOESY data collected for the duplex containing the Tg6•G19 base pair at a NOE mixing time of 150 ms. The spectra were collected at 800 MHz at a temperature of 30 °C.
Figure 5.
1H NMR of thymine and Tg methyl groups. (A) For the duplex containing theTg6•A19 base pair the resonances arising from the trans-5R,6R configuration of Tg6 CH3 and T2 CH3 overlapped. (B) Single resonance assigned to the cis-5R,6S configuration of Tg6 CH3 was observed for the duplex containing the Tg6•G19 base pair (20 mM sodium phosphate, pH 7.0, 100 mM NaCl, 30 °C).
For the duplex containing the Tg6•G19 pair analysis of NOESY data obtained at multiple mixing times did not exhibit chemical exchange cross peaks for either the Tg6 CH3 and Tg6 H6 protons (Figure 4C and D). This indicated that only one chemical species was significantly populated in the mismatch sample. The Tg6 CH3 protons exhibited a chemical shift of 0.91 ppm, while the Tg6 H6 proton resonated at 4.70 ppm (Figure 5). A total of 20 NOE cross peaks were assigned between Tg6 CH3 and H6 in major species and DNA (nine for Tg6 H6 and eleven for Tg6 CH3).
Assignment of Tg6 Isomers
The two Tg species observed for the duplex containing the Tg6•A19 base pair were assigned as arising from slow exchange (NMR time scale) between the cis-5R,6S and trans-5R,6R epimers. Seven NOESY cross peaks were observed between the Tg6 H6 resonance of the major species and surrounding protons (Table 1). Their intensities at mixing times of 80 and 250 ms were compared with the corresponding distances predicted for each epimer on the basis of molecular modeling. The spectral overlap of Tg6 H3′ and Tg6 H6 resonances in the major species hindered the assessment of the Tg6 H3′→Tg6 H1′ and Tg6 H6→Tg6 H1′ cross peaks. For the cis-5R,6S configuration, Tg6 H6 and Tg6 CH3 are spatially proximate, yielding a strong Tg6 H6→Tg6 CH3 NOE even at the short mixing time of 150 ms (Figure 4A and B). Likewise, the G5 H1′→Tg6 H6 and G5 H8→Tg6 H6 NOEs were diagnostic of the cis-5R,6S configuration. On this basis, the major species, present at ∼70% population, was assigned as the cis epimer. The configuration of the single species present in the duplex containing the Tg6•G19 base pair was determined to be cis by the same approach (Figure 4, Panel C and D). For the duplex containing the Tg6•G19 base pair the Tg6 H3′ and Tg6 H6 resonances were separated (4.53 and 4.70 ppm, respectively).
Table 1. NOESY Cross Peaks From the Major Tg H6 Species to Neighboring Protons.
| major Tg6H6 cross peak | trans-5R,6R model distance (Å) | cis-5R,6S model distance (Å) | NOESY intensity (80 ms) | NOESY intensity (250 ms) |
|---|---|---|---|---|
| G5 H2′′ | 5.7 | 2.2 | w | m |
| Tg6 H5′ | 4.5 | 3.3 | s | s |
| G5 H1′ | 3.9 | 2.3 | nd | m |
| G5 H8 | 7.1 | 6.1 | nd | w |
| G5 H4′ | 6.8 | 5.4 | nd | w |
Configuration of the Deoxyribose Sugar
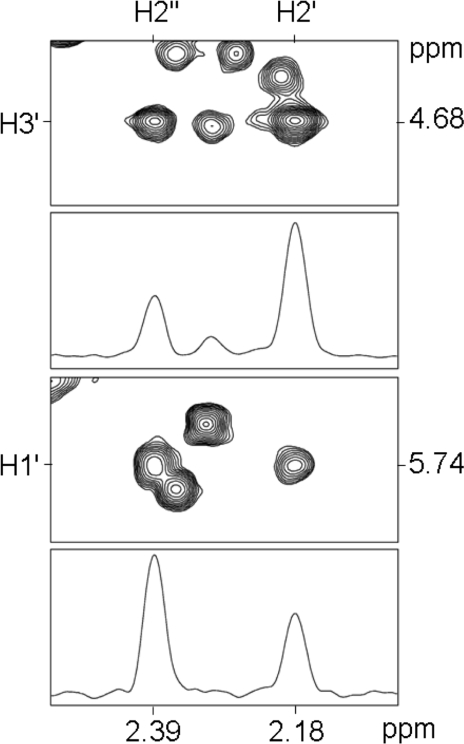
NOESY data were collected for the duplex containing for the Tg6•A19 base pair, at mixing times of 80, 150, 200, and 250 ms. For the major species present, the cis-5R,6S lesion, the relative intensities of the NOE cross-peaks corresponding to the deoxyribose H1′, H2′, H2”, and H3′ protons were evaluated. These data revealed that the intensity of the Tg6 H1′→Tg6 H2′′ NOE was greater than the Tg6 H1′→Tg6 H2′ NOE, which placed H1′ in the β configuration (Figure 6).
Figure 6.
Deoxyribose H1′, H2′, H2′, and H3′ NOE intensities assigned to the cis-5R,6S configuration, at a mixing time of 150 ms, for the duplex containing the Tg6•A19 base pair. Data were collected at 800 MHz at 30 °C.
Potential Energy Minimization
For either the cis-5R,6S or trans-5R,6R configurations, the Tg CH3 may be in either axial or equatorial conformations. Calculations using GAUSSIAN 0331 (Table 2) predicted that the cis-5R,6S configuration was at lower energy than the trans-5R,6R configuration, which was consistent with the present experimental observations, as well as previous experimental observations.5–7 The calculations also predicted that for the cis-5R,6S configuration, the Tg CH3 group favored the axial conformation, whereas for the trans-5R,6R configuration, the Tg CH3 group favored the equatorial conformation. Of note was the observation that the calculations predicted that the trans-5R,6R configuration with the methyl group in the equatorial conformation was the next most energetically favorable configuration.
Table 2. DFT Energies (kcal/mol) of Thymine Glycol Bases.
| 6−31G* | 6−31+G* | 6−31G** | 6−311++G** | |
|---|---|---|---|---|
| cis-5R,6S-Tg | ||||
| CH3 Axial | −404,706.93 | −404,813.62 | −404,808.12 | −404,926.28 |
| CH3 Equatorial | −404,702.80 | −404,809.22 | −404,804.34 | −404,921.86 |
| trans-5R,6R-Tg | ||||
| CH3 Axial | −404,701.82 | −404,808.58 | −404,803.59 | −404,921.29 |
| CH3 Equatorial | −404,705.98 | −404,812.83 | −404,806.91 | −404,925.39 |
Thermodynamics
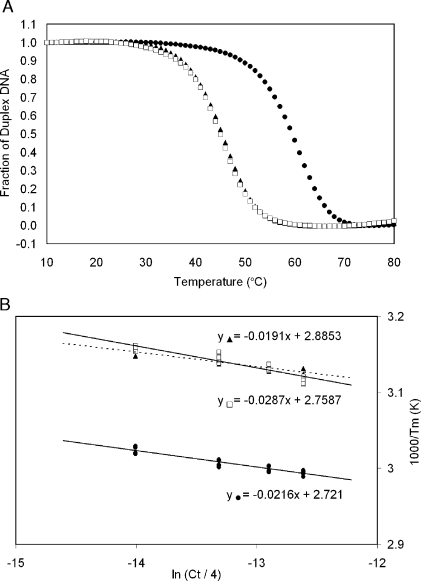
The 5′-d(GTGCGTgGTTTGT)-3′•5′-d(ACAAACACGCAC)-3′ and 5′-d(GTGCGTgGTTTGT)-3′•5′-d(ACAAACGCGCAC)-3′ duplexes were analyzed by UV melting and compared to the unmodified 5′-d(GTGCGTGTTTGT)-3′•5′-d(ACAAACACGCAC)-3′ duplex. All of the duplexes displayed hyperchromic shifts in UV absorption as temperature was increased from 5 to 80 °C. Average α curves are shown in Figure 7. The Tm values calculated for the concentration of 1.0 × 10⁻⁴ M are reported in Table 3. Both the duplexes containing either the Tg6•A19 or the Tg6•G19 base pairs exhibited a 13 °C reduction in Tm relative to the unmodified duplex, T6•A19. The thermodynamic parameters were extracted from individual melting curves and van’t Hoff plots (Figure 7). These were comparable, indicating that both Tg-modified duplexes melted via one step transitions.32 In addition, there were no concentration-dependent melting effects observed within this concentration range (Table 3). The free energy values (with respect to duplex formation) were calculated at 25 and 37 °C. The values at both temperatures were negative, consistent with spontaneous formation of the duplexes at temperatures below the Tm of the samples. Both 5R Tg-modified samples showed increased (less negative) free energies of approximately 3 kcal/mol when compared to the unmodified sample at both 25 and 37 °C. Each of the duplexes exhibited negative values for enthalpy and entropy (with respect to duplex formation). This indicated that in all cases, duplex formation was enthalpically favored and entropically disfavored. However, the melting of the duplex containing the Tg6•G19 pair was enthalpically favored as compared to the duplex containing the Tg6•A19 base pair.
Figure 7.
(A) Hybridization plots (alpha curves) for the duplexes containing the unmodified T6•A19 base pair (•), the Tg6•A19 base pair (▲), and the Tg6•G19 base pair (◻). (B) van’t Hoff plots of Tm−1 vs ln(Ct/4) for the duplex containing the unmodified T6•A19 base pair (•), the Tg6•A19 base pair (▲), and the Tg6•G19 base pair (◻).
Table 3. Thermodynamic Parameters of DNA Duplexes.
| duplex | Tma (°C) | ΔH° (kcal/mol) | ΔS° (kcal/mol °K)d | ΔG°25 °C (kcal/mol)d | ΔG°37 °C (kcal/mol)d | ΔΔG37 °C (kcal/mol)d |
|---|---|---|---|---|---|---|
| T6•A19b | 71.6 | −87.3 ± 2 | −0.23 ± 0.01 | −18.1 ± 0.2 | −15.2 ± 0.2 | |
| Tg6•A19b | 58.3 | −83.8 ± 1 | −0.23 ± 0.01 | −14.7 ± 0.1 | −11.9 ± 0.1 | 3.3 ± 0.1 |
| Tg6•G19 b | 58.3 | −87.5 ± 5 | −0.24 ± 0.02 | −15.0 ± 0.3 | −12.1 ± 0.2 | 3.1 ± 0.2 |
| T6•A19 c | 73.4 | −90.7 ± 2 | −0.24 ± 0.02 | −18.8 ± 0.2 | −15.9 ± 0.2 | |
| Tg6•A19 c | 60.5 | −81.1 ± 2 | −0.22 ± 0.04 | −14.9 ± 0.4 | −12.2 ± 0.4 | 3.0 ± 0.4 |
| Tg6•G19 c | 60.0 | −86.4 ± 1 | −0.24 ± 0.02 | −15.3 ± 0.2 | −12.5 ± 0.2 | 2.7 ± 0.2 |
Calculated for 1.0 × 10⁻⁴ M oligodeoxynucleotide duplex concentration.
Reported errors are standard deviations.
Determined from individual melting curves.
Determined from (Tm−1) vs ln(Ct/4) plots.
Discussion
Tg is a substrate for base excision repair, both in Escherichia coli and in mammalian cells.33 In E. coli, repair of Tg is initiated by endonuclease III (Nth)34 and endonuclease VIII (Nei).35 Yeast,36 mammalian,37,38 and human orthologs15,39,40 of Nth have been characterized. Likewise, human orthologs of Nei have been characterized.17,41 Tg is also a substrate for nucleotide excision repair (NER). Both randomly introduced Tg lesions and abasic sites were substrates for the UvrABC repair enzymes of E. coli.42 Subsequently it was determined that Tg was excised from DNA in vitro by human NER enzymes.43 However, DNA containing dihydrothymine, a lesion with a similar structure to thymine glycol, but which cannot undergo epimerization between cis and trans epimers, was not incised.44
Equilibrium Between the cis-5R,6S and trans-5R,6R Epimers in Duplex Oligodeoxynucleotides Depends Upon the Purine Opposite Tg
The present data reveal that in the duplex oligodeoxynucleotide containing the Tg6•A19 base pair, the 5R Tg adduct exists as an 7:3 equilibrium mixture of cis 5R,6S and trans 5R,6R epimers, which equilibrate in slow exchange on the NMR time scale. This ratio is comparable to the 87% cis to 13% trans ratio of epimers reported at the nucleoside level.6 On the other hand, the duplex containing the mismatched Tg6•G19 base pair exists in solution predominantly as the cis 5R,6S epimer. Overall, we conclude that depending upon the identity of the complementary nucleotide, significant levels of the trans 5R,6R epimer may be present in duplex DNA, and that the 5R Tg lesion should be considered to exist in duplex DNA as an equilibrium mixture of the two epimers.
Structural Implications
The NMR data argue that for both duplexes, the purine placed opposite the 5R Tg lesion stacks into the duplexes. There is no disruption of sequential NOE connectivity for the complementary strand either with the duplex containing the Tg6•A19 pair or the duplex containing the Tg6•G19 pair (Figure 1). This suggests that for both duplexes, there is minimal structural perturbation to the complementary strand. Also, for both duplexes, Tg does not interrupt the sequential NOE connectivity in the modified strand (Figure 1). Thus, it seems possible that irrespective of its placement opposite either A19 or G19, Tg remains either stacked or partially stacked within the duplex. The present data also corroborate the conclusion that Tg disrupts hydrogen bonding interactions,45 either when placed opposite to A19 or G19. The Tg6 N3 imino proton is not observed in the 1H NMR spectrum, which is attributed to its rapid exchange with solvent. Significantly, for the duplexes containing the Tg6•G19 or Tg6•A19 base pairs, the G19 N3H imino or A19N6H proton resonances, respectively, were not observed, suggesting that they also undergo rapid exchange with solvent. The thermodynamic measurements indicate that both the duplexes containing the Tg6•A19 or Tg6•G19 base pairs have similar 13 °C decreases in thermal melting temperatures, and both exhibit similar 3 kcal/mol ΔΔG values, which result from enthalpy-driven reductions in duplex stabilities (Table 3).
Notably, when the 5R Tg lesion6 was examined in the 5′-ATgA-3′ sequence, paired opposite dA, it was concluded that it induced a significant, localized structural change with the Tg being largely extrahelical. In that instance, an extrahelical orientation of Tg was concluded from the observation that it exhibited an increased solvent accessible surface area relative to thymidine.21 It had also been reported that the structure of the 5R Tg lesion in the 5′-GTgC-3′ sequence was disordered.22 It seems plausible that the orientation of Tg may be dependent upon DNA sequence, as well as the identity of the complementary nucleotide. The structural refinement of Tg in the present sequence contexts, when placed opposite either dA or dG, will now be of considerable interest.
The evidently weak hydrogen bonding interactions between the Tg6•A19 or Tg6•G19 base pairs in these oligodeoxynucleotide duplexes suggests that differences in stacking interactions and/or steric interactions involving the opposing purine and the flanking base pairs play an important role in mediating the position of the equilibrium between the cis 5R,6S and trans 5R,6R epimers. Clark et al.11 concluded that the cis 5R,6S epimer favors the axial conformation of the Tg CH3 group. In addition, the present DFT calculations predict that the trans 5R,6R epimer with the Tg CH3 group in the equatorial conformation is the second most energetically favorable configuration (Table 2). This may be important in determining the equilibrium between the cis 5R,6S and trans 5R,6R epimers in duplex DNA. For the duplex containing the Tg6•A19 base pair, Tg6 provides a reasonable steric match for the normal T6•A19 pair with A19. Epimerization to the trans 5R,6R epimer might allow the Tg6 CH3 group to shift to the equatorial conformation, which might reduce its steric clash with the 5′-neighbor nucleotide G5 (Figure 8). In contrast, when placed opposite dG in the Tg6•G19 pair, it seems possible that Tg6 is oriented similarly to a wobble G•T pair; detailed NMR studies to examine this hypothesis are in progress. This would shift Tg6 toward the major groove, as compared to its orientation when placed opposite A19, and would enable the Tg6 CH3 group to be maintained in the energetically more favorable axial conformation, consistent with the observation that in the Tg6•G19 pair the cis 5R,6S epimer is favored (Figure 8). This hypothesis also draws support from the observation that Tg is weakly mutagenic, causing <0.5% T→C transitions, which also could be explained by the formation of G•Tg wobble pairs during error-prone translesion DNA replication.46
Figure 8.
Cartoon of hypothesized Tg-induced structural alterations. (A) Insertion of the cis-5R,6S Tg lesion into the duplex opposite dA, in a Watson−Crick orientation, with the axial conformation of Tg6 CH3, induces steric clash with the 5′ neighbor, G5. (B) Epimerization of the cis-5R,6S Tg lesion to the trans-5R,6R lesion allows the Tg6 CH3 to assume an equatorial conformation that causes less steric interaction with Tg6 CH3 and the G5 nucleotide. (C) Formation of a wobble Tg6•G19 base pair allows Tg6 to be displaced toward the major groove, resulting in less steric clash between the axial conformation of Tg6 CH3 in the cis-5R,6S Tg configuration and the 5′-neighbor, G5.
The presence of the 5R Tg lesion in the duplexes containing the Tg6•A19 or Tg6•G19 base pairs perturbs the 5′-neighbor base pair G5•C20. This observation is consistent with the predominance of the cis-5R,6S epimer in both instances, and the conclusion that the cis-5R,6S epimer favors the axial conformation of the Tg CH3 group.11 This is corroborated by the observation that the imino resonance attributed to base pair G5•C20 broadens due to solvent exchange and disappears from the 1H NMR spectrum ∼ 35 °C lower in the 5R-Tg modified DNA as compared to the corresponding unmodified oligodeoxynucleotide duplex (Figure 3). For the duplex containing the Tg6•A19 pair, NMR analysis of both the exchangeable Tg6 amine and A19N6 amine resonances suggest that these protons undergo increased exchange with solvent. Taken together, this is expected to contribute to the observed 13 °C reduction in duplex Tm. Similarly, for the oligodeoxynucleotide containing the Tg6•G19 mismatch, the Tm was reduced by 13 °C.
Although it has been recognized that Tg exists in DNA as two diastereomeric pairs of epimers,5–7 solution structural studies of the 5R Tg lesion21,22 (no structural studies of the 5S Tg lesion have been conducted) have not commented upon this equilibrium. Consequently, it will be of interest to re-evaluate the solution structures of these lesions, and the structural refinement of the two duplexes discussed herein, is in progress. The structure of a binary primer-template complex with the replicative RB69 DNA polymerase, representing the situation immediately following incorporation of dATP opposite Tg, revealed the presence of the cis-5R,6S Tg epimer at the active site.23 The cis-5R,6S Tg epimer was intrahelical and was positioned to form a Watson−Crick base pair with the dA at the primer 3′-terminus.23 This confirmed modeling studies in which the cis-5R,6S Tg epimer was predicted to pair with dA.11 The Tg methyl group was in the axial conformation, hindering stacking of the adjacent 5′-template guanine.23 Tg blocks DNA replication by both replicative and repair polymerases.10,12,24,47–50 With either the Klenow fragment of E. coli DNA polymerase I or T4 DNA polymerase, extension past the 5R Tg lesion is prohibited, as opposed to dNTP insertion.24 However, pyrimidines 5′ to template Tg allow residual polymerase read-through more often than do purines.51
Biological Significance
If not repaired, the 5R Tg lesion is lethal to cells.51–55 The interconversion of the 5R Tg lesion between the cis-5R,6S and trans-5R,6R epimers, and the observation that the position of this equilibrium depends upon the identity of the nucleotide placed opposite to the 5R Tg lesion is likely to influence the recognition and repair of these lesions in duplex DNA. It is tempting to speculate that hNeil1ʼs ability to release Tg much more efficiently in a Tg•G pair compared to a Tg•A pair20 may be related to its exclusive cis stereochemistry in the former pair. By contrast, the rate of release of Tg from Tg•A is greater by hNth1 compared to Tg•G, when [S] ≫ [E] but not when [E] ≫ [S], which could be due to product inhibition.20 It has been proposed that hNth1 and hNeil1 only release the 5R (or 5S) Tg lesions as either the cis or trans epimers, and that under single turnover conditions, the interconversion of the two epimers represents the rate-limiting step for complete excision of Tg.20 This notion would imply that under single turnover conditions, the efficiency of excision of Tg should depend upon the position of the equilibrium between Tg epimers at specific sites in DNA, and that the conditions that modulate this equilibrium in duplex DNA should be further characterized.
Summary
For the 5R Tg lesion, the equilibrium between the cis-5R,6S-and trans-5R,6R- epimers depends upon the identity of the purine in the complementary strand. For the duplex containing the Tg•A pair, the equilibrium ratio of cis-5R,6S:trans-5R,6R epimers was 7:3 at 30 °C. In contrast, for a duplex containing the Tg•G pair, the cis-5R,6S:trans-5R,6R equilibrium strongly favored the cis-5R,6S epimer; the level of the trans-5R,6R epimer remained below the level of detection by NMR. The observations that the cis-5R,6S-thymine glycol lesion exists in equilibrium with its trans-5R,6R epimer in duplex DNA and that the position of this equilibrium is affected by the complementary base extends upon observations that this equilibrium modulates the biological processing of Tg.20
Experimental Section
Oligodeoxynucleotides
The oligodeoxynucleotides 5′-d(GTGCGTGTTTGT)-3′, 5′-d(ACAAACGCGCAC)-3′ and 5′-d(ACAAACACGCAC)-3′, purified by anion exchange chromatography, were purchased from the Midland Certified Reagent Co. (Midland, TX). The Tg-dodecamer 5′-d(GTGCGTgGTTTGT)-3′, Tg = 5R Tg, was synthesized and purified as reported.25 Oligodeoxynucleotide concentrations were determined from UV absorbance at 260 nm using calculated extinction coefficients.56 Complementary oligodeoxynucleotides were annealed in 20 mM sodium phosphate buffer, containing 100 mM NaCl, 10 mM NaN3, and 50 μM Na2EDTA (pH 7.0), heated to 70 °C for 10 min and subsequently cooled to ambient temperature.
Mass Spectrometry
Oligodeoxynucleotides were analyzed using MALDI-TOF mass spectrometry. Samples were suspended in a matrix consisting of 0.5 M 3-hydroxypicolinic acid in 1:1 CH3CN:H2O and spotted onto sample plates. Mass spectra were recorded in the reflector mode using laser energy of 3030. The accelerating voltage was 20 kV, with a grid voltage of 85.00%, guide wire voltage of 0.050%, and a delay of 100 ns. The spectra were an averaged from 256 scans.
HPLC
DNA purification by HPLC was conducted using a Phenomenex Gemini C-18 column (250 mm × 10 mm). Elution was performed using a linear gradient from 6 to 30% CH3CN over 25 min. The buffer was 0.1 M ammonium formate (pH 6.5). The flow rate was 2 mL/min.
Capillary Gel Electrophoresis
CGE was performed using approximately 1 nmol desalted sample. The gels and buffers were prepared using Beckman Coulter ssDNA 100-R kits (Beckman-Coulter, Inc., Fullerton, CA). An injection voltage of 10.0 kV was used for 8 s, followed by a separation voltage of 14.1 kV for 35 min, using a 33 cm capillary. The electropherogram was recorded at a wavelength of 254 nm. Elution times were referenced to an internal standard (Beckman ′′Orange G′′ product number 241524).
Thermodynamic Measurements
UV-absorption thermal denaturation experiments were conducted on a CARY 4E UV−vis spectrophotometer (Varian, Inc.). Data was collected using the Cary WinUV Thermal application (v. 2.0). Samples were suspended in 10 mM phosphate buffer, containing 500 mM NaCl, and 10 mM Na2EDTA (pH 7.0). Four concentrations of approximately 0.1, 0.5, 0.8, and 1.0 μM in 1 cm capped cuvettes were placed in the spectrometer’s multicell temperature regulation block along with a blank. During the serial analysis of the samples, temperature was increased or decreased, depending on experiment, at a rate of 0.3 °C /min and absorbance was measured at 260 nm. Temperature was allowed to equilibrate for 5 min at 5 and 80 °C prior to each sweep. Six experiments were performed for each duplex with varying concentrations.
Thermodynamic Data Analysis
Thermodynamic parameters57,58 were generated by analysis of absorbance vs temperature profiles within in the Meltwin (v3.5 McDowell) and Thermal (v 2.0 Cary) applications (Varian Instruments, Palo Alto, CA). The Marquardt-Levenburg algorithm was used for individual curve fitting. The thermodynamic values (ΔH° and ΔS°) were obtained either from individual melting curves, or from van’t Hoff analysis (SigmaPlot v9.0) Gibbs free energies (ΔG°) were determined at 25 and 37 °C.59–61 Error values were determined as standard deviations.
Enzymatic Hydrolysis
Oligodeoxynucleotide (0.2−0.5 A260 unit) was dissolved in 30 μL 100 mM Tris-HCl buffer containing 10 mM MgCl2 (pH 7.0) and incubated with DNase I (8 u, Promega), snake venom phosphodiesterase I (0.02 u, Sigma Aldrich), and E. coli alkaline phosphatase (1.7 u; Sigma Aldrich) at 37 °C for 90 min. The product mixture was analyzed by HPLC using a Waters YMC ODS-AQ column (250 mm × 4.6 mm i.d.). Elution was performed using a 15 min linear gradient from 1% to 10% CH3CN, followed by a 5 min linear gradient from 10 to 20% CH3CN. The buffer was 0.1 M ammonium formate (pH 6.5). Adducted nucleosides were identified by comparison with authentic samples based on retention times and UV spectra.
NMR Spectroscopy
Sample concentrations were 1.5 mM, in 20 mM sodium phosphate, 100 mM NaCl (pH 7.0). To examine nonexchangeable protons, samples were suspended in 99.996% D2O. For observation of exchangeable protons, samples were suspended in 9:1 H2O:D2O. NMR experiments were performed at a 1H frequency of 800 MHz. The nonexchangeable proton experiments were performed at 30 ± 0.5 °C, exchangeable proton experiments were performed at 5 ± 0.5 °C. NOESY spectra for the nonexchangeable protons were recorded at mixing times of 80, 150, 200, and 250 ms. The States-TPPI phase cycling method was used. Typical acquisition parameters for NMR experiments were as follows: 512 real data points in the d1 dimension with 32 scans per FID, 2K real data points in the d2 dimension, sweep width of 10 ppm, and a relaxation delay of 2.0 s. The residual water resonance was suppressed using presaturation. NOESY spectra of exchangeable protons were obtained using watergate H2O suppression62 and a sweep width of 20 ppm. The binomial water suppression delay of 188 μs at 800 MHz (158 μs at 500 MHz) was selected to avoid suppression of amino resonances. 1H spectra were referenced to internal 3-(trimethylsilyl)propionic-2,2,3,3-d4 acid, sodium salt (3-TMSP). The programs XWINNMR (v 3.5 patch level 6, Bruker Inc., Billerica, MA) and NMRPipe63 were used for data processing. Skewed sinebell-squared apodization functions were used. Assignment and peak integration were performed using the program SPARKY v3.11.64
DFT Calculations
Calculations were performed with the program GAUSSIAN 03.31 Geometry optimization and frequency calculations were performed using the B3LYP density functional method with the 6−31G*, 6−31G**, 6−31+G*, and 6−311++G** basis sets. Potential points were written out with a density of 6 points per unit area for an electrostatic potential (ESP) fit. Five sets of calculations were performed. Coordinates were chosen for cis Tg (CH3 axial), cis Tg (CH3 equatorial), trans Tg (CH3 axial), trans Tg (CH3 equatorial), and the aldehyde intermediate. In all cases, the N1 nitrogen was modified with a CH3 in place of the deoxyribose. Frequency analysis was used to test for convergence.
Acknowledgments
Dr. Markus Voehler assisted with NMR spectroscopy and Professor B. Andes Hess assisted with quantum mechanical calculations. Drs. Thomas and Constance Harris provided constructive communications. Dr. Ivan Kozekov assisted with enzymatic digestion and analysis. This work was funded by NIH grants CA-55678 (M.P.S.) and ES-013324 (A.B).
Supporting Information Available
Table S1, chemical shifts of nonexchangeable protons for the unmodified duplex; Table S2, chemical shifts of nonexchangeable protons for the 5R-Tg-modified duplex paired with adenosine; and Table S3, chemical shifts of nonexchangeable protons for the 5R-Tg-modified duplex paired with guanosine. Figure S1, HPLC analysis of enzyme digest products of the unmodified and Tg-modified oligodeoxynucleotide duplexes. Complete ref (31). This material is available free charge via the Internet at http://pubs.acs.org.
Funding Statement
National Institutes of Health, United States
Supplementary Material
References
- Teoule R.; Bonicel A.; Bert C.; Cadet J.; Polverelli M. Radiat. Res. 1974, 57, 46–58. [PubMed] [Google Scholar]
- Frenkel K.; Goldstein M. S.; Teebor G. W. Biochemistry 1981, 20, 7566–7571. [DOI] [PubMed] [Google Scholar]
- Zuo S.; Boorstein R. J.; Teebor G. W. Nucleic Acids Res. 1995, 23, 3239–3243. [DOI] [PMC free article] [PubMed] [Google Scholar]
- Pfeifer G. P. Mutat. Res. 2000, 450, 155–166. [DOI] [PubMed] [Google Scholar]
- Vaishnav Y.; Holwitt E.; Swenberg C.; Lee H. C.; Kan L. S. J. Biomol. Struct. Dyn. 1991, 8, 935–951. [DOI] [PubMed] [Google Scholar]
- Lustig M. J.; Cadet J.; Boorstein R. J.; Teebor G. W. Nucleic Acids Res. 1992, 20, 4839–4845. [DOI] [PMC free article] [PubMed] [Google Scholar]
- Wang Y. Chem. Res. Toxicol. 2002, 15, 671–676. [DOI] [PubMed] [Google Scholar]
- Cathcart R.; Schwiers E.; Saul R. L.; Ames B. N. Proc. Natl. Acad. Sci. U.S.A. 1984, 81, 5633–5637. [DOI] [PMC free article] [PubMed] [Google Scholar]
- Adelman R.; Saul R. L.; Ames B. N. Proc. Natl. Acad. Sci. U.S.A. 1988, 85, 2706–2708. [DOI] [PMC free article] [PubMed] [Google Scholar]
- Hayes R. C.; LeClerc J. E. Nucleic Acids Res. 1986, 14, 1045–1061. [DOI] [PMC free article] [PubMed] [Google Scholar]
- Clark J. M.; Pattabiraman N.; Jarvis W.; Beardsley G. P. Biochemistry 1987, 26, 5404–5409. [DOI] [PubMed] [Google Scholar]
- McNulty J. M.; Jerkovic B.; Bolton P. H.; Basu A. K. Chem. Res. Toxicol. 1998, 11, 666–673. [DOI] [PubMed] [Google Scholar]
- Kusumoto R.; Masutani C.; Iwai S.; Hanaoka F. Biochemistry 2002, 41, 6090–6099. [DOI] [PubMed] [Google Scholar]
- Fischhaber P. L.; Gerlach V. L.; Feaver W. J.; Hatahet Z.; Wallace S. S.; Friedberg E. C. J. Biol. Chem. 2002, 277, 37604–37611. [DOI] [PubMed] [Google Scholar]
- Ikeda S.; Biswas T.; Roy R.; Izumi T.; Boldogh I.; Kurosky A.; Sarker A. H.; Seki S.; Mitra S. J. Biol. Chem. 1998, 273, 21585–21593. [DOI] [PubMed] [Google Scholar]
- Bandaru V.; Sunkara S.; Wallace S. S.; Bond J. P. DNA Repair (Amst.) 2002, 1, 517–529. [DOI] [PubMed] [Google Scholar]
- Hazra T. K.; Izumi T.; Boldogh I.; Imhoff B.; Kow Y. W.; Jaruga P.; Dizdaroglu M.; Mitra S. Proc. Natl. Acad. Sci. U.S.A. 2002, 99, 3523–3528. [DOI] [PMC free article] [PubMed] [Google Scholar]
- Katafuchi A.; Nakano T.; Masaoka A.; Terato H.; Iwai S.; Hanaoka F.; Ide H. J. Biol. Chem. 2004, 279, 14464–14471. [DOI] [PubMed] [Google Scholar]
- Miller H.; Fernandes A. S.; Zaika E.; McTigue M. M.; Torres M. C.; Wente M.; Iden C. R.; Grollman A. P. Nucleic Acids Res. 2004, 32, 338–345. [DOI] [PMC free article] [PubMed] [Google Scholar]
- Ocampo-Hafalla M. T.; Altamirano A.; Basu A. K.; Chan M. K.; Ocampo J. E.; Cummings A. Jr.; Boorstein R. J.; Cunningham R. P.; Teebor G. W. DNA Repair (Amst.) 2006, 5, 444–454. [DOI] [PubMed] [Google Scholar]
- Kung H. C.; Bolton P. H. J. Biol. Chem. 1997, 272, 9227–9236. [DOI] [PubMed] [Google Scholar]
- Kao J. Y.; Goljer I.; Phan T. A.; Bolton P. H. J. Biol. Chem. 1993, 268, 17787–17793. [PubMed] [Google Scholar]
- Aller P.; Rould M. A.; Hogg M.; Wallace S. S.; Doublie S. Proc. Natl. Acad. Sci. U.S.A. 2007, 104, 814–818. [DOI] [PMC free article] [PubMed] [Google Scholar]
- Clark J. M.; Beardsley G. P. Nucleic Acids Res. 1986, 14, 737–749. [DOI] [PMC free article] [PubMed] [Google Scholar]
- Iwai S. Nucleic Acids Symp. Ser. 2000, 121–122. [DOI] [PubMed] [Google Scholar]
- Reid B. R. Q. Rev. Biophys. 1987, 20, 1–34. [DOI] [PubMed] [Google Scholar]
- Patel D. J.; Shapiro L.; Hare D. Q. Rev. Biophys 1987, 20, 35–112. [DOI] [PubMed] [Google Scholar]
- van de Ven F. J. M.; Hilbers C. W. Eur. J. Biochem. 1988, 178, 1–38. [DOI] [PubMed] [Google Scholar]
- van Wijk J.; Huckriede B. D.; Ippel J. H.; Altona C. Methods Enzymol. 1992, 211, 286–306. [DOI] [PubMed] [Google Scholar]
- Boelens R.; Scheek R. M.; Dijkstra K.; Kaptein R. J. Magn. Reson. 1985, 62, 378–386. [Google Scholar]
- Frisch M. J.et al. Gaussian 03, revision C.02; Gaussian, Inc.: Wallingford, CT, 2004. [Google Scholar]
- Allawi H. T.; SantaLucia J. Jr. Biochemistry 1997, 36, 10581–10594. [DOI] [PubMed] [Google Scholar]
- Hazra T. K.; Das A.; Das S.; Choudhury S.; Kow Y. W.; Roy R. DNA Repair (Amst.) 2007, 6, 470–80. [DOI] [PMC free article] [PubMed] [Google Scholar]
- Weiss B.; Cunningham R. P. J. Bacteriol. 1985, 162, 607–610. [DOI] [PMC free article] [PubMed] [Google Scholar]
- Jiang D.; Hatahet Z.; Melamede R. J.; Kow Y. W.; Wallace S. S. J. Biol. Chem. 1997, 272, 32230–32239. [DOI] [PubMed] [Google Scholar]
- Roldan-Arjona T.; Anselmino C.; Lindahl T. Nucleic Acids Res. 1996, 24, 3307–3312. [DOI] [PMC free article] [PubMed] [Google Scholar]
- Hilbert T. P.; Boorstein R. J.; Kung H. C.; Bolton P. H.; Xing D.; Cunningham R. P.; Teebor G. W. Biochemistry 1996, 35, 2505–2511. [DOI] [PubMed] [Google Scholar]
- Sarker A. H.; Ikeda S.; Nakano H.; Terato H.; Ide H.; Imai K.; Akiyama K.; Tsutsui K.; Bo Z.; Kubo K.; Yamamoto K.; Yasui A.; Yoshida M. C.; Seki S. J. Mol. Biol. 1998, 282, 761–774. [DOI] [PubMed] [Google Scholar]
- Hilbert T. P.; Chaung W.; Boorstein R. J.; Cunningham R. P.; Teebor G. W. J. Biol. Chem. 1997, 272, 6733–6740. [DOI] [PubMed] [Google Scholar]
- Aspinwall R.; Rothwell D. G.; Roldan-Arjona T.; Anselmino C.; Ward C. J.; Cheadle J. P.; Sampson J. R.; Lindahl T.; Harris P. C.; Hickson I. D. Proc. Natl. Acad. Sci. U.S.A. 1997, 94, 109–114. [DOI] [PMC free article] [PubMed] [Google Scholar]
- Hazra T. K.; Kow Y. W.; Hatahet Z.; Imhoff B.; Boldogh I.; Mokkapati S. K.; Mitra S.; Izumi T. J. Biol. Chem. 2002, 277, 30417–30420. [DOI] [PubMed] [Google Scholar]
- Lin J. J.; Sancar A. Biochemistry 1989, 28, 7979–7984. [DOI] [PubMed] [Google Scholar]
- Reardon J. T.; Bessho T.; Kung H. C.; Bolton P. H.; Sancar A. Proc. Natl. Acad. Sci. U.S.A. 1997, 94, 9463–9468. [DOI] [PMC free article] [PubMed] [Google Scholar]
- Kow Y. W.; Wallace S. S.; Van Houten B. Mutat. Res. 1990, 235, 147–156. [DOI] [PubMed] [Google Scholar]
- Iwai S. Chemistry 2001, 7, 4343–4351. [DOI] [PubMed] [Google Scholar]
- Basu A. K.; Loechler E. L.; Leadon S. A.; Essigmann J. M. Proc. Natl. Acad. Sci. U.S.A. 1989, 86, 7677–7681. [DOI] [PMC free article] [PubMed] [Google Scholar]
- Ide H.; Kow Y. W.; Wallace S. S. Nucleic Acids Res. 1985, 13, 8035–8052. [DOI] [PMC free article] [PubMed] [Google Scholar]
- Rouet P.; Essigmann J. M. Cancer Res. 1985, 45, 6113–6118. [PubMed] [Google Scholar]
- Clark J. M.; Beardsley G. P. Biochemistry 1987, 26, 5398–5403. [DOI] [PubMed] [Google Scholar]
- Evans J.; Maccabee M.; Hatahet Z.; Courcelle J.; Bockrath R.; Ide H.; Wallace S. Mutat. Res. 1993, 299, 147–156. [DOI] [PubMed] [Google Scholar]
- Hayes R. C.; Petrullo L. A.; Huang H. M.; Wallace S. S.; LeClerc J. E. J. Mol. Biol. 1988, 201, 239–246. [DOI] [PubMed] [Google Scholar]
- Achey P. M.; Wright C. F. Radiat. Res. 1983, 93, 609–612. [PubMed] [Google Scholar]
- Moran E.; Wallace S. S. Mutat. Res. 1985, 146, 229–241. [DOI] [PubMed] [Google Scholar]
- Laspia M. F.; Wallace S. S. J. Bacteriol. 1988, 170, 3359–3366. [DOI] [PMC free article] [PubMed] [Google Scholar]
- Kow Y. W.; Faundez G.; Melamede R. J.; Wallace S. S. Radiat. Res. 1991, 126, 357–366. [PubMed] [Google Scholar]
- Cavaluzzi M. J.; Borer P. N. Nucleic Acids Res. 2004, 32, e13. [DOI] [PMC free article] [PubMed] [Google Scholar]
- Marky L. A.; Breslauer K. J. Biopolymers 1987, 26, 1601–1620. [DOI] [PubMed] [Google Scholar]
- Bohon J.; de los Santos C. R. Nucleic Acids Res. 2005, 33, 2880–2886. [DOI] [PMC free article] [PubMed] [Google Scholar]
- Gralla J.; Crothers D. M. J. Mol. Biol. 1973, 73, 497–511. [DOI] [PubMed] [Google Scholar]
- Petersheim M.; Turner D. G. Biochemistry 1983, 22, 256–263. [DOI] [PubMed] [Google Scholar]
- Longfellow C. E.; Kierzek R.; Turner D. H. Biochemistry 1990, 29, 278–285. [DOI] [PubMed] [Google Scholar]
- Piotto M.; Saudek V.; Sklenar V. J. Biomol. NMR 1992, 2, 661–665. [DOI] [PubMed] [Google Scholar]
- Delaglio F.; Grzesiek S.; Vuister G. W.; Zhu G.; Pfeifer J.; Bax A. J. Biomol. NMR 1995, 6, 277–93. [DOI] [PubMed] [Google Scholar]
- Pettersen E. F.; Goddard T. D.; Huang C. C.; Couch G. S.; Greenblatt D. M.; Meng E. C.; Ferrin T. E. J. Comput. Chem. 2004, 25, 1605–1612. [DOI] [PubMed] [Google Scholar]
Associated Data
This section collects any data citations, data availability statements, or supplementary materials included in this article.


