


Abstract
Position specific score matrices (PSSMs) are derived from multiple sequence alignments to aid in the recognition of distant protein sequence relationships. The PSI-BLAST protein database search program derives the column scores of its PSSMs with the aid of pseudocounts, added to the observed amino acid counts in a multiple alignment column. In the absence of theory, the number of pseudocounts used has been a completely empirical parameter. This article argues that the minimum description length principle can motivate the choice of this parameter. Specifically, for realistic alignments, the principle supports the practice of using a number of pseudocounts essentially independent of alignment size. However, it also implies that more highly conserved columns should use fewer pseudocounts, increasing the inter-column contrast of the implied PSSMs. A new method for calculating pseudocounts that significantly improves PSI-BLAST's; retrieval accuracy is now employed by default.
INTRODUCTION
The scores of local protein sequence alignments are generally constructed as the sum of ‘substitution scores’ for aligning pairs of amino acids, and ‘gap scores’ for aligning runs of amino acids in one sequence with null characters inserted into the other (1). Given certain generally applicable conditions, the substitution scores sij for aligning amino acids i and j can be written in the log-odds form 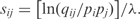 Here, the pi are ‘background frequencies’ with which the amino acids typically occur in proteins, the qij are ‘target frequencies’ characterizing aligned amino acid pairs in the ‘true alignments’ sought, and λ is a scale constant (2,3). All reasonable substitution matrices are implicitly of log-odds form, and the most widely used are explicitly so constructed (4–6). This log-odds formalism carries over naturally to protein profiles or position specific score matrices (PSSMs), where the scores for aligning amino acids to a specific column generally are constructed by the formula
 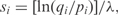 where qi is the predicted probability that a properly aligned homologous protein has amino acid i in that column. A central problem in the construction of PSSMs is therefore how to estimate the qi from a multiple alignment.
Several issues arise in converting a vector of observed counts c into a vector of predicted probabilities q. The first is that the sequences in a multiple alignment are rarely independent, but are rather related to one another by a complex phylogenetic tree. If each amino acid in the alignment is given equal weight, there is a danger that a large number of closely related sequences will outvote a smaller number of more diverse sequences, thus squandering the available information. To address this problem, a large number of weighting schemes have been proposed (7–16), which assign lower weights to data from closely related sequences. These weights cannot properly be derived from the data in a single alignment column, and therefore generally are constructed considering larger alignment regions. We employ below the method used by PSI-BLAST (17,18), which is a modification of that described by Henikoff and Henikoff (11).
Once weights have been applied to the sequences in a multiple alignment, the raw amino acid count vector c is converted into an ‘observed frequency’ vector f. If one assumes, as discussed below, that the observed data are equivalent to n, not necessarily integral, independent observations, then the weighted count vector is nf. Unless otherwise specified, it will be assumed below that when we speak of observed frequencies or counts, we mean f and nf.
It would be possible simply to adopt f as the predicted probabilities q, and this is indeed the maximum likelihood estimate. However, an obvious shortcoming to this approach is that, due to small sample sizes, it is likely the observed frequencies of several amino acids will be 0. The scores assigned to these amino acids will then be −∞, a reasonable result only if one truly believes it is impossible for these amino acids to appear in the column in question. One way around this problem is a Bayesian approach, in which a prior probability distribution is specified over the space of amino acid distributions. Mathematically, it is convenient to specify such a prior as a Dirichlet distribution. If the mean prior probability for amino acid i is chosen to be pi, then the expected posterior probability for amino acid i will be proportional to nfi + mpi. This approach is equivalent to adding m ‘pseudocounts’ to the n effective observations, with the pseudocounts distributed proportionately to the pi. The number of pseudocounts depends upon how peaked is the Dirichlet prior chosen.
A problem with the Dirichlet prior approach is that it ignores information about amino acid relationships that is present even in standard substitution matrices. For example, the BLOSUM-62 matrix (6) implies that the observation of a single leucine should increase the predicted probabilities for the observation of other hydrophobic amino acids, but a Bayesian approach using a Dirichlet prior such as discussed above will decrease the predicted probabilities for all non-observed amino acids. Accordingly, two main approaches have been proposed to balance prior knowledge of amino acid relationships and observed data. The first is the Dirichlet mixture method (19,20). This elegant formalism assumes a prior on the space of amino acid distributions that consists of a mixture of a number of Dirichlet distributions. These distributions can be seen as representing typical biases found frequently in protein positions. For example, one Dirichlet prior may favor aromatic residues, another charged residues, etc. A Dirichlet mixture prior can capture information about amino acid relationships and allow the observation of one amino acid to increase the predicted probability of another. The second approach is the data-dependent pseudocount method (17,21), which is employed by PSI-BLAST. As discussed in greater detail below, this approach predicts target frequencies by adding pseudocounts to observed counts, but lets the pseudocounts depend upon the observed data. In the limit of a large number of observations, the frequencies predicted by both the Dirichlet mixture and data-dependent pseudocount methods approach the observed frequencies. One advantage of the data-dependent pseudocount method is that the scores it implies can easily be engineered to reduce to any specified substitution matrix in the case of a column with n = 1. Used in the same algorithmic context, the two methods have roughly equivalent success in the recognition of subtle biological relationships (22).
One question that arises in applying the data-dependent pseudocount method is how many pseudocounts to employ, and whether this number should depend in any way upon the data. In the absence of theory, this question has to date been treated empirically. In this article, we study the question of pseudocount number through the lens of the minimum description length (MDL) principle (23), which we review briefly below. The MDL principle is of utility in choosing among models of varying complexity, usually corresponding to their number of degrees of freedom. We argue that varying the number of pseudocounts can be understood as varying model complexity, so that the MDL principle should apply. We find that this principle suggests that the number of pseudocounts used should depend upon the data observed. An implementation of the implied procedure improves PSI-BLAST database search accuracy to a modest but statistically significant degree. This success suggests that the minimum description length principle may provide a fruitful perspective for considering other aspects of protein profile construction.
MATERIALS AND METHODS
Evaluating search accuracy
In this article, we evaluate the search accuracy of a baseline version of PSI-BLAST (blastpgp release 2.2.17) and several variants. The evaluation is based on a ‘gold standard’ for determining whether two sequences are related. We employ the ASTRAL 40 subset (24) of release 1.71 of the Structural Classification of Proteins (SCOP) database (25,26), excluding sequences from superfamilies with only one member. We divide these sequences into a training query set (odd numbered sequences when listed lexicographically) and a test query set (even numbered sequences). We use the training set to optimize parameter settings, but evaluate the resulting search programs using the test set.
PSI-BLAST is most effective at constructing PSSMs when it compares queries to a large sequence database, for which the true and false sequences relationships are in general unknown. Accordingly, our protocol has two phases. In the first phase, we use PSI-BLAST to compare each query to a frozen version (available from the authors upon request) of the non-redundant (nr) protein sequence database maintained by the National Center for Biotechnology Information (27) for four rounds, or less if convergence is reached earlier, saving the PSSM used in the last round as a ‘checkpoint’. In the second phase, we use PSI-BLAST to compare the checkpointed PSSM to the SCOP database. For a given query sequence, we consider any sequences returned that were classified by SCOP as from the same superfamily to be true positives and any sequences classified as from different folds to be false positives. Sequences that are from the same fold but from different superfamilies are treated as neither true nor false positives because it is difficult to determine whether such sequences are in fact homologous. The training set contains 3609 queries having 111 809 true positives, and the test set 3609 queries with 109 133 true positives.
Given a ranked list of search results classified as true or false positives, Receiver Operating Characteristic (ROC) analysis provides a useful tool for measuring search accuracy (28). In brief, suppose that as one descends through this list, the cumulative number of true positives is plotted against the cumulative number of false positives. If there are t possible true positives, then the ROCn score is the area under this curve, up to n false positives, divided by t × n. A ROCn score of 1.0 requires all true positives to be found before the first false positive and corresponds to perfect retrieval. In all our tests, we pool the search results from all queries, ranked by E-value, and evaluate search methods using the ROC5000 score for the resulting list, which corresponds to about 1.4 errors per query. Other ROCn scores yield equivalent results, and we report both ROC5000 and ROC10 000 scores below. Standard errors are calculated as described in Schäffer et al. (18).
Data-dependent pseudocounts
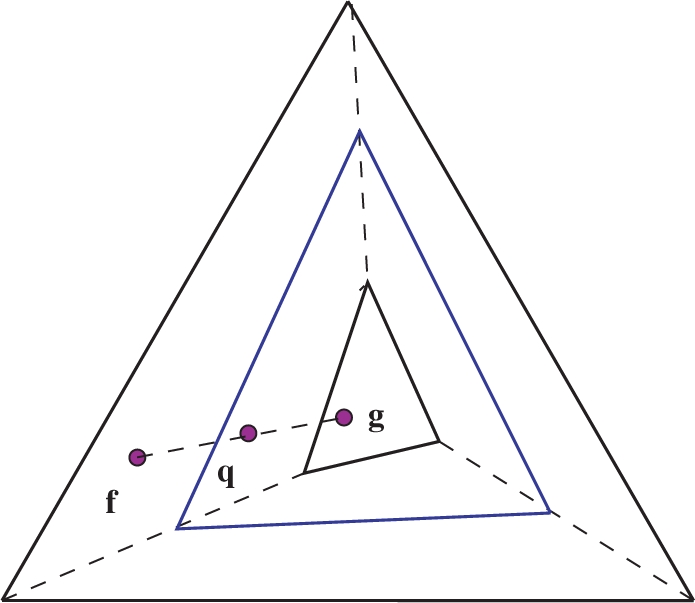
It is useful to develop a geometric understanding of the data-dependent pseudocount method. A set of target frequencies q is a vector with 20 elements. The elements of q are constrained to sum to 1, which reduces the degrees of freedom to 19. We represent the set of all possible q graphically as an equilateral triangle, by analogy to the case of only three amino acids (Figure 1a). In pairwise sequence comparison, each amino acid in the query sequence selects a particular row of the standard substitution matrix S to score amino acids with which it is aligned. A row of S in turn can be seen as corresponding to a vector of target frequencies (Figure 1b). An amino acid in the query can therefore be seen as a frequency vector f that happens to lie on a vertex of frequency space, and a score matrix can be seen as applying a linear transformation to f to obtain the frequency vector g, by the equation g = Mf, where Mij = pi exp(λSij), and λ is the implicit scale of the substitution matrix (2,3). (Note that the substitution matrix S, the matrix of all target frequencies, and the linear transformation matrix M, while all related, are distinct.) This linear transformation can be applied to any observed frequency vector (Figure 1c), and one approach to estimating target frequencies q is simply to use this transformation, which yields the standard substitution matrix in the case of a single observation. It does not, however, have the desirable property of q approaching f for large numbers of observations.
Figure 1.

Frequency distribution space. (a) The frequencies for the case of three amino acids can be represented by points inside an equilateral triangle. (b) A substitution matrix maps the vertices of the simplex, each of which corresponds to the observation of a single amino acid, to target frequencies in the interior of the simplex. (c) The linear transformation implied by a substitution matrix may be applied to the whole of frequency distribution space, mapping any vector of observed frequencies f to a pseudocount frequency vector g.
The data-dependent pseudocount method estimates q with a linear combination of f and the g (Figure 2). Specifically,
| 1 |
where I is the identity matrix. The parameter α determines the relative weight given to the observed counts, which are proportional to f, and the data-dependent pseudocounts, which are proportional to g.
Figure 2.
Linear transformations of frequency distribution space. A substitution matrix imposes a linear transformation M that maps each observed frequency vector f to a pseudocount vector g, and all of frequency distribution space to the smallest simplex shown. For values of α between 0 and 1, the use of pseudocounts imposes a linear transformation  that maps f to a point q on the line between f and g, and the frequency distribution space to the intermediate simplex shown.
How should α depend on the effective number of counts n in a column? When n is 1, α should equal 1, so that q reduces to g. As n gets large, α should approach 0. Other than these limiting cases there are few theoretical constraints. PSI-BLAST has specified α using the formula
| 2 |
where m is an empirically determined constant, although it was originally suggested that m might be chosen to grow proportionally with  (21,29).
We ran baseline PSI-BLAST on our training set using several different values of m. We found empirically the best integral value on the training set is 11. With m = 11, baseline PSI-BLAST attains a ROC5000 of 0.2407 ± 0.0006 on the test set (Table 1).
Table 1.
PSI-BLAST retrieval efficiency
| PSI-BLAST program version | ROC5000 (± 0.0006) | ROC10 000 (± 0.0004) |
|---|---|---|
| Baseline (m=11) | 0.2407 | 0.2572 |
| New calculation of n (m=28) | 0.2419 | 0.2584 |
| MDL principle (m0 = 5.5) | 0.2453 | 0.2628 |
| Relative entropy formula (m0 = 5.5, a = 0.061, b = 0.8) | 0.2456 | 0.2631 |
Number of independent observations
In any application that adds pseudocounts to observed counts, one must first estimate the number of observed counts. Just as one must weigh sequences to account for correlations among them, so one must analyze a set of sequences to determine how many effectively independent observations they represent. For example, ten aligned sequences may all have a leucine in a particular column. If the ten sequences, although related, have low mutual sequence similarity, then the uniform appearance of leucine speaks strongly to the importance of this amino acid in this column. On the other hand, if the ten sequences are identical, then the evidence for the importance of leucine in this position is really no greater than the evidence from a single sequence.
To estimate accurately the number of effectively independent observations a column of data represents, it is valuable to have alignment data not just from the column in question, but from other columns as well. As described elsewhere (18), for a specific column from a multiple alignment produced by PSI-BLAST, we base our calculation on a reduced multiple alignment. Omitting a few details, this alignment is constructed from the set A of all sequences that participate in the alignment at this column, including those that have gaps there. Given A, we then consider the maximal set C of contiguous columns in which all sequences in A are aligned. Confining attention to the sequences in A, the baseline PSI-BLAST's; estimate for the effective number n of independent sequences is the average number of distinct amino acids observed in the columns C, with nulls counted as a twenty-first amino acid. This method yields n = 1 independent observation for all columns from an optimal alignment of identical sequences, and n increases as the sequences aligned become mutually dissimilar. A clear disadvantage of the method, however, is that it saturates at a maximum of n = 21. Accordingly, we seek an improved method for estimating n.
Assume a model in which the amino acids in a column of size n are unconstrained, and have probabilities of occurrence p1,p2,…,p20. If the amino acids are chosen independently and at random, then the probability that an amino acid of type i occurs at least once is 1 − (1 − pi)n. Therefore, the expected number N of distinct amino acids observed is given by
| 3 |
Because f is monotonic in n, and because it may be applied to nonintegral n, we may invert f to estimate the effective number of independent draws that correspond to N distinct observed amino acids. Table 2 lists some values of f(n) calculated from the pi implicit in BLOSUM-62.
Table 2.
Mean number of distinct amino acids N as a function of the number of independent sequences n
| n | N | n | N | n | N | n | N |
|---|---|---|---|---|---|---|---|
| 1 | 1.000 | 11 | 8.334 | 25 | 13.672 | 100 | 19.367 |
| 2 | 1.942 | 12 | 8.862 | 30 | 14.820 | 120 | 19.595 |
| 3 | 2.828 | 13 | 9.362 | 35 | 15.723 | 140 | 19.730 |
| 4 | 3.664 | 14 | 9.835 | 40 | 16.440 | 160 | 19.814 |
| 5 | 4.452 | 15 | 10.283 | 45 | 17.014 | 180 | 19.869 |
| 6 | 5.195 | 16 | 10.708 | 50 | 17.477 | 200 | 19.906 |
| 7 | 5.897 | 17 | 11.110 | 60 | 18.163 | 250 | 19.957 |
| 8 | 6.559 | 18 | 11.492 | 70 | 18.631 | 300 | 19.979 |
| 9 | 7.184 | 19 | 11.853 | 80 | 18.959 | 350 | 19.989 |
| 10 | 7.775 | 20 | 12.197 | 90 | 19.194 | 400 | 19.995 |
As described above, although one may apply f−1 to the number of distinct amino acids N observed in a single column, it is generally better to calculate N as the average over as many columns as available. In calculating N, we count aligned gap characters as a twenty-first amino acid, but if there are 21 amino acids in a column, we set N for that column to 20.
The model yielding Equation (3) assumes that the amino acids in a column are under no evolutionary constraint. For most positions in real proteins this is unlikely to be the case, and many columns will be more highly conserved. Therefore, for an alignment with |C| columns, we calculate N as the average over the ⌈|C|/2⌉ columns with the greatest number of distinct amino acids. For  , we cap the estimated n at 400. Finally, it is possible that an alignment involving r actual sequences will yield an estimated n that is greater than r. When this happens, we set n equal to r.
As described in Equation (2), PSI-BLAST uses the number of independent sequences n in conjunction with the empirical pseudocount parameter m to construct its position-specific scores. With the new way of calculating n, the optimal value of m changes; using our training set, we estimate its value at 28. The new calculation of n, with m = 28, yields a ROC5000 score on the test set of 0.2419±0.0006 (Table 1). This is better than the baseline calculation of n, with m = 11, but the improvement is of marginal significance. The new calculation of n is used in all other variants of PSI-BLAST described below.
The minimum description length principle and protein profiles
The minimum description length principle has an extensive literature but has been little applied in the field of protein and DNA sequence alignment. In general, it proposes an answer to the question of which model to choose to describe a set of data, when various models of varying complexity are available. Models with a greater number of parameters will, in general, fit the available data better. However, once a certain level of complexity is reached they begin to overfit the data—they describe the observed data more precisely but at the cost of describing underlying regularities less well. Thus models that are too complex, as well as models that are too simple, do a relatively poor job of predicting new data.
Informative reviews of the MDL principle can be found in references (23) and (30). To simplify matters somewhat, given a set of data, we generally choose a ‘theory’ that best fits the data from among a parameterized set of theories, called a ‘model’. There may, however, be various models available, such as, in certain applications, the set of all linear functions, the set of all quadratic functions, etc. How complex should the model be from which to choose the best theory? The MDL principle observes that a description of the data can usually be divided into two parts: a description of the theory used to describe the data, and a description of the data given the theory. It proposes that the best or most predictive theory will be that which minimizes the sum of these two description lengths. To apply this principle, one needs to be able to quantify the description lengths.
Generally, the easier description length to calculate is that of the data given the theory. If the set of possible outcomes is discrete, a theory will assign them probabilities P1,P2,…. From information theory, the description length of each data point corresponding to outcome i is  bits (31). The description length of the data is then just of the sum of this quantity over all data points. If there are n data points, and they follow the probability distribution f, for large n their minimum description length, using f as a theory, approaches
| 4 |
where H(f) is the entropy of f (31). If instead, one were to describe the data using the distribution q as a theory, the description length would be  bits. In other words, the description length of the data would be increased by
| 5 |
where D(f||q) is the relative entropy of f and q (31).
It is harder to quantify the description length of the theory. This is best taken as a number attached to the complexity of the model from which the theory is chosen (23,30). Because theories with nearly identical parameters are not independent, a model can be understood to encompass a certain number of effectively independent theories. For a parameterized set of theories, in the limit of a large number of observations n, the density of independent theories can be thought of as proportional to the square root of the model's; Fisher information (23,30,32). Integrating this quantity over the parameters' range yields a measure of the number of effectively independent theories a model contains. The description length of a model is the log of this number, i.e. the amount of information required to specify a particular theory within the model.
Let us examine how these considerations may be applied to the specification of protein profiles, and more specifically to the estimation of amino acid target frequencies q for a single profile position. One may model n data points using a multinomial distribution with expected value q. The Fisher information of this model is
| 6 |
For a fixed number of degrees of freedom, a constant times the square root of this quantity may be integrated over the parameter space to estimate the number of independent theories described by the model. To illustrate, if one assumes a multinomial model with three rather than twenty amino acids, the density of independent theories is shown in Figure 3, where the points are chosen randomly, but with density proportional to the square root of the Fisher information. For a multinomial with k free parameters (corresponding to k + 1 amino acids), it is possible to show (Supplementary Data A) that in the limit of large n, the description length of the model approaches
| 7 |
For the standard amino acid alphabet, k = 19.
Figure 3.

The effect of pseudocounts on the number of independent theories. A theory describing the frequency distribution of three amino acids can be represented as a point within an equilateral triangle. The density of independent theories, which is proportional to (∏pi)− 1/2, is represented by the density of points within the triangle, and increases as one moves away from its center. Using pseudocounts confines the theories one may consider to points within a simplex inside the frequency distribution space. This simplex has a smaller volume than the complete space, and also has a smaller average density of independent theories.
The usual application of the MDL principle is to select a model with an appropriate number of parameters. We will, however, use it differently, as described below, to select an appropriate number of pseudocounts. This requires additional technical assumptions which are described in Supplementary Data B.
The MDL principle and pseudocounts
Given a column with n effective observations, and observed frequencies f, the choice of  in Equation (1) yields the maximum likelihood estimate q = f. The description length of the data using q as a theory is then
 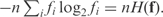 However, if
  , the description length of the data increases to
  . In other words, the description length of the data increases by nD(f||q); see Equation (5). By the MDL principle, this can be advantageous only if the description length of the model decreases by a greater amount.
As discussed above, the effective number of independent theories corresponding to a multinomial can be estimated by integrating a constant times the square root of the Fisher information over the whole parameter space. As illustrated in Figure 3, when pseudocounts are employed with  , the volume of parameter space in which the predicted q can fall decreases. Subject to technical assumptions described in Supplementary Data B, the decrease in the model description length may be derived from an integral over this smaller volume. Specifically, this decrease, in bits, is the difference between the logarithm base 2 of the two integrals. We are unable to calculate the integral over the smaller volume analytically, but can do so numerically.
Figure 4 shows, on a logarithmic scale, the effect that applying pseudocounts, with the matrix  implied by BLOSUM-62, has on the description length of the multinomial model, as α ranges from 0 to 1. Positive values on the y-axis represent decreases in model description length with respect to
  . Increasing α affects the description length in two ways: first, the volume in which q can fall decreases; second, the average density of independent theories within this volume decreases. The first effect, labeled ‘volume effect’ in Figure 4, can be calculated analytically. By Equation (1), using pseudocounts to calculate q is equivalent to multiplying the observed frequencies f by the matrix
  . This has the effect of multiplying the volume of parameter space in which q can fall by the absolute value of the determinant of
  . The second effect, labeled ‘density effect’ in Figure 4, must be computed numerically. We sampled 5 × 10⁹ vectors uniformly from the set of all possible amino acid frequency vectors. For α ranging from 0 to 1, in increments of 0.002, we applied
  to all of our sampled frequency vectors and calculated the average value of the square root of the Fisher information over the resulting points. The total decrease in the description length of the multinomial model is obtained by adding the volume and density effects, and is labeled ‘total effect’ in Figure 4. Note that the curves shown in Figure 4 are valid only in the limit of large n. Although this will constrain our ability to apply the MDL principle in detail, it will still allow us to draw several valuable conclusions.
Figure 4.

Decrease in model description length as a result of using pseudocounts implied by the BLOSUM-62 substitution matrix. For large n, one may calculate the decrease in the description length of the model for α between 0 and 1, compared to the description length of the model at  . The total decrease can be decomposed into a decrease in simplex volume, and a decrease in independent theory density. Half as many independent theories corresponds to a decrease of one bit. Positive values on the y-axis represent decreases in model description length.
To summarize, as α and the number of pseudocounts increases, the description length of the data f, given the calculated theory q, increases (Supplementary Data C). However, the description length of the multinomial model, as measured by the logarithm of the effective number of independent theories it comprises, decreases, as shown in Figure 4. The MDL principle claims that the optimal value of α will be that for which the sum of these two description lengths is minimized.
RESULTS
Pseudocounts as a function of the number of independent observations
To investigate the implications of the MDL principle, we first examine a toy hydrophobic protein column. Table 3 shows the observed amino acid frequencies f for this column and the background frequencies p implicit in the BLOSUM-62 matrix. In Figure 5, we plot, for these frequencies and n = 500 observations, the change in the data, model, and total description lengths with respect to a base at  . For the model and total description lengths, a positive value in the plot indicates a ‘decrease’ in the description length, whereas for the data description length a positive value indicates an ‘increase’. The data description length was computed using Equation (5), whereas the model description length was computed numerically as described in the previous section. The minimum total description length is at
  . Solving Equation (2) for m yields
| 8 |
which implies the optimal number of pseudocounts is m = 19.4.
Table 3.
The observed frequencies fi of a toy hydrophobic alignment column, and the background probabilities pi of BLOSUM-62
| fi | pi | fi | pi | ||
|---|---|---|---|---|---|
| A | 0.010 | 0.074 | M | 0.200 | 0.025 |
| C | 0.010 | 0.025 | N | 0.010 | 0.045 |
| D | 0.001 | 0.054 | P | 0.010 | 0.039 |
| E | 0.001 | 0.054 | Q | 0.010 | 0.034 |
| F | 0.050 | 0.047 | R | 0.001 | 0.052 |
| G | 0.010 | 0.074 | S | 0.003 | 0.057 |
| H | 0.010 | 0.026 | T | 0.003 | 0.051 |
| I | 0.200 | 0.068 | V | 0.200 | 0.073 |
| K | 0.001 | 0.058 | W | 0.020 | 0.013 |
| L | 0.200 | 0.099 | Y | 0.050 | 0.032 |
Figure 5.

Selecting an optimal proportion of pseudocounts using the MDL principle. For n = 500 and the observed frequencies f listed in Table 3, we apply pseudocounts as implied by the BLOSUM-62 substitution matrix. We use Equation (5) to compute the change in the description length of the data, when compared to the description length of the data at  , for α between 0 and 0.1. The dot-dashed curve (in red) shows the increase in the description length of the data. The dashed curve (in blue) shows the decrease in the description length of the model. The total decrease in the description length, shown by the solid curve (in black), is maximized at
  , which corresponds to 19.4 pseudocounts.
We can perform the same calculation for varying numbers n of independent observations. While the curve in Figure 5 showing change in the description length of the model remains fixed, the curve representing the increase in the description length of the data shifts upward with increasing n. Accordingly as n grows, the optimal α will decrease, although it is not obvious how the implied optimal number of pseudocounts m will behave. In Figure 6, we plot the calculated value of m as a function of n. It is evident that while not precisely constant, the value of m is almost unchanging for n between 300 and 1000.
Figure 6.

Optimal number of pseudocounts, m, as a function of the number of independent observations, n. Using the data listed in Table 3 and the method illustrated in Figure 5, we found the optimal number of pseudocounts for varying n. The method cannot be valid for n < 212 (vertical dotted line), because the calculated decrease in model description length for  is greater than the description length of the model at
  , but it is not possible for a model to have a negative description length. For n between 212 and 1000, the calculation suggests we use a nearly constant number m of pseudocounts, roughly 19.4. In the limit of very large n, the MDL principle suggests the number of pseudocounts should grow proportionately to n1/3.
What can we make of the apparent divergence of m for small n? As stated above, the theory that allows us to calculate the description length of the model is valid only for large n. As seen in Figure 4, when  , we calculate that the description length of the model is about 46.3 bits less than when
  . However, by formula 7, the total description length of the model is less than 46.3 bits when n is less than 212. Thus, our calculation cannot be accurate in this range of n. Not having a good way to apply the MDL principle for small n, we take the near constancy of m for n between 300 and 1000 as an indication that m can be assumed to be nearly constant for all n less than 1000. This conforms with the empirical result that a constant m outperforms one proportional to
  .
.
If our asymptotic theory can deal with small n only by implication, what does it say about very large n? Except when f is equal to the background frequencies, in which case applying pseudocounts has no effect, the description length of the data is a strictly increasing function of α. The calculated value of the description length of the model does not depend on n, but the curve representing the change in the data shifts upward with increasing n. Therefore, α must converge to zero as n grows large, though it converges at different rates for different values of f.
It is possible to show that for small α, the decrease in model description length is approximately  (Supplementary Data D), whereas the increase in data description is approximately
  Thus the total decrease in description length is given by
| 9 |
which reaches a maximum at  . By Equation (8), this implies that the optimal number of pseudocounts should grow as n1/3. We have seen that, for our toy column, m is almost constant for n < 1000, so the asymptotic growth of m with the cube root of n does not have appreciable effect until n is very large indeed. It would be hard to test this theoretical result empirically, because multiple alignments with which we are likely to deal will not have n sufficiently large.
Pseudocounts as a function of column composition
So far, the MDL principle has only confirmed the earlier empirical result that for practical alignment sizes the number of pseudocounts should not depend on n. In addition, the principle suggests that the number of pseudocounts should depend on the composition of the column: for different observed frequencies, the increase in data description length as a function of α differs, but the reduction in model description length as a function of α remains fixed (Figure 5).
To test this prediction, we implemented an MDL routine to optimize α, and thereby the number of pseudocounts m, for different observed frequency vectors f. Our theory may be used properly only for a large number n′ of independent observations, although then the number of pseudocounts it yields is effectively independent of n′. Therefore, whatever the actual value of n, we always apply the theory with n′ = 500. The value 500 here is somewhat arbitrary, and a larger value of n′ could be used with almost identical results.
We cannot, however, escape a certain degree of circularity, because when we assume that n′ is large, it is not reasonable to claim as well that many of the observed frequencies are zero (as is frequently the case when n is small), and doing so yields poor results. Accordingly, before we apply the MDL theory, it is best to eliminate zero frequencies. We use Equations (1) and (2) with a small, fixed number m0 of initial pseudocounts, to transform the observed frequency vector f to f′ using the equation
| 10 |
We then apply the MDL theory to f′ and n′ = 500 to obtain m, the estimated optimal number of pseudocounts. Finally, we estimate the target frequencies q using the equation
| 11 |
We select m0 to optimize retrieval on our training set, achieved at m0 = 5.5. Using this value, and the procedure just described, we then study the effectiveness of the MDL method on our test set. The ROC5000 score is 0.2453 ± 0.0006, a significant albeit modest improvement on that of the constant pseudocount method (Table 1).
Pseudocounts as a function of column entropy
There is a strong correlation between the value of α chosen by the MDL principle and the relative entropy of a column's; amino acid distribution to the background distribution. To study this relationship, we constructed a large set of columns representative of typical protein sequence alignments. Specifically, we ran PSI-BLAST, using the new method for calculating n and 28 pseudocounts, on the 103 queries of the aravind103 query set (18,33), against SWISS-PROT (34). For ease of implementation, column data were recorded on the fifth round for all non-X positions in those query sequences for which the search did not converge before the full five rounds were completed. We considered those 10 875 columns representing at least five independent observations. For each, we calculated the α implied by the MDL method described above. In Figure 7, we plot α versus D(f′||p) (abbreviated below as D) on a log-log scale, along with a linear regression line, shown in red. As can be seen, there is a good (correlation coefficient −0.87) linear correlation, implying an approximate power-law relationship
| 12 |
with a≈0.081 and b≈0.75, when D is expressed in bits. Qualitatively, columns that are unlike the background frequencies imply a low α, and relatively few pseudocounts, while columns that are similar to the background frequencies imply a high α. In comparison to constant pseudocounts, this will tend to render the substitution scores implied by low relative-entropy columns even closer to zero, while it will tend to render the scores of high relative-entropy columns greater in absolute value. In other words, it will tend to increase the ‘contrast’ of the implied PSSMs.
Figure 7.

The relationship between the pseudocount proportion α implied by the MDL principle and column relative entropy. Each point represents a multiple alignment column constructed by PSI-BLAST from the aravind103 query set (18,33) run against SWISS-PROT (34). Only columns with  independent observations are considered. The x-axis represents the relative entropy D(f′ || p), where f′ is the observed frequency vector of the column after the addition of m0 = 5.5 pseudocounts, and p is the background amino acid frequency vector implicit in BLOSUM-62. The y-axis represents the pseudocount proportion α calculated from the MDL theory. The upper diagonal line (shown in red) represents the best power-law fit to the data. The lower diagonal line (shown in green) represents the power-law relationship of α to D(f′ || p) that empirically yields the optimal retrieval on the training set. Note that the background frequency vector p is the fixed point of the linear transformation M. Therefore, if f′= p, the increase in the description length of the data is identically zero for all α, implying that the MDL is optimized at
  . For any finite n, vectors f′ close enough to p also imply an optimal α of 1. A small number of such points are seen at the upper left of this graph.
One question that arises from examining Figure 7 is whether a simple power-law formula expressing α as a function of D might perform as well or better than the complicated MDL procedure for calculating α. Assuming an equation of the form (12), and m0 = 5.5, we sought to optimize retrieval on our training set by varying a and b. The best values we could find were a = 0.061 and b = 0.8, and the implied power law is shown as a green line in Figure 7. On our test set, the simple formula (12) yields a ROC5000 score 0.2456±0.0006 (Table 1), statistically no different than that of the MDL theory.
DISCUSSION
We have shown that a new method for estimating the number n of independent observations represented by a multiple alignment column leads to improved retrieval accuracy. This method is now used in the PSI-BLAST code maintained and distributed by the NCBI (blastpgp release 2.2.18).
Nishida et al. (35), in a paper published jointly with this one, have made an empirical study of the use of pseudocounts in the construction of DNA position-specific score matrices. Like us, they conclude that the number of pseudocounts should be independent of the number of sequences in the source multiple alignment, at least for alignments of realistic size. Our papers also agree that the number of pseudocounts should decrease for alignments with greater relative entropy to the background distribution, although Nishida et al. (35) consider adjusting pseudocounts for complete PSSMs, whereas we consider varying them on a column-by-column basis. Henikoff and Henikoff (22) have also proposed that, in the protein alignment context, the number of pseudocounts should be decreased for columns with high relative entropy, although without any strongly argued motivation.
We improved the retrieval performance of PSI-BLAST by making the number of pseudocounts dependent upon a column's; composition. The MDL principle provides one justification for this procedure, but it is possible to derive a similar PSSM score adjustment from a different theoretical perspective. For example, one might argue that because different protein positions evolve at different rates, the appropriate substitution matrix to use for a slowly evolving position is one corresponding to a lower PAM distance (4), or one with a greater relative entropy. Therefore, instead of varying the number of pseudocounts as a function of a the relative entropy of a column, one might instead vary the substitution matrix from which the pseudocounts are derived. If one examines Figure 2 and Equation (1), one may observe that decreasing the number of pseudocounts decreases α and moves the derived target frequency vector q closer to f. Alternatively, decreasing the PAM distance of the underlying substitution matrix expands both inner simplexes and also moves q towards f, without varying α or the number of pseudocounts. Thus, this alternative perspective has the same qualitative effect on PSSM scores as does the MDL principle.
As seen above, statistically indistinguishable performance is achieved by using the MDL principle to calculate an appropriate number of pseudocounts, and by using an empirical formula that calculates the number of pseudocounts as a function of column relative entropy. The PSI-BLAST code maintained and distributed by the NCBI (blastpgp release 2.2.18) now implements by default this empirical formula for calculating pseudocounts. The number of initial pseudocounts m0 used to calculate f′ and the parameters a and b in formula (12) may be modified based on further testing. A user may override the rule for calculating pseudocounts by specifying a fixed number of pseudocounts; for BLOSUM-62 we recommend 28–30. The new method of computing the effective number of observations is used, whether or not the number of pseudocounts is fixed.
As described, alternative theoretical formulations can yield adjustments similar to those implied by the MDL principle in the calculation of target frequencies and PSSM scores. Ultimately, it is the quality of retrieval that is important, not the theory behind target frequency construction. Nevertheless, theories are important in that they can suggest fruitful avenues for further investigation. The MDL theory supports the use of an essentially constant number of pseudocounts over the range of alignment sizes we are likely to encounter. It also predicts that pseudocount number should in general decrease with increasing column relative entropy. That these results are consistent with empirical retrieval performance suggests that the MDL principle provides a useful perspective when thinking about protein model construction.
SUPPLEMENTARY DATA
Supplementary Data are available at NAR Online.
FUNDING
Intramural Research Program of the National Library of Medicine of the National Institutes of Health. Funding for open access charge: Intramural Research Program of the National Library of Medicine of the National Institutes of Health.
Conflict of interest statement. None declared.
Supplementary Material
REFERENCES
- 1.Smith TF, Waterman MS. Identification of common molecular subsequences. J. Mol. Biol. 1981;147:195–197. doi: 10.1016/0022-2836(81)90087-5. [DOI] [PubMed] [Google Scholar]
- 2.Karlin S, Altschul SF. Methods for assessing the statistical significance of molecular sequence features by using general scoring schemes. Proc. Natl Acad. Sci. USA. 1990;87:2264–2268. doi: 10.1073/pnas.87.6.2264. [DOI] [PMC free article] [PubMed] [Google Scholar]
- 3.Altschul SF. Amino acid substitution matrices from an information theoretic perspective. J. Mol. Biol. 1991;219:555–565. doi: 10.1016/0022-2836(91)90193-A. [DOI] [PMC free article] [PubMed] [Google Scholar]
- 4.Dayhoff MO, Schwartz RM, Orcutt BC. A model of evolutionary change in proteins. In: Dayhoff MO, editor. Atlas of Protein Sequence and Structure. Vol. 5. Washington, DC: National Biomedical Research Foundation; 1978. pp. 345–352. [Google Scholar]
- 5.Schwartz RM, Dayhoff MO. Matrices for detecting distant relationships. In: Dayhoff MO, editor. Atlas of Protein Sequence and Structure. Vol. 5. Washington, DC: National Biomedical Research Foundation; 1978. pp. 353–358. [Google Scholar]
- 6.Henikoff S, Henikoff JG. Amino acid substitution matrices from protein blocks. Proc. Natl Acad. Sci. USA. 1992;89:10915–10919. doi: 10.1073/pnas.89.22.10915. [DOI] [PMC free article] [PubMed] [Google Scholar]
- 7.Altschul SF, Carroll RJ, Lipman DJ. Weights for data related by a tree. J. Mol. Biol. 1989;207:647–653. doi: 10.1016/0022-2836(89)90234-9. [DOI] [PubMed] [Google Scholar]
- 8.Sibbald PR, Argos P. Weighting aligned protein or nucleic acid sequences to correct for unequal representation. J. Mol. Biol. 1990;216:813–818. doi: 10.1016/S0022-2836(99)80003-5. [DOI] [PubMed] [Google Scholar]
- 9.Sander C, Schneider R. Database of homology-derived protein structures and the structural meaning of sequence alignment. Protein Struct. Funct. Genet. 1991;9:56–68. doi: 10.1002/prot.340090107. [DOI] [PubMed] [Google Scholar]
- 10.Gerstein M, Sonnhammer R, Clothia C. Volume changes in protein evolution. J. Mol. Biol. 1994;236:1067–1078. doi: 10.1016/0022-2836(94)90012-4. (Appendix: A method to weight protein sequences to correct for unequal representation.) [DOI] [PubMed] [Google Scholar]
- 11.Henikoff S, Henikoff JG. Position-based sequence weights. J. Mol. Biol. 1994;243:574–578. doi: 10.1016/0022-2836(94)90032-9. [DOI] [PubMed] [Google Scholar]
- 12.Thompson JD, Higgins DG, Gibson TJ. Improved sensitivity of profile searches through the use of sequence weights and gap excision. Comput. Appl. Biosci. 1994;10:19–29. doi: 10.1093/bioinformatics/10.1.19. [DOI] [PubMed] [Google Scholar]
- 13.Eddy SR, Mitchison G, Durbin R. Maximum discrimination hidden Markov models of sequence consensus. J. Comput. Biol. 1995;2:9–23. doi: 10.1089/cmb.1995.2.9. [DOI] [PubMed] [Google Scholar]
- 14.Gotoh O. A weighting system and algorithm for aligning many phylogenetically related sequences. Comput. Appl. Biosci. 1995;11:543–551. doi: 10.1093/bioinformatics/11.5.543. [DOI] [PubMed] [Google Scholar]
- 15.Krogh A, Mitchison G. Maximum entropy weighting of aligned sequences of protein or DNA. In: Rawlings C, Clark D, Altman R, Hunter L, Lengauer T, Wodak S, editors. Proceedings of the Third International Conference on Intelligent system for Molecular Biology. Menlo Park, CA: AAAI Press; 1995. pp. 215–221. [PubMed] [Google Scholar]
- 16.Bailey TL, Gribskov M. The megaprior heuristic for discovering protein sequence patterns. In: States DJ, Agarwal P, Gaasterland T, Hunter L, Smith R, editors. Proceedings of the Fourth International Conference on Intelligent system for Molecular Biology. Menlo Park, CA: AAAI Press; 1996. pp. 15–24. [PubMed] [Google Scholar]
- 17.Altschul SF, Madden TL, Schäffer AA, Zhang J, Zhang Z, Miller W, Lipman DJ. Gapped BLAST and PSI-BLAST: a new generation of protein database search programs. Nucleic Acids Res. 1997;25:3389–3402. doi: 10.1093/nar/25.17.3389. [DOI] [PMC free article] [PubMed] [Google Scholar]
- 18.Schäffer AA, Aravind L, Madden TL, Shavirin S, Spouge JL, Wolf YI, Koonin EV, Altschul SF. Improving the accuracy of PSI-BLAST protein database searches with composition-based statistics and other refinements. Nucleic Acids Res. 2001;29:2994–3005. doi: 10.1093/nar/29.14.2994. [DOI] [PMC free article] [PubMed] [Google Scholar]
- 19.Brown M, Hughey R, Krogh A, Mian IS, Sjölander K, Haussler D. Using Dirichlet mixture priors to derive hidden Markov models for protein families. In: Hunter L, Searls D, Shavlik J, editors. Proceedings of the First International Conference on Intelligent system for Molecular Biology. Menlo Park, CA: AAAI Press; 1993. pp. 47–55. [PubMed] [Google Scholar]
- 20.Sjölander K, Karplus K, Brown M, Hughey R, Krogh A, Mian IS, Haussler D. Dirichlet mixtures: a method for improved detection of weak but significant protein sequence homology. Comput. Appl. Biosci. 1996;12:327–345. doi: 10.1093/bioinformatics/12.4.327. [DOI] [PubMed] [Google Scholar]
- 21.Tatusov RL, Altschul SF, Koonin EV. Detection of conserved segments in proteins: iterative scanning of sequence databases with alignment blocks. Proc. Natl Acad. Sci. USA. 1994;91:12091–12095. doi: 10.1073/pnas.91.25.12091. [DOI] [PMC free article] [PubMed] [Google Scholar]
- 22.Henikoff JG, Henikoff S. Using substitution probabilities to improve position-specific scoring matrices. Comput. Appl. Biosci. 1996;12:135–143. doi: 10.1093/bioinformatics/12.2.135. [DOI] [PubMed] [Google Scholar]
- 23.Grünwald PD. The Minimum Description Length Principle. Cambridge, MA: MIT Press; 2007. [Google Scholar]
- 24.Chandonia J-M, Hon G, Walker NS, Lo Conte L, Koehl P, Levitt M, Brenner SE. The ASTRAL compendium in 2004. Nucleic Acids Res. 2004;32:D189–D192. doi: 10.1093/nar/gkh034. [DOI] [PMC free article] [PubMed] [Google Scholar]
- 25.Murzin AG, Brenner SE, Hubbard T, Chothia C. SCOP: a structural classification of proteins database for the investigation of sequences and structures. J. Mol. Biol. 1995;247:536–540. doi: 10.1006/jmbi.1995.0159. [DOI] [PubMed] [Google Scholar]
- 26.Brenner SE, Chothia C, Hubbard TJ. Assessing sequence comparison methods with reliable structurally identifieddistant evolutionary relationships. Proc. Natl Acad. Sci. USA. 1998;95:6073–6078. doi: 10.1073/pnas.95.11.6073. [DOI] [PMC free article] [PubMed] [Google Scholar]
- 27.Wheeler DL, Barrett T, Benson DA, Bryant SH, Canese K, Chetvernin V, Church DM, DiCuccio M, Edgar R, Federhen S. Database resources of the National Centerfor Biotechnology Information. Nucleic Acids Res. 2008;36:D13–D21. doi: 10.1093/nar/gkm1000. [DOI] [PMC free article] [PubMed] [Google Scholar]
- 28.Gribskov M, Robinson NL. Use of receiver operating characteristic (ROC) analysis to evaluate sequence matching. Comput. Chem. 1996;20:25–33. doi: 10.1016/s0097-8485(96)80004-0. [DOI] [PubMed] [Google Scholar]
- 29.Lawrence CE, Altschul SF, Boguski MS, Liu JS, Neuwald AF, Wootton JC. Detecting subtle sequence signals: A Gibbs sampling strategy for multiple alignment. Science. 1993;262:208–214. doi: 10.1126/science.8211139. [DOI] [PubMed] [Google Scholar]
- 30.Grünwald PD. Minimum description length tutorial. In: Grünwald PD, Myung IJ, Pitt MA, editors. Advances in Minimum Description Length: Theory and Applications. MA: MIT Press Cambridge; 2005. pp. 23–79. [Google Scholar]
- 31.Cover TM, Thomas JA. Elements of Information Theory. New York: Wiley; 1991. [Google Scholar]
- 32.Fisher RA. Theory of statistical estimation. Proc. Cambridge Phil. Soc. 1925;22:700–725. [Google Scholar]
- 33.Schäffer AA, Wolf YI, Ponting CP, Koonin EV, Aravind L, Altschul SF. IMPALA: Matching a protein sequence against a collection of PSI-BLAST-constructed position-specific score matrices. Bioinformatics. 1999;15:1000–1011. doi: 10.1093/bioinformatics/15.12.1000. [DOI] [PubMed] [Google Scholar]
- 34.Boeckmann B, Bairoch A, Apweiller R, Blatter M-C, Estreicher A, Gasteiger E, Martin MJ, Michoud K, O'Donovan C, Phan I, Pilbout S, Schneider M. The SWISS-PROT protein knowledgebase and its supplement TrEMBL in 2003. Nucleic Acids Res. 2003;31:365–370. doi: 10.1093/nar/gkg095. [DOI] [PMC free article] [PubMed] [Google Scholar]
- 35.Nishida K, Frith MC, Nakai K. Nucleic Acids Res. 2008. Pseudocounts for transcription factor binding sites. (in press). [DOI] [PMC free article] [PubMed] [Google Scholar]
Associated Data
This section collects any data citations, data availability statements, or supplementary materials included in this article.