

Abstract
Background
In a transgenic mouse model of Alzheimer disease (AD), cleavage of the amyloid precursor protein (APP) by the α-secretase ADAM10 prevented amyloid plaque formation, and alleviated cognitive deficits. Furthermore, ADAM10 overexpression increased the cortical synaptogenesis. These results suggest that upregulation of ADAM10 in the brain has beneficial effects on AD pathology.
Results
To assess the influence of ADAM10 on the gene expression profile in the brain, we performed a microarray analysis using RNA isolated from brains of five months old mice overexpressing either the α-secretase ADAM10, or a dominant-negative mutant (dn) of this enzyme. As compared to non-transgenic wild-type mice, in ADAM10 transgenic mice 355 genes, and in dnADAM10 mice 143 genes were found to be differentially expressed. A higher number of genes was differentially regulated in double-transgenic mouse strains additionally expressing the human APP[V717I] mutant.
Overexpression of proteolytically active ADAM10 affected several physiological pathways, such as cell communication, nervous system development, neuron projection as well as synaptic transmission. Although ADAM10 has been implicated in Notch and β-catenin signaling, no significant changes in the respective target genes were observed in adult ADAM10 transgenic mice.
Real-time RT-PCR confirmed a downregulation of genes coding for the inflammation-associated proteins S100a8 and S100a9 induced by moderate ADAM10 overexpression. Overexpression of the dominant-negative form dnADAM10 led to a significant increase in the expression of the fatty acid-binding protein Fabp7, which also has been found in higher amounts in brains of Down syndrome patients.
Conclusion
In general, there was only a moderate alteration of gene expression in ADAM10 overexpressing mice. Genes coding for pro-inflammatory or pro-apoptotic proteins were not over-represented among differentially regulated genes. Even a decrease of inflammation markers was observed. These results are further supportive for the strategy to treat AD by increasing the α-secretase activity.
Background
Accumulation of amyloid β-peptides (Aβ) in the brain is believed to contribute to the development of Alzheimer disease (AD). Soluble oligomeric forms of Aβ are neurotoxic [1-3]. Aβ, a 40–43 amino acid-comprising proteolytical fragment of the amyloid precursor protein (APP), is released from APP by sequential cleavages via β- and γ-secretases. However, the predominant route of APP processing consists of successive cleavages by α- and γ-secretases. Alpha-secretase attacks APP inside the Aβ sequence, and therefore prevents formation of neurotoxic Aβ. In addition, the soluble N-terminal domain of APP (APPsα) is released, which has neurotrophic and neuroprotective properties [4,5], and enhances LTP [6]. In behavioral paradigms, APPsα was demonstrated to improve memory in normal and amnesic mice [7]. Reduced amounts of APPsα were detected in the cerebrospinal fluid of AD patients [8,9].
Proteinases of the ADAM (adisintegrin and metalloproteinase) family are main candidates for physiologically relevant α-secretases, and we demonstrated that ADAM10 has α-secretase activity in vitro and in cultured cells [10]. ADAM10-deficient mice have been generated [11], but their early lethality at day E9.5 prevents a reliable analysis of ADAM10's α-secretase function in vivo, especially in neuronal cells.
To investigate whether an increase in activity of putative α-secretases in vivo prevents plaque formation and cognitive deficits, we generated transgenic mice overexpressing either the α-secretase ADAM10 (ADAM10 mice) or the catalytically inactive ADAM10[E384A] mutant (dnADAM10 mice) [12]. Neuronal overexpression of ADAM10 had no detrimental effects on ADAM10 single-transgenic mice: these animals exhibited normal behavioral abilities [13]. We found that a moderate neuronal overexpression of ADAM10 in mice carrying the human APP[V717I] mutation (ADAM10/APP[V717I] mice) increased the secretion of APPsα, reduced the formation of Aβ peptides, and prevented their deposition in plaques. Functionally, impaired long-term potentiation and cognitive deficits were alleviated. Expression of dominant-negative ADAM10 [E384A] in APP[V717I] mice (dnADAM10/APP[V717I] mice) led to reduction of APPsα and to enhancement of the number and size of amyloid plaques in the brain [12].
Histological analyses of mono-transgenic ADAM10 mice revealed an increase in cortical cholinergic, glutamatergic and GABAergic presynaptic bouton densities in 8 months old mice; the cholinergic presynaptic bouton density remained elevated even during aging in ADAM10 mice [14].
In addition to their metalloproteinase domain, ADAMs contain a disintegrin domain as a modulator of cell-cell and cell-matrix interactions [15]. As ADAM10 itself has been reported to be a substrate for ectodomain shedding by ADAM9 and subsequent cleavage by γ-secretase, the C-terminus of ADAM10 may represent a Notch-like signaling molecule [16]. Thus, independent of the catalytic activity of ADAM10, which has been implicated in Notch and β-catenin signaling, ADAM10 may also modulate gene expression via other domains.
To analyze the influence of ADAM10 and its dominant-negative form (dnADAM10) on the gene expression profile of the central nervous system (CNS), we investigated ADAM10 and dnADAM10 mice. We included in our study the double-transgenics ADAM10/APP[V717I] and dnADAM10/APP[V717I]. Since APP[V717I] mice show early phenotype changes (between months 4 and 7), we investigated the gene expression in 5 months old mice.
Methods
Animals
Animal husbandry was performed in accord with the guidelines of the German Council on Animal Care. All mouse strains (strain background FVB/N) analyzed in this study have been described previously [12]. The expression level of transgenic mature ADAM10 is 30% above endogenous levels and in dnADAM10 mice the expression of the catalytically inactive ADAM10 mutant is sevenfold above endogenous ADAM10 [12]. ADAM10 activity was determined in previous studies [12,17] by quantitation of the APP cleavage product APPsα. In ADAM10 overexpressing mice the catalytic activity of ADAM10 against its substrate APP[V717I] was increased to about 250%. In mice overexpressing dnADAM10, the endogenous APP[V717I] cleavage activity was reduced to about 25% as compared to APP[V717I] mice [12].
For the first experimental series of the present study, female ADAM10, dnADAM10 and FVB/N wild-type mice were investigated; for the second series, female and male ADAM10/APP[V717I], dnADAM10/APP[V717I] and APP[V717I] mice were compared. In each case, brains of three 5 months old animals of each group were dissected and stored in RNA-later (Qiagen, Hilden, Germany) at -80°C to prevent RNA degradation.
RNA preparation and microarray analyses
Total RNA from whole mouse brains was isolated by using the RNeasy Kit (Qiagen, Hilden, Germany), including on-column DNase I digestion according to the manufacturer's recommendations. The quality of isolated RNA was controlled by the Lab-on-Chip-System Bioanalyser 2100 (Agilent Technologies Inc., Palo Alto, CA, USA).
The expression-profiling analysis for mono-transgenic mice (ADAM10, dnADAM10 mice and non-transgenic FVB/N control animals) was carried out at RZPD (Berlin, Germany). Samples from double-transgenic mice (ADAM10/APP[V717I, dnADAM10/APP[V717I] and mono-transgenic APP[V717I] control mice) were analyzed at the Microarray Facility (Tübingen, Germany). In all cases, the Mouse Genome 430 2.0 Array (Affymetrix, Santa Clara, CA, USA) containing 45000 probe sets of 34000 genes was used for mRNA expression profiling.
Statistical analysis and gene annotations
For the first series (mono-transgenic mice) 9 gene chip arrays and for the second series (double-transgenic mice) 18 gene chip arrays were analyzed. Data mining was performed by using the ChipInspector analysis software (Genomatix, Munich, Germany), which identifies significant changes based on single probes. The corresponding transcripts were then assigned after a user-defined number of significant probes. For all analyses, a transcript coverage greater than three probes was chosen. By this strategy, annotation errors and errors caused by the existence of alternative transcripts are reduced.
After total intensity normalization of each array, significantly changed genes were determined by significance analysis of microarrays (SAM) [18], using the exhaustive comparison mode at a false discovery rate (FDR) of 0.0% for double-transgenic, and 0.5% for mono-transgenic mice. For separate analysis of samples from double-transgenic female and male mice, a FDR of 1.3% was chosen. The resulting gene lists were restricted to the 600 most strongly regulated genes (up- as well as downregulated genes).
Regulated genes were then analyzed with the Bibliosphere software (Version 5.02; Genomatix, Munich, Germany) and mapped to Gene Ontology (GO) trees in order to identify their biological function. For identification of over-represented GO terms, the Bibliosphere software calculates a z-score for each term. The z-score represents the difference between observed and expected annotations, and is normalized to the standard deviation of a hypergeometric distribution. Only GO terms with a z-score > 1.96, which corresponds to a p-value of 0.05, have been considered.
To identify transcripts which are affected by ADAM10 and dnADAM10 overexpression in mono- and double-transgenic mice, we generated Venn diagrams with SAM-based gene lists. The expression profile of selected significantly regulated genes from microarrays was represented by heat maps using the R statistical software http://www.r-project.org. Hierarchical clustering was applied to investigate whether expression values can be separated according to experimental groups. In this study, two heat maps were generated: one compared the expression profiles of genes in ADAM10 and dnADAM10 mono-transgenic mice, as well as in FVB/N non-transgenic control mice; a second one compared the expression profiles of double-transgenics and APP[V717I] mice.
Because the two series of expression arrays were measured in different laboratories, a global normalization procedure was needed to make them comparable. The default background noise adjustment, provided by the Affymetrix system, is based on the difference of perfect matching probes (PM) minus mismatching probes (MM). Due to unspecific binding, the global background adjustment method robust multi-array average (RMA) expression measure, which ignores the MM intensities, has been developed [19]. Because RMA adjustment does not completely remove unspecific intensities [20], an enhanced method denoted GeneChip RMA (GCRMA) has been designed [21] which considers the sequence of probes.
We performed background adjustment as well as quantile normalization for all data sets (raw format, cell files) with the GCRMA method (standard settings) by using the CARMAweb interface [22]. Subsequently, an unpaired two-tailed Student's t-test was applied for each respective gene to determine whether it is differentially expressed in the two sample groups. Since microarray analysis operates with large numbers of multiple comparisons, a false discovery rate-controlling method has to be applied. Therefore, by using the Benjamini-Hochberg (BH) method, adjusted p-values were calculated [23].
The GCRMA method is also appropriate for detection of minor changes in gene expression, and was required for comparative analysis of mono- and double-transgenic mice, due to the low intensities of the microarrays from the first series (mono-transgenic mice) as compared to those of the second series (double-transgenic mice). By comparing data derived from mono- and double-transgenic mice, we analyzed global biological trends of ADAM10 and dnADAM10 overexpression in FVB/N and FVB/N APP[V717I] strain backgrounds.
To identify transcripts which were commonly affected by APP[V717I]overexpression in all double-transgenic mice, we generated a Venn diagram with GCRMA-based gene lists (BH<0.005).
Quantitative real-time RT-PCR
A two-step real-time reverse transcription (RT)-PCR was used to measure the expression of candidate genes. Isolated total RNA (1 μg) was used to synthesize cDNA in a 20 μl reaction with the QuantiTect Reverse Transcription Kit (Qiagen, Hilden, Germany) according to the manufacturer's manual. By adding water, the reaction volume was subsequently increased to 500 μl. Real-time RT-PCR was carried out in 96-well plates, using the 7000 ABI prism sequence detection system (Applied Biosystems, Darmstadt, Germany) and QuantiTect Primer Assays (Qiagen, Hilden, Germany). The primers for selected candidate genes are listed in table 1.
Table 1.
QuantiTect Primer Assays (Qiagen, Hilden, Germany)
| Gene name | Gene ID | Assay |
| ADAM10 | 11487 | Mm_Adam10_1_SG |
| Fatty acid binding protein 7 | 12140 | Mm_Fabp7_1_SG |
| Calcium binding protein S100a9 | 20202 | Mm_S100a9_1_SG |
| Calcium binding protein S100a8 | 20201 | Mm_S100a8_1_SG |
| Glutamate receptor, ionotropic, AMPA1 | 14799 | Mm_Gria_1_SG |
| Glutamate receptor, ionotropic, AMPA2 | 14800 | Mm_Gria2_1_SG |
| Low density lipoprotein receptor-related protein 1 | 16971 | Mm_Lrp1_1_SG |
| Very low density lipoprotein receptor | 22359 | Mm_Vldlr_1_SG |
| Microtubule-associated protein tau | 17762 | Mm_Mapt_1_SG |
| Neuroligin 1 | 192167 | Mm_Nlgn1_1_SG |
| GAPDH | 14433 | Mm_Gapdh_2_SG |
Real-time RT-PCR reactions in a volume of 30 μl were performed in duplicate or triplicate under the following conditions: 5 μl of diluted cDNA (see above), 15 μl 2× QuantiTect PCR master mix (Qiagen, Hilden, Germany) and 300 nM of respective primer pair. After the initial denaturing and enzyme activation step (95°C for 15 min), 40 cycles (94°C for 15s, 55°C for 30s, and 72°C for 30s) were performed. A single DNA melting profile was observed in dissociation assay conditions demonstrating amplification of a unique product free of primer dimers.
For detection of Hes5 in 15 day old mice a one step Real-time RT-PCR was performed using the QuantiTect-SYBR-Green One-Step-RT PCR-Kit (Qiagen, Hilden, Germany) and 250 ng RNA in a reaction volume of 30 μl. The specific primer pair was as follows: Hes5RT_for 5'GAAAAACCGACTGCGGAAGCC3' and Hes5RT_rev 5'ACGGCCATCTCCAGGATGTC3'.
For data analysis, the threshold cycle (Ct) which indicates the relative abundance of a particular transcript, was calculated. Standard curves were generated by amplification of serially diluted cDNA. According to this method, the amount of all relevant genes was normalized to the amount of endogenous GAPDH present in the same sample. Measured values from control samples (non-transgenic FVB/N mice or mono-transgenic APP[V717I] mice) were set to 100%. Changes in gene expression are presented as the mean of alteration ± SD. The data were analyzed for statistical significance using one-way ANOVA (*, p < 0.05; **, p < 0.01; ***, p < 0.001).
Western blotting
Mouse brain tissue was stored on dry ice immediately after dissection. Ice-cold TRIS buffer (20 mM Tris/HCl, pH 8.5) containing proteinase inhibitors (Inhibitor complete mini, Roche Diagnostics Corp., Mannheim, Germany) was added, and tissue was homogenized in a tissue lyser (Qiagen, Hilden, Germany). The supernatants resulting from centrifugation at 34000 rpm for 1.75 hours were separated on 14% SDS-gels and transferred to nitrocellulose membrane by tank blot system (40 μg protein per sample). For the detection and quantification of soluble FABP7 antibody AB9558 (Chemicon, Temecula, USA), and the appropriate horseradish peroxidase-coupled secondary antibody (Pierce, Rockford, USA) were used.
ELISA
Hemispheres of mouse brain were weighed, proteins extracted and calprotectin (S100a8/a9) was quantified as recommended by the ELISA manufacturer (Immundiagnostik, Bensheim, Germany). In brief, tissue was homogenized in extraction buffer for 2 min at 20 Hz in a tissue lyzer and extraction was performed for 20 min at 4°C under agitation. After centrifugation (14000 rpm, 15 min) the supernatant and protein standards were added to microtiter plates in a total volume of 100 μl in duplicates. Incubation of the plate and measurement of optical densities at 405 nm were performed following the manufacturer's instructions. The relative amount of calprotectin was calculated by division of background-corrected values by wet tissue weight.
Results
Microarray analysis of gene regulation in ADAM10-transgenic mice
We performed microarray analysis with cDNA transcribed from total RNA of the brains of mice aged five months. Mono-transgenic ADAM10 as well as dnADAM10 mice were investigated in comparison to non-transgenic FVB/N wild-type mice (n = 3 females), to analyze the influence of the α-secretase ADAM10 or its catalytically inactive form (dnADAM10) on the gene expression profile of the CNS.
To elucidate the effect of ADAM10 and dnADAM10 on gene expression in an APP background, we compared samples derived from double-transgenic ADAM10/APP[V717I] and dnADAM10/APP[V717I] mice with those from mono-transgenic APP[V717I] mice. Because we wanted to test whether the modulation of ADAM10 activity might be a risk to the adult organism in respect to future therapeutic approaches, we chose 5 months old mice for our investigations. At this age, APP[V717I] animals show cognitive deficits, whereas amyloid plaque formation occurs several months later [24].
The SAM plots in Fig. 1 represent the distribution of all probe signals on the microarray chip. Depending on the statistical stringency (FDR, delta) as represented by the red lines, significant probes are selected. Probe signals between the red lines are not significant, signals above the upper line correspond to significantly upregulated genes; signals below the lower line correspond to significantly downregulated genes. Tables 2 and 3 show the numbers of these differentially expressed genes.
Figure 1.

Significance analysis of microarrays. The SAM plots represent the differentially expressed genes of mono-transgenic (A and B with FDR 0.5), and double-transgenic mice (C and D with FDR 0.0). The Delta parameter, represented by red lines, defines the significance field (-1.72/+2.23 (A: ADAM10 versus FVB/N), -1.36/+1.43 (B: dnADAM10 versus FVB/N), -1.56/+2.06 (C: ADAM10/APP[V717I] versus APP[V717I]), -2.85/+3.29 (D: dnADAM10/APP[V717I] versus APP[V717I])). Shown above the upper line are the genes upregulated significantly, and below the lower line the genes downregulated significantly.
Table 2.
Numbers of significantly regulated genes in mono-transgenic mice (5 months, 3 females per group) restricted by the given d-values.
| Mouse Genome 430 2.0 Array (Affymetrix) | |||
| 45 000 probe sets, 39 000 transcripts, 34 000 characterized | |||
| ADAM10 versus FVB/N (wild-type) 355 genes, FDR = 0.5% |
dnADAM10 versus FVB/N (wild-type) 143 genes, FDR = 0.5% |
||
| 300 upregulated (d-value > 2.23) |
55 downregulated (d-value < -1.72) |
50 upregulated (d-value > 1.43) |
93 downregulated (d-value < -1.36) |
Table 3.
Numbers of significantly regulated genes in double-transgenic mice (5 months, 3 females and 3 males per group) restricted by the given d-values.
| Mouse Genome 430 2.0 Array (Affymetrix) | |||
| 45 000 probe sets, 39 000 transcripts, 34 000 characterized | |||
| ADAM10/APP[V717I] versus APP[V717I] 592 genes, FDR = 0.0% |
dnADAM10/APP[V717I] versus APP[V717I] 600 genes, FDR = 0.0% |
||
| 295 upregulated (d-value > 2.06) |
297 downregulated (d-value < -1.56) |
300 upregulated (d-value > 3.29) |
300 downregulated (d-value < -2.85) |
The comparison of samples from ADAM10 and FVB/N mice revealed 355 differentially expressed genes: 300 genes were up- and 55 genes were downregulated. In dnADAM10 mice, the number of regulated genes was lower; as compared to FVB/N mice, 143 genes were differentially expressed. Among these, 50 genes were up- and 93 genes downregulated (Tab. 2).
Against the background of APP[V717I] overexpression, generally more genes were found to be differentially expressed. As compared to APP[V717I] mice, 592 genes (295 up- and 297 downregulated) were differentially expressed in ADAM10/APP[V717I] mice, and more than 600 genes in dnADAM10/APP[V717I] animals (Tab. 3). In the latter, the number of significantly regulated genes was restricted to 600, including the highest up- and downregulated genes. For the complete list of significantly regulated genes, see Additional file 1, Tables S1-S4. The data presented in this publication have been deposited in NCBI's Gene Expression Omnibus (GEO), and are accessible by the GEO Series accession numbers GSE10908 and GPL1261 http://www.ncbi.nlm.nih.gov/geo/info/faq.html#deposit.
For detection of transcripts that were commonly regulated by either ADAM10 or dnADAM10 overexpression in mono- and double-transgenic mice, Venn diagrams were generated with SAM-based gene lists (Fig. 2). The comparison of ADAM10 versus FVB/N (355 genes), and ADAM10/APP[V717I] versus APP[V717I] (592 genes) revealed 29 genes which were regulated by ADAM10 overexpression in either mono- or double-transgenic mice (Additional file 1, Tab. S5). When dnADAM10 versus FVB/N (143 genes) and dnADAM10/APP[V717I] versus APP[V717I], were compared, only eight genes were identified to be commonly regulated by dnADAM10 overexpression (Additional file 1, Tab. S6). This result indicates that the genetic background strongly influences the effect of ADAM10 on gene expression.
Figure 2.

Venn diagrams with SAM-based gene lists of mono- and double-transgenic mice. Venn diagram I (ADAM10 versus FVB/N (A) is compared with ADAM10/APP[V717I] versus APP[V717I] (B)), and Venn diagram II (dnADAM10 versus FVB/N (A) is compared with dnADAM10/APP[V717I] versus APP[V717I] (B)), generated by a custom-written Perl-script, show the effects of the overexpression of ADAM10 and dnADAM10 in mono- and double-transgenic mice. The numbers in the space of overlapping circles represent the number of transcripts that were affected in both mouse lines.
Common genetic profile in mono- and double-transgenic animals
Heat maps (Fig. 3) indicate that the chips of each series had their own characteristic genetic profile. For heat maps, genes of special interest were chosen (mono-transgenic mice: Adam10, Fabp7, S100a8, S100a9, Nlgn1; double-transgenic mice: Mapt, Gria1, Vldlr, Lrp1, Bace1, Psen1, Psen2, ApoE). The heat map in Fig. 3A reveals that in mice overexpressing bovine ADAM10, approximately the same amount of murine Adam10 is expressed as compared to wild-type mice (nearly all over yellow coloring). Fabp7 is distinctly higher expressed in all dnADAM10 mice (red color) in contrast to wild-type mice (orange color). The expression of Nlgn1 in ADAM10 and dnADAM10 mice is higher (yellow to green) than in FVB/N mice (green color)). Finally, S100a8 and S100a9 show lower expression in ADAM10 and dnADAM10 mice (blue color) in relation to FVB/N wild-type mice (yellow to blue). These results are in accordance with the observations made by the real-time RT-PCR as described below. Furthermore, hierarchical clustering showed that the expression profiles of the mono-transgenic mouse genes are separated to the original conditions. In the case of heat map in Fig. 3B, the small differences in the expression of Mapt, Gria1, Vldlr and Lrp1 are fitting to the results of real-time RT-PCR analyses as described below. Hierarchical clustering revealed that the expression profiles of double-transgenic mice genes are not clearly clustered according to the experimental settings, presumably due to the more complex conditions caused by APP overexpression. Also, a clear distinction between male and female mice could not be observed.
Figure 3.

Heat map representing the clustering of genes in mono- and double transgenic mice. A) ADAM10, dnADAM10 and FVB/N mice; B) AD10/APP[V717I], dnAD10/APP[V717I], and APP[V717I] mice. Selected significantly regulated genes on individual chips are shown. The upper graph (I) represents the hierarchical clustering, the colored scales (II) the difference in gene expression. Unsupervised cluster analysis showed that the expression profiles of mono-transgenic mouse genes (A) cluster according to the experimental conditions. In case of double-transgenic mice (B), cluster analysis revealed a more rough agreement in the discrimination of gene expression with experimental groups. The blue (lower expression) to red (higher expression) color scale indicates 2-based logarithms of the mean expression values of the single probes after ChipInspector normalization (Genomatix, Munich, Germany).
ADAM10-regulated biological pathways
For pathway analysis, the complete gene lists were analyzed with the Bibliosphere software (Genomatix) and mapped to Gene Ontology (GO) trees.
Functional groups are only listed when their z-score of individual GO-categories is higher than 1.96. With respect to the known cellular function of disintegrin metalloproteases in general, and the α-secretase activity of ADAM10 in particular, we investigated biological processes including cell communication (GO:0007154), nervous system development (GO:0007399), cell adhesion (GO:0007155) and cell death (GO:0008219). Furthermore, we examined neuron projection (GO:0043005), synaptic junction (GO:0045202) and transmission (GO:0007268). At the molecular level, we focused on receptor binding (GO:0005102) and receptor activity (GO:0004872) (Tab. 4, 5, 6, 7).
Table 4.
Significantly regulated genes in mono-transgenic ADAM10 mice in relation to FVB/N wild-type mice
| Gene ID | Gene symbol | Description | Fold change | log ratio | d-value | Functional groups |
| 27360 | Add3 | adducin 3 (gamma) | 1.519 | 0.603 | 2.841 | receptor binding and activity |
| 68465 | Adipor2 | adiponectin receptor 2 | 1.365 | 0.449 | 2.294 | cell communication |
| 11658 | Alcam | activated leukocyte cell adhesion molecule | 1.471 | 0.557 | 2.298 | nervous system development; neuron projection |
| 211673 | Arfgef1 | ADP-ribosylation factor guanine nucleotide-exchange factor 1(brefeldin A-inhibited) | 1.503 | 0.588 | 2.644 | cell communication |
| 11855 | Arhgap5 | Rho GTPase activating protein 5 | 1.621 | 0.697 | 2.526 | cell communication |
| 98660 | Atp1a2 | ATPase, Na+/K+ transporting, alpha 2 polypeptide | 0.792 | -0.337 | -1.972 | cell communication; synapse |
| 11941 | Atp2b2 | ATPase, Ca++ transporting, plasma membrane 2 | 1.734 | 0.794 | 2.717 | cell communication; nervous system development; receptor binding and activity; synapse |
| 22589 | Atrx | alpha thalassemia/mental retardation syndrome X-linked homolog (human) | 1.507 | 0.592 | 2.876 | nervous system development |
| 30948 | Bin1 | bridging integrator 1 | 1.451 | 0.537 | 2.318 | cell communication; synapse |
| 12298 | Cacnb4 | calcium channel, voltage-dependent, beta 4 subunit | 1.800 | 0.848 | 2.913 | cell communication; synapse |
| 12322 | Camk2a | calcium/calmodulin-dependent protein kinase II alpha | 1.779 | 0.831 | 2.547 | cell communication; receptor binding and activity; synapse |
| 16149 | Cd74 | CD74 antigen (invariant polypeptide of major histocompatibility complex, class II antigen-associated) | 0.724 | -0.466 | -2.270 | cell communication; cell death |
| 212285 | Centd1 | centaurin, delta 1 | 1.569 | 0.650 | 2.530 | cell communication |
| 12633 | Cflar | CASP8 and FADD-like apoptosis regulator | 1.393 | 0.478 | 2.497 | cell death |
| 12704 | Cit | citron | 1.476 | 0.562 | 2.405 | cell communication; nervous system development |
| 12803 | Cntf | ciliary neurotrophic factor | 1.496 | 0.581 | 2.355 | cell communication; nervous system development |
| 70086 | Cysltr2 | cysteinyl leukotriene receptor 2 | 1.307 | 0.386 | 2.251 | cell communication |
| 13618 | Ednrb | endothelin receptor type B | 1.364 | 0.448 | 2.506 | cell communication; nervous system development |
| 13838 | Epha4 | Eph receptor A4 | 1.622 | 0.698 | 2.439 | cell communication; nervous system development |
| 67456 | Ergic2 | ERGIC and golgi 2 | 1.367 | 0.451 | 2.316 | cell communication; synapse |
| 14397 | Gabra4 | gamma-aminobutyric acid (GABA-A) receptor, subunit alpha 4 | 1.542 | 0.625 | 2.316 | cell communication; synapse |
| 14417 | Gad2 | glutamic acid decarboxylase 2 | 1.636 | 0.710 | 3.290 | cell communication; neuron projection; synapse |
| 14674 | Gna13 | guanine nucleotide binding protein, alpha 13 | 1.502 | 0.587 | 2.257 | cell communication |
| 14677 | Gnai1 | guanine nucleotide binding protein, alpha inhibiting 1 | 1.576 | 0.656 | 2.911 | cell communication |
| 14680 | Gnal | guanine nucleotide binding protein, alpha stimulating, olfactory type | 1.598 | 0.676 | 3.061 | cell communication |
| 53623 | Gria3 | glutamate receptor, ionotropic, AMPA3 (alpha 3) | 1.480 | 0.566 | 2.388 | synapse |
| 56637 | Gsk3b | glycogen synthase kinase 3 beta | 1.540 | 0.623 | 2.382 | cell communication; cell death |
| 15208 | Hes5 | hairy and enhancer of split 5 (Drosophila) | 0.749 | -0.416 | -1.800 | nervous system development |
| 16419 | Itgb5 | integrin beta 5 | 0.786 | -0.347 | -2.185 | cell adhesion; cell communication |
| 16510 | Kcnh1 | potassium voltage-gated channel, subfamily H (eag-related), member 1 | 1.398 | 0.483 | 2.291 | cell communication; receptor binding and activity |
| 16561 | Kif1b | kinesin family member 1B | 1.555 | 0.637 | 2.573 | cell communication; synapse |
| 16573 | Kif5b | kinesin family member 5B | 1.904 | 0.929 | 3.186 | neuron projection; synapse |
| 16574 | Kif5c | kinesin family member 5C | 1.656 | 0.728 | 2.463 | nervous system development; neuron projection; synapse |
| 110829 | Lims1 | LIM and senescent cell antigen-like domains 1 | 1.533 | 0.616 | 2.309 | cell adhesion |
| 108030 | Lin7a | lin-7 homolog A (C. elegans) | 1.346 | 0.429 | 2.260 | cell communication; synapse |
| 319387 | Lphn3 | latrophilin 3 | 1.295 | 0.373 | 2.344 | cell communication |
| 16971 | Lrp1 | low density lipoprotein receptor-related protein 1 | 0.707 | -0.500 | -2.139 | cell communication |
| 16998 | Ltbp3 | latent transforming growth factor beta binding protein 3 | 0.791 | -0.338 | -2.180 | cell communication; receptor binding and activity |
| 50791 | Magi2 | membrane associated guanylate kinase, WW and PDZ domain containing 2 | 1.426 | 0.512 | 2.399 | cell communication |
| 192167 | Nlgn1 | neuroligin 1 | 1.518 | 0.602 | 2.386 | cell communication; nervous system development; synapse |
| 18549 | Pcsk2 | proprotein convertase subtilisin/kexin type 2 | 1.492 | 0.577 | 2.393 | nervous system development |
| 18573 | Pde1a | phosphodiesterase 1A, calmodulin-dependent | 1.796 | 0.845 | 3.130 | cell communication; receptor binding and activity |
| 18596 | Pdgfrb | platelet derived growth factor receptor, beta polypeptide | 0.800 | -0.322 | -1.867 | cell communication |
| 18613 | Pecam1 | platelet/endothelial cell adhesion molecule 1 | 0.778 | -0.363 | -2.093 | cell communication |
| 18795 | Plcb1 | phospholipase C, beta 1 | 1.652 | 0.724 | 3.345 | cell communication |
| 18798 | Plcb4 | phospholipase C, beta 4 | 1.480 | 0.566 | 2.451 | cell communication |
| 242083 | Ppm1l | protein phosphatase 1 (formerly 2C)-like | 1.604 | 0.682 | 2.277 | cell communication |
| 26932 | Ppp2r5e | protein phosphatase 2, regulatory subunit B (B56), epsilon isoform | 1.578 | 0.658 | 2.298 | cell communication |
| 19281 | Ptprt | protein tyrosine phosphatase, receptor type, T | 1.409 | 0.495 | 2.354 | cell communication |
| 19328 | Rab12 | RAB12, member RAS oncogene family | 1.250 | 0.322 | 2.259 | cell communication |
| 270192 | Rab6b | RAB6B, member RAS oncogene family | 1.696 | 0.762 | 2.837 | cell communication; synapse |
| 56044 | Rala | v-ral simian leukemia viral oncogene homolog A (ras related) | 1.582 | 0.662 | 2.544 | cell communication |
| 54409 | Ramp2 | receptor (calcitonin) activity modifying protein 2 | 1.693 | 0.760 | 2.640 | cell communication |
| 218397 | Rasa1 | RAS p21 protein activator 1 | 1.428 | 0.514 | 2.266 | cell adhesion; cell communication; cell death |
| 19737 | Rgs5 | regulator of G-protein signaling 5 | 1.677 | 0.746 | 2.390 | cell communication |
| 19894 | Rph3a | rabphilin 3A | 1.470 | 0.556 | 2.352 | synapse |
| 68585 | Rtn4 | reticulon 4 | 1.542 | 0.625 | 2.344 | cell death; nervous system development |
| 20202 | S100a9 | S100 calcium binding protein A9 | 0.668 | -0.582 | -2.146 | cell communication |
| 20377 | Sfrp1 | secreted frizzled-related sequence protein 1 | 0.793 | -0.335 | -1.730 | cell communication |
| 239250 | Slitrk6 | SLIT and NTRK-like family, member 6 | 1.324 | 0.405 | 2.293 | nervous system development |
| 93761 | Smarca1 | SWI/SNF related, matrix associated, actin dependent regulator of chromatin, subfamily a, member 1 | 1.309 | 0.388 | 2.351 | nervous system development |
| 66042 | Sostdc1 | sclerostin domain containing 1 | 0.725 | -0.464 | -1.768 | cell communication |
| 20742 | Spnb2 | spectrin beta 2 | 1.729 | 0.790 | 2.855 | cell communication; receptor binding and activity |
| 114716 | Spred2 | sprouty-related, EVH1 domain containing 2 | 1.514 | 0.598 | 2.653 | cell communication |
| 21961 | Tns1 | tensin 1 | 1.505 | 0.590 | 2.245 | cell communication |
| 22370 | Vtn | vitronectin | 0.778 | -0.362 | -1.925 | cell adhesion |
| 22371 | Vwf | Von Willebrand factor homolog | 0.715 | -0.484 | -2.099 | cell adhesion |
| 57750 | Wdr12 | WD repeat domain 12 | 1.391 | 0.476 | 2.446 | cell communication |
| 232341 | Wnk1 | WNK lysine deficient protein kinase 1 | 1.844 | 0.883 | 2.947 | cell communication |
| 22772 | Zic2 | Zinc finger protein of the cerebellum 2 | 1.941 | 0.957 | 3.062 | nervous system development |
Table 5.
Significantly regulated genes in mono-transgenic dnADAM10 mice in relation to FVB/N wild-type mice
| Gene ID | Gene symbol | Description | Fold change | log ratio | d-value | Functional groups |
| 22589 | Atrx | alpha thalassemia/mental retardation syndrome X-linked homolog (human) | 1.392 | 0.477 | 1.533 | nervous system development |
| 109880 | Braf | Braf transforming gene | 0.568 | -0.815 | -5.060 | cell communication |
| 54598 | Calcrl | calcitonin receptor-like | 0.626 | -0.675 | -2.137 | cell communication |
| 12322 | Camk2a | calcium/calmodulin-dependent protein kinase II alpha | 0.686 | -0.544 | -2.523 | cell communication; receptor binding and activity; synapse |
| 12772 | Ccr2 | chemokine (C-C motif) receptor 2 | 0.724 | -0.465 | -1.783 | cell communication |
| 16149 | Cd74 | CD74 antigen (invariant polypeptide of major histocompatibility complex, class II antigen-associated) | 0.737 | -0.441 | -2.329 | cell communication; cell death |
| 13175 | Dcamkl1 | doublecortin and calcium/calmodulin-dependent protein kinase-like 1 | 1.501 | 0.586 | 1.610 | nervous system development |
| 12140 | Fabp7 | fatty acid-binding protein 7 | 1.691 | 0.758 | 2.107 | nervous system development |
| 14281 | Fos | FBJ osteosarcoma oncogene | 0.669 | -0.58 | -1.805 | nervous system development |
| 14417 | Gad2 | glutamic acid decarboxylase 2 | 1.422 | 0.508 | 1.683 | cell communication; neuron projection; synapse |
| 14674 | Gna13 | guanine nucleotide binding protein, alpha 13 | 1.353 | 0.436 | 1.639 | cell communication |
| 14682 | Gnaq | guanine nucleotide binding protein, alpha q polypeptide | 1.323 | 0.404 | 1.621 | cell communication; nervous system development; synapse |
| 15557 | Htr1f | 5-hydroxytryptamine (serotonin) receptor 1F | 1.363 | 0.447 | 1.539 | cell communication |
| 16594 | Klc2 | kinesin light chain 2 | 0.789 | -0.341 | -1.485 | neuron projection |
| 207911 | Mchr1 | melanin-concentrating hormone receptor 1 | 0.718 | -0.477 | -3.057 | cell communication |
| 17260 | Mef2c | myocyte enhancer factor 2C | 1.433 | 0.519 | 1.507 | nervous system development |
| 18823 | Plp1 | proteolipid protein (myelin) 1 | 1.358 | 0.442 | 1.565 | cell communication; nervous system development; |
| 19293 | Pvalb | parvalbumin | 0.847 | -0.24 | -1.493 | neuron projection |
| 19317 | Qk | quaking | 1.312 | 0.392 | 1.522 | cell communication; nervous system development |
| 54409 | Ramp2 | receptor (calcitonin) activity modifying protein 2 | 1.604 | 0.682 | 1.623 | cell communication |
| 19736 | Rgs4 | regulator of G-protein signaling 4 | 1.339 | 0.421 | 1.843 | cell communication |
| 20202 | S100a9 | S100 calcium binding protein A9 | 0.696 | -0.522 | -2.181 | cell communication |
Table 6.
Significantly regulated genes in double-transgenic ADAM10/APP[V717I] mice in relation to mono-transgenic APP[V717I] mice
| Gene ID | Gene symbol | Description | Fold change | log ratio | d-value | Functional groups |
| 56215 | Acin1 | apoptotic chromatin condensation inducer 1 | 0.795 | -0.331 | -1.955 | cell communication; cell death |
| 329910 | Acot11 | acyl-CoA thioesterase 11 | 0.812 | -0.301 | -1.620 | cell communication |
| 432530 | Adcy1 | adenylate cyclase 1 | 0.810 | -0.304 | -1.880 | cell communication; receptor binding and activity |
| 68465 | Adipor2 | adiponectin receptor 2 | 0.781 | -0.357 | -1.868 | cell communication |
| 11540 | Adora2a | adenosine A2a receptor | 1.294 | 0.372 | 2.210 | cell communication; synapse |
| 11735 | Ank3 | ankyrin 3, epithelial | 1.344 | 0.427 | 2.159 | cell communication; nervous system development; synapse |
| 11787 | Apbb2 | amyloid beta (A4) precursor protein-binding, family B, member 2 | 0.788 | -0.344 | -2.018 | cell communication; cell death; nervous system development |
| 226548 | Aph1a | anterior pharynx defective 1a homolog (C. elegans) | 0.807 | -0.309 | -1.879 | cell communication |
| 76117 | Arhgap15 | Rho GTPase activating protein 15 | 1.275 | 0.351 | 2.139 | cell communication |
| 76294 | Asb5 | ankyrin repeat and SOCs box-containing protein 5 | 1.254 | 0.327 | 2.079 | cell communication |
| 98660 | Atp1a2 | ATPase, Na+/K+ transporting, alpha 2 polypeptide | 0.820 | -0.287 | -1.746 | cell communication; synapse |
| 12043 | Bcl2 | B-cell leukemia/lymphoma 2 | 0.815 | -0.295 | -1.741 | cell communication; cell death |
| 72567 | Bclaf1 | BCL2-associated transcription factor 1 | 1.326 | 0.407 | 2.183 | cell death |
| 12122 | Bid | BH3 interacting domain death agonist | 1.291 | 0.369 | 2.278 | cell death |
| 109880 | Braf | Braf transforming gene | 0.812 | -0.301 | -1.837 | cell communication |
| 12227 | Btg2 | B-cell translocation gene 2, anti-proliferative | 1.342 | 0.424 | 2.357 | cell death |
| 12300 | Cacng2 | calcium channel, voltage-dependent, gamma subunit 2 | 0.803 | -0.316 | -1.872 | cell communication |
| 12325 | Camk2g | calcium/calmodulin-dependent protein kinase II gamma | 0.810 | -0.304 | -1.711 | receptor binding and activity |
| 12319 | Car8 | carbonic anhydrase 8 | 0.785 | -0.349 | -1.679 | cell communication |
| 12361 | Cask | calcium/calmodulin-dependent serine protein kinase (MAGUK family) | 0.832 | -0.265 | -1.689 | receptor binding and activity; synapse |
| 226751 | Cdc42bpa | Cdc42 binding protein kinase alpha | 1.288 | 0.365 | 2.130 | cell communication |
| 12575 | Cdkn1a | cyclin-dependent kinase inhibitor 1A (P21) | 0.779 | -0.36 | -2.004 | cell death |
| 235415 | Cplx3 | complexin 3 | 1.276 | 0.352 | 2.294 | cell communication; synapse |
| 12955 | Cryab | crystallin, alpha B | 0.744 | -0.427 | -2.161 | cell communication |
| 12977 | Csf1 | colony stimulating factor 1 (macrophage) | 0.822 | -0.282 | -1.717 | cell adhesion; cell communication; receptor binding and activity |
| 27373 | Csnk1e | casein kinase 1, epsilon | 0.791 | -0.338 | -2.160 | cell communication |
| 13000 | Csnk2a2 | casein kinase 2, alpha prime polypeptide | 0.801 | -0.321 | -1.909 | cell communication |
| 16007 | Cyr61 | cysteine rich protein 61 | 1.298 | 0.376 | 2.213 | receptor binding and activity |
| 54722 | Dfna5h | deafness, autosomal dominant 5 homolog (human) | 0.803 | -0.316 | -1.714 | cell communication |
| 330938 | Dixdc1 | DIX domain containing 1 | 0.825 | -0.278 | -1.770 | cell communication |
| 50768 | Dlc1 | deleted in liver cancer 1 | 0.794 | -0.332 | -1.894 | cell communication |
| 13430 | Dnm2 | dynamin 2 | 0.815 | -0.295 | -2.004 | synapse |
| 13527 | Dtna | dystrobrevin alpha | 1.271 | 0.346 | 2.240 | synapse |
| 13841 | Epha7 | Eph receptor A7 | 1.300 | 0.379 | 2.146 | cell communication; nervous system development |
| 14254 | Flt1 | FMS-like tyrosine kinase 1 | 0.787 | -0.345 | -2.064 | cell communication |
| 118446 | Gje1 | gap junction membrane channel protein epsilon 1 | 1.349 | 0.432 | 2.453 | cell communication; |
| 69367 | Glrx2 | glutaredoxin 2 (thioltransferase) | 1.252 | 0.324 | 2.066 | cell communication; cell death |
| 14682 | Gnaq | guanine nucleotide binding protein, alpha q polypeptide | 0.813 | -0.298 | -1.776 | cell communication; nervous system development;synapse |
| 224792 | Gpr116 | G protein-coupled receptor 116 | 1.279 | 0.355 | 2.154 | cell communication |
| 14799 | Gria1 | glutamate receptor, ionotropic, AMPA1 (alpha 1) | 0.776 | -0.365 | -1.975 | synapse |
| 14800 | Gria2 | glutamate receptor, ionotropic, AMPA2 (alpha 2) | 0.740 | -0.435 | -1.907 | cell communication; synapse |
| 14804 | Grid2 | glutamate receptor, ionotropic, delta 2 | 0.806 | -0.312 | -1.793 | synapse |
| 14943 | Gzmf | granzyme F | 0.801 | -0.321 | -1.928 | cell death |
| 15258 | Hipk2 | homeodomain interacting protein kinase 2 | 0.761 | -0.394 | -2.283 | cell communication; cell death |
| 26557 | Homer2 | homer homolog 2 (Drosophila) | 0.774 | -0.37 | -2.144 | cell communication |
| 14828 | Hspa5 | heat shock 70 kD protein 5 (glucose-regulated protein) | 0.716 | -0.481 | -1.984 | cell communication; cell death |
| 56213 | Htra1 | HtrA serine peptidase 1 | 0.795 | -0.331 | -1.834 | cell communication; receptor binding and activity |
| 15951 | Ifi204 | interferon activated gene 204 | 1.268 | 0.343 | 2.104 | cell death |
| 16323 | Inhba | inhibin beta-A | 0.718 | -0.477 | -2.551 | cell death; receptor binding and activity |
| 241226 | Itga8 | integrin alpha 8 | 1.270 | 0.345 | 2.112 | cell adhesion; cell communication |
| 16419 | Itgb5 | integrin beta 5 | 0.832 | -0.265 | -1.649 | cell adhesion; cell communication |
| 16443 | Itsn1 | intersectin 1 (SH3 domain protein 1A) | 0.826 | -0.275 | -1.839 | cell communication |
| 22343 | Lin7c | lin-7 homolog C (C. elegans) | 0.831 | -0.267 | -1.652 | cell communication; synapse |
| 330814 | Lphn1 | latrophilin 1 | 0.803 | -0.316 | -1.934 | cell communication |
| 16998 | Ltbp3 | latent transforming growth factor beta binding protein 3 | 1.291 | 0.368 | 2.202 | cell communication; receptor binding and activity |
| 17762 | Mapt | microtubule-associated protein tau | 0.727 | -0.459 | -2.312 | nervous system development |
| 17118 | Marcks | myristoylated alanine rich protein kinase C substrate | 0.799 | -0.324 | -1.815 | receptor binding and activity |
| 13728 | Mark2 | MAP/microtubule affinity-regulating kinase 2 | 0.817 | -0.291 | -1.922 | cell communication |
| 17193 | Mbd4 | methyl-CpG binding domain protein 4 | 0.818 | -0.289 | -1.753 | cell death |
| 52065 | Mfhas1 | malignant fibrous histiocytoma amplified sequence 1 | 0.759 | -0.398 | -2.297 | cell communication |
| 59030 | Mkks | McKusick-Kaufman syndrome protein | 0.749 | -0.416 | -2.427 | cell communication |
| 17346 | Mknk1 | MAP kinase-interacting serine/threonine kinase 1 | 1.273 | 0.348 | 2.113 | cell communication |
| 17748 | Mt1 | metallothionein 1 | 0.807 | -0.31 | -1.974 | cell communication |
| 17750 | Mt2 | metallothionein 2 | 0.780 | -0.359 | -2.141 | cell communication |
| 17909 | Myo10 | myosin X | 0.824 | -0.28 | -1.751 | cell communication |
| 17918 | Myo5a | myosin Va | 1.309 | 0.389 | 2.105 | cell communication; receptor binding and activity; synapse |
| 17984 | Ndn | necdin | 1.315 | 0.395 | 2.209 | cell communication; nervous system development |
| 192167 | Nlgn1 | neuroligin 1 | 1.381 | 0.466 | 2.470 | cell communication; nervous system development; synapse |
| 18125 | Nos1 | nitric oxide synthase 1, neuronal | 0.795 | -0.331 | -1.953 | cell communication; receptor binding and activity; synapse |
| 225872 | Npas4 | neuronal PAS domain protein 4 | 1.355 | 0.438 | 2.375 | cell communication |
| 18212 | Ntrk2 | neurotrophic tyrosine kinase, receptor, type 2 | 0.797 | -0.327 | -1.978 | cell communication; synapse |
| 18378 | Omp | olfactory marker protein | 0.790 | -0.34 | -1.907 | cell communication |
| 18389 | Oprl1 | opioid receptor-like 1 | 1.330 | 0.411 | 2.066 | cell communication |
| 18577 | Pde4a | phosphodiesterase 4A, cAMP specific | 0.812 | -0.301 | -1.903 | cell communication |
| 18578 | Pde4b | phosphodiesterase 4B, cAMP specific | 0.812 | -0.301 | -1.586 | cell communication |
| 18583 | Pde7a | phosphodiesterase 7A | 0.830 | -0.268 | -1.656 | cell communication |
| 14827 | Pdia3 | protein disulfide isomerase associated 3 | 0.812 | -0.3 | -1.829 | cell death |
| 74055 | Plce1 | phospholipase C, epsilon 1 | 0.807 | -0.309 | -1.923 | cell communication |
| 67916 | Ppap2b | phosphatidic acid phosphatase type 2B | 0.784 | -0.351 | -2.088 | cell communication |
| 170826 | Ppargc1b | peroxisome proliferative activated receptor, gamma, coactivator 1 beta | 0.749 | -0.417 | -2.262 | cell communication |
| 333654 | Ppp1r13l | protein phosphatase 1, regulatory (inhibitor) subunit 13 like | 0.820 | -0.287 | -1.903 | cell death |
| 73728 | Psd | pleckstrin and Sec7 domain containing | 1.291 | 0.368 | 2.130 | cell communication |
| 19246 | Ptpn1 | protein tyrosine phosphatase, non-receptor type 1 | 0.754 | -0.407 | -2.217 | cell communication |
| 19268 | Ptprf | protein tyrosine phosphatase, receptor type, F | 0.815 | -0.296 | -1.789 | cell communication |
| 19334 | Rab22a | RAB22A, member RAS oncogene family | 0.817 | -0.292 | -1.773 | cell communication |
| 19337 | Rab33a | RAB33A, member of RAS oncogene family | 1.276 | 0.352 | 2.165 | cell communication |
| 19340 | Rab3d | RAB3D, member RAS oncogene family | 0.792 | -0.337 | -1.964 | cell communication |
| 19415 | Rasal1 | RAS protein activator like 1 (GAP1 like) | 1.312 | 0.392 | 2.203 | cell communication |
| 17252 | Rdh11 | retinol dehydrogenase 11 | 1.300 | 0.378 | 2.172 | cell communication |
| 56533 | Rgs17 | regulator of G-protein signaling 17 | 1.309 | 0.388 | 2.141 | cell communication |
| 56470 | Rgs19 | regulator of G-protein signaling 19 | 1.275 | 0.35 | 2.124 | cell communication |
| 19893 | Rpgr | retinitis pigmentosa GTPase regulator | 1.322 | 0.403 | 2.232 | cell communication |
| 77945 | Rpgrip1 | retinitis pigmentosa GTPase regulator interacting protein 1 | 0.784 | -0.351 | -1.946 | cell communication |
| 110876 | Scn2a1 | sodium channel, voltage-gated, type II, alpha 1 | 0.798 | -0.325 | -1.848 | cell communication; cell death |
| 58234 | Shank3 | SH3/ankyrin domain gene 3 | 0.779 | -0.361 | -2.189 | cell communication; cell death |
| 27401 | Skp2 | S-phase kinase-associated protein 2 (p45) | 1.278 | 0.354 | 2.111 | cell death |
| 65962 | Slc9a3r2 | solute carrier family 9 (sodium/hydrogen exchanger), isoform 3 regulator 2 | 0.816 | -0.293 | -1.665 | cell communication |
| 17128 | Smad4 | MAD homolog 4 (Drosophila) | 0.802 | -0.318 | -1.838 | cell communication |
| 20411 | Sorbs1 | sorbin and SH3 domain containing 1 | 0.779 | -0.361 | -1.938 | cell adhesion; cell communication |
| 20692 | Sparc | secreted acidic cysteine rich glycoprotein | 0.756 | -0.403 | -2.405 | cell communication |
| 114715 | Spred1 | sprouty protein with EVH-1 domain 1, related sequence | 0.796 | -0.329 | -1.928 | cell communication |
| 114716 | Spred2 | sprouty-related, EVH1 domain containing 2 | 0.776 | -0.365 | -1.933 | cell communication |
| 14270 | Srgap2 | SLIT-ROBO Rho GTPase activating protein 2 | 0.825 | -0.278 | -1.778 | cell communication |
| 20848 | Stat3 | signal transducer and activator of transcription 3 | 0.808 | -0.308 | -1.710 | cell communication |
| 20913 | Stxbp4 | syntaxin binding protein 4 | 0.786 | -0.347 | -2.069 | cell communication |
| 240725 | Sulf1 | sulfatase 1 | 0.833 | -0.264 | -1.811 | cell death |
| 104015 | Synj1 | synaptojanin 1 | 1.366 | 0.45 | 2.207 | cell communication; synapse |
| 24071 | Synj2bp | synaptojanin 2 binding protein | 0.752 | -0.411 | -2.093 | cell communication |
| 21415 | Tcf3 | transcription factor 3 | 0.799 | -0.323 | -1.978 | cell communication |
| 21416 | Tcf7l2 | transcription factor 7-like 2, T-cell specific, HMG-box | 1.352 | 0.435 | 2.231 | cell communication |
| 110595 | Timp4 | tissue inhibitor of metalloproteinase 4 | 0.797 | -0.328 | -1.646 | cell communication; synapse |
| 22031 | Traf3 | Tnf receptor-associated factor 3 | 0.812 | -0.3 | -1.800 | cell communication; cell death |
| 94090 | Trim9 | tripartite motif protein 9 | 0.759 | -0.397 | -1.905 | cell communication; synapse |
| 22421 | Wnt7a | wingless-related MMTV integration site 7A | 0.827 | -0.274 | -1.758 | cell communication; nervous system development; synapse |
| 78889 | Wsb1 | WD repeat and SOCS box-containing 1 | 1.288 | 0.365 | 2.069 | cell communication |
| 22627 | Ywhae | tyrosine 3-monooxygenase/tryptophan 5-monooxygenase activation protein, epsilon polypeptide | 1.319 | 0.399 | 2.098 | cell communication |
| 235320 | Zbtb16 | zinc finger and BTB domain containing 16 | 0.776 | -0.366 | -1.759 | cell death |
Table 7.
Significantly regulated genes in double-transgenic dnADAM10/APP[V717I] mice in relation to mono-transgenic APP[V717I] mice
| Gene ID | Gene symbol | Description | Fold change | log ratio | d-value | Functional groups |
| 268860 | Abat | 4-aminobutyrate aminotransferase | 1.503 | 0.588 | 3.791 | cell communication; synapse |
| 67269 | Agtpbp1 | ATP/GTP binding protein 1 | 1.397 | 0.482 | 3.311 | cell communication; synapse |
| 226548 | Aph1a | anterior pharynx defective 1a homolog (C. elegans) | 0.724 | -0.466 | -3.127 | cell communication |
| 11938 | Atp2a2 | ATPase, Ca++ transporting, cardiac muscle, slow twitch 2 | 1.456 | 0.542 | 3.900 | cell communication |
| 140494 | Atp6v0a4 | ATPase, H+ transporting, lysosomal V0 subunit A4 | 0.762 | -0.392 | -2.972 | cell communication |
| 12122 | Bid | BH3 interacting domain death agonist | 1.381 | 0.466 | 3.765 | cell death |
| 12293 | Cacna2d1 | calcium channel, voltage-dependent, alpha2/delta subunit 1 | 1.460 | 0.546 | 4.086 | cell communication |
| 20303 | Ccl4 | chemokine (C-C motif) ligand 4 | 0.755 | -0.405 | -2.995 | receptor binding and activity |
| 12772 | Ccr2 | chemokine (C-C motif) receptor 2 | 0.648 | -0.625 | -3.824 | cell communication |
| 12955 | Cryab | crystallin, alpha B | 0.711 | -0.492 | -3.095 | cell communication |
| 12977 | Csf1 | colony stimulating factor 1 (macrophage) | 0.767 | -0.383 | -2.920 | cell adhesion; cell communication; receptor binding and activity |
| 56066 | Cxcl11 | chemokine (C-X-C motif) ligand 11 | 0.760 | -0.395 | -2.953 | receptor binding and activity |
| 20315 | Cxcl12 | chemokine (C-X-C motif) ligand 12 | 1.373 | 0.457 | 3.359 | receptor binding and activity |
| 224997 | Dlgap1 | discs, large (Drosophila) homolog-associated protein 1 | 1.417 | 0.503 | 3.720 | cell communication; synapse |
| 13527 | Dtna | dystrobrevin alpha | 1.338 | 0.42 | 3.294 | synapse |
| 23882 | Gadd45g | growth arrest and DNA-damage-inducible 45 gamma | 1.371 | 0.455 | 3.534 | cell death |
| 14943 | Gzmf | granzyme F | 0.745 | -0.424 | -3.031 | cell death |
| 215114 | Hip1 | huntingtin interacting protein 1 | 0.772 | -0.373 | -2.971 | cell death |
| 15257 | Hipk1 | homeodomain interacting protein kinase 1 | 0.726 | -0.461 | -3.122 | cell death |
| 15452 | Hprt1 | hypoxanthine guanine phosphoribosyl transferase 1 | 1.375 | 0.459 | 3.326 | cell communication; cell death; synapse |
| 215257 | Il1f9 | interleukin 1 family, member 9 | 0.706 | -0.503 | -3.808 | receptor binding and activity |
| 16323 | Inhba | inhibin beta-A | 0.744 | -0.426 | -2.892 | cell death; receptor binding and activity |
| 16325 | Inhbc | inhibin beta-C | 0.715 | -0.483 | -3.508 | receptor binding and activity |
| 16179 | Irak1 | interleukin-1 receptor-associated kinase 1 | 1.431 | 0.517 | 3.661 | receptor binding and activity |
| 80782 | Klrb1d | killer cell lectin-like receptor subfamily B member 1D | 0.735 | -0.444 | -3.340 | cell death |
| 16818 | Lck | lymphocyte protein tyrosine kinase | 0.698 | -0.519 | -3.204 | cell communication; cell death |
| 17248 | Mdm4 | transformed mouse 3T3 cell double minute 4 | 1.377 | 0.462 | 3.303 | cell death |
| 59030 | Mkks | McKusick-Kaufman syndrome protein | 0.723 | -0.468 | -3.503 | cell communication |
| 17910 | Myo15 | myosin XV | 0.753 | -0.41 | -2.883 | cell communication |
| 18125 | Nos1 | nitric oxide synthase 1, neuronal | 0.741 | -0.432 | -3.040 | cell communication; receptor binding and activity; synapse |
| 21907 | Nr2e1 | nuclear receptor subfamily 2, group E, member 1 | 0.702 | -0.511 | -3.426 | cell communication; cell death |
| 57270 | Olfr1508 | olfactory receptor 1508 | 0.735 | -0.444 | -3.162 | cell communication |
| 18378 | Omp | olfactory marker protein | 0.756 | -0.403 | -2.860 | cell communication |
| 170677 | Pcdh21 | protocadherin 21 | 0.614 | -0.703 | -3.902 | cell communication |
| 14827 | Pdia3 | protein disulfide isomerase associated 3 | 0.745 | -0.424 | -2.866 | cell death |
| 18821 | Pln | phospholamban | 0.741 | -0.432 | -3.181 | cell communication |
| 333654 | Ppp1r13l | protein phosphatase 1, regulatory (inhibitor) subunit 13 like | 0.733 | -0.449 | -3.361 | cell death |
| 54189 | Rabep1 | rabaptin, RAB GTPase binding effector protein 1 | 1.377 | 0.462 | 3.307 | cell death; receptor binding and activity |
| 17252 | Rdh11 | retinol dehydrogenase 11 | 1.374 | 0.458 | 3.317 | cell communication |
| 212541 | Rho | rhodopsin | 0.762 | -0.393 | -3.078 | cell communication |
| 19877 | Rock1 | Rho-associated coiled-coil containing protein kinase 1 | 1.402 | 0.487 | 3.841 | cell death |
| 19893 | Rpgr | retinitis pigmentosa GTPase regulator | 1.361 | 0.445 | 3.332 | cell communication |
| 110876 | Scn2a1 | sodium channel, voltage-gated, type II, alpha 1 | 1.393 | 0.478 | 3.500 | cell communication; cell death |
| 58234 | Shank3 | SH3/ankyrin domain gene 3 | 0.769 | -0.379 | -2.946 | cell communication; cell death |
| 22293 | Slc45a2 | solute carrier family 45, member 2 | 0.731 | -0.453 | -3.211 | cell communication |
| 20682 | Sox9 | SRY-box containing gene 9 | 0.754 | -0.408 | -3.089 | cell death |
| 20977 | Syp | synaptophysin | 1.448 | 0.534 | 3.608 | cell communication; synapse |
| 20979 | Syt1 | synaptotagmin I | 1.397 | 0.482 | 3.587 | cell communication; synapse |
| 21823 | Th | tyrosine hydroxylase | 0.761 | -0.394 | -2.993 | cell communication; synapse |
| 94090 | Trim9 | tripartite motif protein 9 | 0.716 | -0.481 | -2.963 | cell communication; synapse |
| 59025 | Usp14 | ubiquitin specific peptidase 14 | 1.383 | 0.468 | 3.342 | cell communication; synapse |
| 16963 | Xcl1 | chemokine (C motif) ligand 1 | 0.749 | -0.416 | -3.003 | receptor binding and activity |
The highest number of regulated genes in ADAM10 mono-transgenic mice (Tab. 4) belonged to the category of cell communication (53 genes), followed by the categories of synaptic junction and transmission (16 genes), and of nervous system development (15 genes). In dnADAM10 mice, fewer genes were found especially in the category of cell communication (15 genes).
In mono-transgenic mice, genes in the functional groups of inflammation or cell death were not over-represented (z-score < 1.96). In contrast, the category of cell death was over-represented in both double-transgenic mouse lines (Tab. 6 and 7), probably due to APP[V717I] overexpression.
The major difference in the two double-transgenic lines was the 3-fold higher number of regulated genes in the category of cell communication in the ADAM10/APP[V717I] double-transgenic line (96 genes), as compared to dnADAM10/APP[V717I] mice.
The results show that overexpression of proteolytically active ADAM10 generally influences cellular communication in mice, independently of their genetic background. One example for a regulated gene of this category is the calcium/calmodulin-dependent protein kinase II alpha (Camk2α), which is upregulated in mono-transgenic ADAM10 mice (Tab. 4) and downregulated in dnADAM10 mice (Tab. 5). Other genes of this category are the LDL receptor-related protein (Lrp1, Tab. 4, Additional file 1, Table S1), neuroligin (Nlgn1, Tab. 4, 6) and the very low density lipoprotein receptor (Vldlr, Additional file 1, Table S3).
ADAM10 overexpression has been shown to increase cortical synaptogenesis as revealed by immunohistochemistry [14]. Accordingly, here we confirmed these results on the mRNA level for two neurotransmitter systems: the glutamate receptor Gria3 and the glutamic acid decarboxylase 2 (Gad2) as well as the GABA-A receptor subunit alpha 4 (Gabra4). These are examples of up-regulated genes within the category of synaptic junction and transmission (Tab. 4).
Because ADAM10 has proteolytical activity, we were also interested in gene expression of putative ADAM10 substrates like APP and Egfr (Tab. 8). Their expressions were not regulated in mono-transgenic mice, and therefore they are not listed in tables 4, 5, 6, 7 and tables S1-S4.
Table 8.
Substrates of ADAM10 [43] which are not regulated in mono-transgenic mice within the parameters given in the Methods section
| Substrate groups | Symbol name of Mouse Gene |
| CNS substrates of ADAM10 | App, Aplp2, Prnp, Efna2, L1cam, Cdh2, Pcdhg, Dll1, Notch1 |
| Substrates of ADAM10 in inflammation | Cx3cl1, Cxcl16, Cdh5, F11r (JAM-A), Il6r, Fasl, Tnfrsf8 (CD30), Cd44 |
| Growth factors and receptors cleaved by ADAM10 | Egfr, Egf, Btc, Erbb2 |
Notch-1 expression was not changed in mice aged 5 months and its target gene Hes5 was only slightly affected in ADAM10 mice (Tab. 4). However, it has been reported that the ADAM10 knock out leads to severely affected Notch signaling and embryonic lethality at day 9.5 [11]. As in our transgenic animals ADAM10 was under control of the postnatal active neuron-specific mouse Thy 1-promoter, ADAM10 has no effect during embryogenesis. To examine whether the lack of influence of ADAM10 on the Notch pathway in our transgenic mice is due to the relative late stage (5 months) of investigation, we analyzed the expression of the Notch-1 target gene Hes5 in transgenic mice aged 15 days (Fig. 4): about 40% induction was observed in the ADAM10 overexpressing mice and a reduction of about 50% in the dnADAM10 transgenic mice.
Figure 4.

Hes5 mRNA levels in 15 days old ADAM10 transgenic mice. Brains of 15 days old FVB/N (Wt), ADAM10 (AD) or ADAM10 dominant negative mutant (dn) overexpressing mice were analyzed for the amount of the Notch-1 target gene Hes5 mRNA. Quantification was performed by real-time RT-PCR. Values represent means ± SEM of four mice per group normalized to GAPDH mRNA (one way ANOVA, Dunnett's Multiple Comparison Test; p < 0.05, *).
In addition, we found that overexpression of ADAM10 and dnADAM10 did not affect expression of either endogenous Adam10 or of other putative α-secretases like Adam9, Adam17 and Bace2 in adult mice. In general, the observed alteration of gene expression was low in all analyzed mouse lines (see the fold changes in Tab. 4, 5, 6, 7).
Alzheimer disease-related genes regulated by ADAM10
The GeneCards database (Weizmann Institute of Science, Version 2.36), which contains 934 genes connected with AD (gene list see Additional file 1, Tab. S7), was used for identification of AD-related genes regulated by ADAM10.
In ADAM10 mice, 25 AD genes (7% of 355 genes) were differently regulated, and in dnADAM10 mice 13 AD genes (9% of 143 genes) (Fig. 5) were altered including genes involved in cholesterol and lipid homeostasis, like Lrp1, Vldlr, and fatty acid-binding protein Fabp7. Other regulated genes code for inflammation-associated members of the S100 protein family (S100a8 and S100a9).
Figure 5.

Alzheimer disease genes in mono- and double-transgenic mice. Differentially expressed genes of ADAM10 versus FVB/N with FDR 0.5 (355 genes), of dnADAM10 versus FVB/N with FDR 0.5 (143 genes), of ADAM10/APP[V717I] versus APP[V717I] with FDR 0.0 (592 genes) and of dnADAM10/APP[V717I] versus APP[V717I] with FDR 0.0, restricted to 300 up- and 300 downregulated genes (600 genes), were compared to AD genes (934 genes) from GeneCards (Weizmann Institute of Science, Version 2.36). In ADAM10 versus FVB/N 25 AD genes (7% of 355 genes), in dnADAM10 versus FVB/N 13 AD genes (9% of 143 genes), in ADAM10/APP[V717I]versus APP[V717I] 43 AD genes (7% of 592 genes) and in dnADAM10/APP[V717I] versus APP[V717I] 30 AD genes (5% of 600 genes) were found.
In ADAM10/APP[V717I] mice, 43 AD genes (7% of 592 genes), and in dnADAM10/APP[V717I] mice, 30 AD genes (5% of 600 genes) were altered in expression (Fig. 5). The relatively small number of ADAM10-regulated AD genes in double-transgenic mice probably reflects brain dissection at the age of five months, before plaque formation begins. In all transgenic lines, we did not detect differences in the expression of presenilins 1 and 2. Bace1 was slightly upregulated (25%) in dnADAM10/APP[V717I] mice. The Aβ-degrading enzymes neprilysin (Mme) and insulin-degrading enzyme (Ide) were also not regulated in mono-transgenic mice. Solely, in ADAM10/APP[V717I] mice, Ide was slightly down-regulated (Additional file 1, Table S3).
In order to examine an influence of sex, a separate ChipInspector analysis restricted to the 600 most up- and downregulated genes was performed with samples from both female and male double-transgenic mice (Tab. 9, 10). The gene lists of female and male double-transgenic mice were then compared to the GeneCards AD gene list. The percentages of altered AD-related genes in female double-transgenic ADAM10/APP[V717I] and dnADAM10/APP[V717I]female mice are similar to the numbers found in male ADAM10/APP[V717I]and dnADAM10/APP[V717I] mice (Fig. 6). Thus, sexual dimorphism does not cause severe differences in ADAM10-dependent expression of AD-related genes. One exception was the insulin-like growth factor (Igf1), which was downregulated in female dnADAM10/APP[V717I] mice (0.65; FDR = 1.3%), but not in the corresponding male animals (1.17; FDR = 1.8).
Table 9.
Numbers of significantly regulated genes in male double-transgenic mice restricted by the given d-values.
| Mouse Genome 430 2.0 Array (Affymetrix) | |||
| 45 000 probe sets, 39 000 transcripts, 34 000 characterized | |||
| male ADAM10/APP[V717I] versus APP[V717I] 600 genes, FDR = 1.3% |
male dnADAM10/APP[V717I] versus APP[V717I] 600 genes, FDR = 1.3% |
||
| 414 upregulated (d-value > 1.18) |
186 downregulated (d-value < -0.71) |
320 upregulated (d-value > 1.29) |
280 downregulated (d-value < -0.75) |
Table 10.
Numbers of significantly regulated genes in female double-transgenic mice restricted by the given d-values
| Mouse Genome 430 2.0 Array (Affymetrix) | |||
| 45 000 probe sets, 39 000 transcripts, 34 000 characterized | |||
| female ADAM10/APP[V717I] versus APP[V717I] 600 genes, FDR = 1.3% |
female dnADAM10/APP[V717I] versus APP[V717I] 600 genes, FDR = 1.3% |
||
| 184 upregulated (d-value > 0.61) |
416 downregulated (d-value < -0.66) |
300 upregulated (d-value > 1.44) |
300 downregulated (d-value < -1.38) |
Figure 6.

Alzheimer disease genes in female and male double-transgenic mice. Differentially expressed genes of female and male ADAM10/APP[V717I] versus APP[V717I] and of dnADAM10/APP[V717I]versus APP[V717I] with FDR 1.3, restricted to the 600 best up- and downregulated genes were analyzed for AD genes (934 genes) from GeneCards (Weizmann Institute of Science, Version 2.36). In female ADAM10/APP[V717I] versus APP[V717I] mice 49 AD genes (8% of 600 genes) and in female dnADAM10/APP[V717I] versus APP[V717I] animals 35 AD genes (6% of 600 genes) were found to be affected. In male ADAM10/APP[V717I] versus APP[V717I] mice 42 AD genes (7% of 600 genes) and in male dnADAM10/APP[V717I] versus APP[V717I] mice 31 AD genes (5% of 600 genes) were found to be affected. The corresponding d-values are listed separately for male (Tab. 9) and female mice (Tab. 10).
Genes regulated through APP[V717I] overexpression
To determine the effect of APP[V717I] overexpression on gene regulation in transgenic mice, we compared APP[V717I] mice with FVB/N mice, ADAM10/APP[V717I] mice with ADAM10 mice, and dnADAM10/APP[V717I] mice with dnADAM10 mice. After background adjustment and normalization with the GCRMA procedure, a Venn diagram of genes regulated in the transgenic mice was generated (Fig. 7). The overlap of the three groups represents 617 genes regulated by APP[V717I] overexpression, independent of the strain background. This high number of genes altered by APP[V717I] expression demonstrates the strong influence of human APP[V717I] overexpression in the AD mouse model used.
Figure 7.
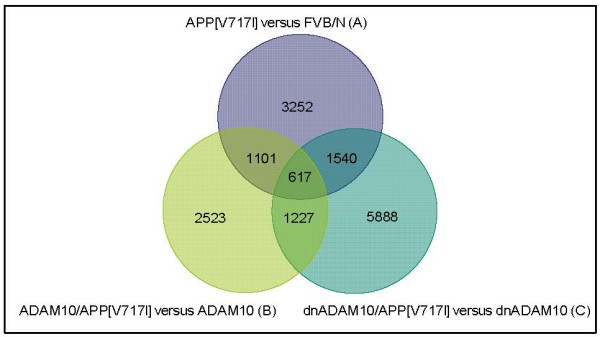
Venn diagram of regulated genes in investigated mouse lines after CARMA-analysis (BH<0.005). Venn diagram of APP[V717I]versus FVB/N (A), ADAM10/APP[V717I] versus ADAM10 (B) und dnADAM10/APP[V717I] versus dnADAM10 (C), generated by a custom-written Perl-script showing the effect of APP[V717I] overexpression in double-transgenic mice. The numbers in the spaces of overlapping circles represent the number of transcripts that were affected in all mouse groups. The numbers in the outer portion of each circle represent the number of transcripts that were exclusively affected in two mouse groups.
AD-related genes that were regulated in double-transgenic, but not in mono-transgenic mice include microtubule-associated protein tau (Mapt) (Tab. 6; Tab. S3) and the ionotropic glutamate receptors AMPA 1 (Gria 1) and AMPA 2 (Gria 2) (Tab. 6; Tab. S3).
Confirmation of microarray data
For validation of the results obtained by microarray analysis, real-time RT-PCR was applied on the original RNA samples (Fig. 8 and 9). Changes in gene expression levels of selected transcripts were normalized to the gene expression of GAPDH, which was not regulated in our transgenic mouse strains.
Figure 8.

Analyses of gene expression of selected candidate genes by real-time RT-PCR in mono-transgenic mice. Expression levels of individual genes in mono-transgenic mice in relation to gene expression in FVB/N wild-type mice. Shown are the results from RT-PCR and microarray analyses. Values presented: mean of fold changes ± SD of three animals. A: ADAM10; B: S100a8; C: Nlgn1; D: S100a9; E: Fabp7. Statistical significance was determined by using ANOVA analysis, followed by Dunnett's post hoc comparison (*), p ≤ 0.05; (**), p ≤ 0.001; (***), p ≤ 0.001.
Figure 9.

Analyses of gene expression of selected candidate genes by real-time RT-PCR in double-transgenic mice. Expression levels of individual genes in double-transgenic mice in relation to gene expression in APP[V717I] mono-transgenic mice. Shown are the results from RT-PCR and microarray analyses. Values presented: mean of fold changes ± SD of 4–6 animals. A: ADAM10; B: Vldlr; C: Gria1; D: Gria2; E: Mapt; F: Nlgn1. Statistical significance was determined by using ANOVA analysis, followed by Dunnett's post hoc comparison (*), p ≤ 0.05; (**), p ≤ 0.001; (***), p ≤ 0.001.
In the microarray analyses, the calcium-binding proteins (S100a8 and S100a9) were found to be downregulated in ADAM10 and dnADAM10 mice. Both genes are associated with various inflammatory processes including Alzheimer's disease [25]. By using real-time RT-PCR, significant downregulation of S100a8 and S100a9 was confirmed (Fig. 8B and 9D). Additionally, quantification of dimers of S100a8 and a9 (calprotectin) by ELISA revealed a slight reduction in both transgenic mouse lines (Fig. 10C) which is in accordance with the findings for mRNA levels. The decrease of about 10 to 15% of calprotectin as compared to wild-type mice was not statistically significant which might be due to ELISA-specific detection of heterodimers. We cannot exclude that changes concerning both monomeric proteins might be more substantial, but a detection of the monomeric form of S100a9 by Western blotting failed as a consequence of its low expression level.
Figure 10.

Effect of Adam10 on Fabp7 and S100a8/a9 proteins in mouse brain. A) Fabp7 protein expression was analyzed in fractions of soluble brain proteins of mono-transgenic mice by Western blotting (Wt: wild-type, AD: ADAM10, dn: dominant negative ADAM10). As a control for antibody specificity, a lysate of HEK293 cells overexpressing V5-tagged murine Fabp7 (19 kDa; +) was used. B) Quantification of Fabp7 was performed with at least 5 animals per group. Values represent mean ± SEM, and values obtained for wild-type animals (Wt) were set to 100% (one way ANOVA, Bonferroni post-test; ns, not significant; p < 0.001, ***). C) Expression of dimeric S100a8/a9 (calprotectin) was quantified by ELISA in mouse brain extracts. Measured absorptions at 405 nm were normalized to wet tissue weight (mean ± SEM; n = 4).
Fatty acid-binding protein 7 (Fabp7), which is elevated in Down syndrome fetal brains [26], was found to be upregulated in dnADAM10 mice by microarray analysis. A significantly increased Fabp7 expression was confirmed in dnADAM10 mice by real-time RT-PCR. As observed by real-time RT-PCR, expression of Fabp7 was slightly reduced in ADAM10 mice, but this effect did not reach a significant level (Fig. 8E). Fabp7 protein expression was analyzed in the soluble protein fraction from brains of mono-transgenic mice by Western blotting. While ADAM10 had no significant effect on Fabp7 expression, the dominant-negative form dnADAM10 increased the amount of the Fabp7 protein (Fig. 10A/B), which is in accordance with the results obtained by microarray and PCR analysis.
Neuroligin 1, a postsynaptic cell-adhesion molecule of excitatory synapses, plays a role in neuronal differentiation and axogenesis [27]. In microarray analyses, neuroligin 1 gene expression was induced in ADAM10 mice. This tendency, although without reaching significance, was also confirmed in real-time RT-PCR (Fig. 8C).
Other proteins identified by gene profiling and associated with Alzheimer disease are the low density lipoprotein receptor-related protein 1 (Lrp1) [28], the very low density lipoprotein receptor (Vldlr) [29], the microtubule-associated protein tau (Mapt) [30] and the ionotropic glutamate receptors AMPA1 and AMPA2 (Gria1 and Gria2) [31]. Downregulation of Lrp1 by ADAM10, as observed in the chip analyses, was not confirmed by real-time RT-PCR (results not shown). For Vldlr, we found by real-time RT-PCR a significant downregulation in ADAM10/APP[V717I] mice, but its upregulation in dnADAM10/APP[V717I] mice, as detected with the microarray, could not be confirmed (Fig. 9B).
By real-time RT-PCR, the microtubule-associated protein tau was shown to be significantly downregulated in both double-transgenic mouse lines (Fig. 9E). Also in the case of the ionotropic glutamate receptors AMPA1 (Gria1) and AMPA2 (Gria 2), real-time RT-PCR confirmed the results of the microarray analyses: both genes are downregulated in ADAM10/APP[V717I] mice (Fig. 9C and 9D).
Discussion
Increasing the α-secretase cleavage of APP represents a plausible strategy for the treatment of Alzheimer disease, because via this route it is possible to decrease the concentration of neurotoxic Aβ peptides and to increase the amount of neuroprotective APPsα simultaneously.
The aim of this study was to investigate the influence of increased amounts of ADAM10 proteins on gene expression in the mouse CNS. To this end, we analyzed transgenic mice either overexpressing catalytically active ADAM10, or a dominant-negative mutant of ADAM10 (dnADAM10) which is able to inhibit endogenous mouse enzymes with α-secretase activity [10,12]. An additional reason for investigation of dnADAM10 mice is determined by the multi-domain structure of ADAMs because specific biological functions have been assigned to protein domains outside the catalytic centre of ADAMs [15].
In ADAM10 mice, more genes were regulated than in dnADAM10 animals; this indicates that, due to the many substrates of ADAM10, an increase in their cleavage products might change the expression of genes involved in cell communication and synaptic transmission. No change, however, was detected in the expression of the substrates as a feedback reaction.
In all transgenic mice the endogenous ADAM10 level was not influenced through overexpression of ADAM10 or its inactive variant as revealed by real-time RT-PCR. Also the other ADAM family members Adam9 and Adam17/TACE were not regulated differentially in the investigated transgenic mice, thus indicating that a reduced α-secretase activity as observed in dnADAM10 mice [12] was not compensated by the induction of gene expression of other potential α-secretases.
Since ADAM10 has been implicated in Notch signaling [11,32], we investigated this pathway. On the RNA level, we found no regulation of Notch-1 in mono- and double-transgenic mice at the age of 5 months: expression of the Notch target gene Hes5 was only slightly changed in mono-transgenic ADAM10 mice. This is in accordance with earlier real-time RT-PCR experiments, where no significant difference was found in Hes5 transcription levels between adult mice overexpressing ADAM10 and non-transgenic mice [12]. This lack of influence on Notch signaling is probably due to the late stage of analysis, since we found small but significant effects of ADAM10 on Hes5 mRNA levels in transgenic mice aged 15 days.
ADAM10 has been reported to mediate cadherin shedding, β-catenin translocation and expression of β-catenin target genes [33,34]. In double-transgenic dnADAM10/APP[V717I] mice various cadherins (Cdh8, Cdh10 and Cdh13), β-catenin (Ctnnb1), several Wnts (Wnt4, Wnt7a and Wnt9a) and Jun kinase (Jun) were upregulated (about 30%). The upregulation of these genes might represent a compensatory mechanism to by-pass a reduced catalytic activity of ADAM10 and β-catenin signaling. In mice overexpressing active ADAM10, no significant changes of β-catenin target genes, for example c-myc and cyclin D1, were found.
Also for other ADAM10 substrates like L1cam, proteins involved in inflammation like Fasl, and for growth factor receptors like Egfr (see also table 8), we could not demonstrate any alteration.
Most genes in ADAM10 and ADAM10/APP[V717I] mice were found to be altered in the pathway of cell communication, followed by genes in categories of nervous system development and synaptic junction and transmission (Tab. 4, 5, 6, 7). One example for a regulated gene in the category of cell communication and synaptic function is the calcium/calmodulin-dependent protein kinase II alpha (Camk2α), one of the most abundant kinases in the brain, which is involved in long term potentiation. Camk2α was upregulated in ADAM10 mice, and downregulated in dnADAM10. Another gene of cell communication and synaptic function is neuroligin (Nlgn1), a brain-specific acetylcholinesterase homologous protein, which was upregulated in ADAM10/APP[V717I] mice (Fig. 9F). This component of excitatory synapses plays a role in neuronal differentiation and axogenesis [27]. An increase in cortical synaptogenesis as found by Bell et al. in ADAM10 mice [14], was confirmed through upregulation of the glutamate receptor Gria3 and the glutamic acid decarboxylase 2 (Gad2) as well as the GABA-A receptor subunit alpha 4 (Gabra4).
Downregulation of the ionotropic glutamate receptors AMPA1 (Gria1) and AMPA2 (Gria2) as observed in our microarray study was confirmed by real-time RT-PCR: reduced mRNA levels of Gria1 and Gria2 were detected in ADAM10/APP[V717I] mice. The downregulation of these two genes possibly depends on overexpression of APP[V717I] as described before [35,36].
The number of regulated genes involved in the development of AD was relatively small in the brains of double-transgenic ADAM10/APP[V717I] and dnADAM10/APP[V717I] mice, and almost equivalent to mono-transgenic ADAM10 or dnADAM10 mice (Fig. 5). We did not detect differences in most genes directly involved in APP processing; but reduction of α-secretase activity induced a slight upregulation of Bace1 in dnADAM10/APP[V717I] mice.
Comparative GCRMA analysis demonstrated the strong influence of human APP[V717I] overexpression on gene expression in double-transgenic mice. Tau (Mapt) was directly downregulated through APP[V717I] overexpression in ADAM10/APP[V717I] versus ADAM10 mice. Altered expression of AD-related genes was independent of sex, with one exception: insulin-like growth factor 1 (Igf-1), which has been implicated in Alzheimer pathology [37,38], was downregulated in double-transgenic female dnADAM10/APP[V717I] mice.
By microarray analysis, we observed in mono-transgenic mice a downregulation of members of the S100 protein family, small calcium-binding proteins responsible for a wide range of intra- and extracellular functions [39]. S100a8 and S100a9 were expressed to a lower extent in ADAM10 and dnADAM10 mice. PCR analysis and ELISA confirmed this effect (Fig. 8B and 8D, Figure 10C). S100a8 and S100a9 form the dimer calprotectin which is a marker for inflammation [40]. Immunohistochemical analysis recently showed S100A9 in association with the neuropathological hallmarks of sporadic and familiar AD: it was found in senile plaques, in activated glia cells and in neurons with neurofibrillary tangle morphology [25]. The downregulation of S100a9 by both ADAM10 and dnADAM10 overexpression is probably mediated by their common domains (the disintegrin and cystein-rich domain as well as the C-terminus).
A member of the fatty acid-binding proteins (Fabp7) was regulated by ADAM10 in mono-transgenic mice. Fabp7, also named brain lipid-binding protein (B-Fabp), is localized in the cytoplasm and in the nucleus, and is involved in the uptake, storage and/or delivery of fatty acids and retinoids into the nucleus [41]. Fabp7 is mainly expressed in radial glial cells, and is necessary for proper migration of immature neurons to cortical layers. Increased amounts of Fabp7 in the brains of individuals with Down syndrome suggest that higher concentrations of Fabp7 contribute to brain abnormalities and mental retardation [26]. We observed a significant upregulation of Fabp7 mRNA and protein in dnADAM10 mice. Since in Down syndrome patients α-secretase activity significantly decreases with age [42], our results provide a connection between inhibition of α-secretase (in our study by dnADAM10) and upregulation of Fabp7.
Conclusion
This study shows that overexpression of ADAM10 or dnADAM10 in the brain of adult mice does not lead to drastic alteration of gene expression. In particular, ADAM10 or dnADAM10 overexpression does not result in an increased expression of genes coding for pro-inflammatory or pro-apoptotic proteins. On the contrary, overexpression of ADAM10 and its mutant even leads to a decreased amount of the inflammation marker calprotectin (the dimer of S100a8 and S100a9).
The relatively low number of genes affected by the ADAM10 modulation and the mild characteristic of altered expression levels might be related to the age of the mice we investigated. Since expression in the whole brain was analyzed, a higher change of gene expression may occur in single areas like the hippocampus. From other reports it is evident that manipulation of ADAM10 in embryonic or early ontogenic stages could have severe side effects but therapeutic approaches concerning Alzheimer's disease always will focus on adult patients. Our results in sum therefore provide evidence that, due to its effect on inflammation markers and on Fabp7 expression, ADAM10 might have beneficial effects in addition to those that are due to its α-secretase activity. These results further support the strategy of ADAM10 upregulation as a therapeutic approach for the treatment of AD.
Abbreviations
(AD): Alzheimer disease; (APP): amyloid precursor protein; (Aβ peptides): Amyloid β-peptides; (ADAM10): a disintegrin and metalloproteinase 10.
Authors' contributions
CP has carried out all molecular genetic experiments and has drafted the manuscript. DT has performed the analyses of biological pathways and contributed to the manuscript draft; WW has coordinated the bioinformatic analysis. KE has performed the Western blot analysis, the ELISA, quantification of Hes5-mRNA and co-drafted the manuscript; RP has participated in the design of the study and co-drafted the manuscript. FF has conceived and coordinated the study, drafted the final version of the manuscript and given approval for its publication.
Supplementary Material
Additional tables including differentially regulated genes in ADAM10 and mutant ADAM10 transgenic mice. Table S1 Complete list of significantly regulated genes in mono-transgenic ADAM10 mice (three females 5 months old ADAM10 mice as well as FVB/N wild-type mice). Table S2 Complete list of significantly regulated genes in mono-transgenic dnADAM10 mice (three females 5 months old, dnADAM10 mice as well as FVB/N wild-type mice). Table S3 Complete list of significantly regulated genes in double-transgenic ADAM10/APP[V717I] mice (three female and three male 5 months old, ADAM10/APP[V717I] mice as well as APP[V717I] mice). Table S4 Complete list of significantly regulated genes in double-transgenic dnADAM10/APP[V717I] mice (three female and three male 5 months old, dnADAM10/APP[V717I] mice as well as APP[V717I] mice). Table S5 Commonly regulated genes through ADAM10 overexpression in mono- and double transgenic mice (ADAM10 versus FVB/N (355 genes) compared to ADAM10/APP[V717I] versus APP[V717I] (592 genes). Table S6 Commonly regulated genes through dnADAM10 overexpression in mono- and double transgenic mice (dnADAM10 versus FVB/N (143 genes) compared to dnADAM10/APP[V717I] versus APP[V717I] (600 genes)). Table S7 934 Alzheimer disease genes by GeneCards (Weizmann Institute of Science, Version 2.36)
Acknowledgments
Acknowledgements
We thank Dr. Michael Bonin and Sven Poths (Microarray Facility, Department of Human Genetics, Tübingen, Germany), and Dr. Florian Wagner (RZPD German Resource Center for Genome Research, Berlin, Germany) for support of the microarray analysis. We also thank Annette Roth (Institute of Biochemistry, University Mainz, Germany) for performing the real-time RT-PCR. We are grateful to Dr. Fred van Leuven (Katholieke Universiteit Leuven/Belgium) for the APP[V717I] mice. We acknowledge the financial support by the Federal Ministry of Education and Research (BMBF) in the framework of the National Genome Research Network (NGFN), Förderkennzeichen FKZ01GS0470, FKZ01GS08130, and FKZ01GS08133, the financial support by the Helmholtz Association in the framework of the Virtual Institute of Neurodegeneration and Ageing and the Helmholtz Alliance for Mental Health in an Ageing Society, and the support by DFG (German Research Foundation) in the framework of the SFB 596: Molecular Mechanisms of Neurodegeneration, subproject A12.
Contributor Information
Claudia Prinzen, Email: prinzen@uni-mainz.de.
Dietrich Trümbach, Email: dietrich.truembach@helmholtz-muenchen.de.
Wolfgang Wurst, Email: wurst@helmholtz-muenchen.de.
Kristina Endres, Email: endres.uni-mainz@email.de.
Rolf Postina, Email: postina@uni-mainz.de.
Falk Fahrenholz, Email: fahrenho@uni-mainz.de.
References
- Lambert MP, Barlow AK, Chromy BA, Edwards C, Freed R, Liosatos M, et al. Diffusible, nonfibrillar ligands derived from Abeta1-42 are potent central nervous system neurotoxins. Proc Natl Acad Sci USA. 1998;95:6448–6453. doi: 10.1073/pnas.95.11.6448. [DOI] [PMC free article] [PubMed] [Google Scholar]
- Lesne S, Koh MT, Kotilinek L, Kayed R, Glabe CG, Yang A, et al. A specific amyloid-beta protein assembly in the brain impairs memory. Nature. 2006;440:352–357. doi: 10.1038/nature04533. [DOI] [PubMed] [Google Scholar]
- Walsh DM, Klyubin I, Fadeeva JV, Cullen WK, Anwyl R, Wolfe MS, et al. Naturally secreted oligomers of amyloid beta protein potently inhibit hippocampal long-term potentiation in vivo. Nature. 2002;416:535–539. doi: 10.1038/416535a. [DOI] [PubMed] [Google Scholar]
- Small DH, Nurcombe V, Reed G, Clarris H, Moir R, Beyreuther K, et al. A heparin-binding domain in the amyloid protein precursor of Alzheimer's disease is involved in the regulation of neurite outgrowth. J Neurosci. 1994;14:2117–2127. doi: 10.1523/JNEUROSCI.14-04-02117.1994. [DOI] [PMC free article] [PubMed] [Google Scholar]
- Furukawa K, Sopher BL, Rydel RE, Begley JG, Pham DG, Martin GM, et al. Increased activity-regulating and neuroprotective efficacy of alpha-secretase-derived secreted amyloid precursor protein conferred by a C-terminal heparin-binding domain. J Neurochem. 1996;67:1882–1896. doi: 10.1046/j.1471-4159.1996.67051882.x. [DOI] [PubMed] [Google Scholar]
- Ishida A, Furukawa K, Keller JN, Mattson MP. Secreted form of beta-amyloid precursor protein shifts the frequency dependency for induction of LTD, and enhances LTP in hippocampal slices. Neuroreport. 1997;8:2133–2137. doi: 10.1097/00001756-199707070-00009. [DOI] [PubMed] [Google Scholar]
- Meziane H, Dodart JC, Mathis C, Little S, Clemens J, Paul SM, et al. Memory-enhancing effects of secreted forms of the beta-amyloid precursor protein in normal and amnestic mice. Proc Natl Acad Sci USA. 1998;95:12683–12688. doi: 10.1073/pnas.95.21.12683. [DOI] [PMC free article] [PubMed] [Google Scholar]
- Lannfelt L, Basun H, Wahlund LO, Rowe BA, Wagner SL. Decreased alpha-secretase-cleaved amyloid precursor protein as a diagnostic marker for Alzheimer's disease. Nat Med. 1995;1:829–832. doi: 10.1038/nm0895-829. [DOI] [PubMed] [Google Scholar]
- Sennvik K, Fastbom J, Blomberg M, Wahlund LO, Winblad B, Benedikz E. Levels of alpha- and beta-secretase cleaved amyloid precursor protein in the cerebrospinal fluid of Alzheimer's disease patients. Neurosci Lett. 2000;278:169–172. doi: 10.1016/S0304-3940(99)00929-5. [DOI] [PubMed] [Google Scholar]
- Lammich S, Kojro E, Postina R, Gilbert S, Pfeiffer R, Jasionowski M, et al. Constitutive and regulated alpha-secretase cleavage of Alzheimer's amyloid precursor protein by a disintegrin metalloprotease. Proc Natl Acad Sci USA. 1999;96:3922–3927. doi: 10.1073/pnas.96.7.3922. [DOI] [PMC free article] [PubMed] [Google Scholar]
- Hartmann D, De Strooper B, Serneels L, Craessaerts K, Herreman A, Annaert W, et al. The disintegrin/metalloprotease ADAM 10 is essential for Notch signalling but not for alpha-secretase activity in fibroblasts. Hum Mol Genet. 2002;11:2615–2624. doi: 10.1093/hmg/11.21.2615. [DOI] [PubMed] [Google Scholar]
- Postina R, Schroeder A, Dewachter I, Bohl J, Schmitt U, Kojro E, et al. A disintegrin-metalloproteinase prevents amyloid plaque formation and hippocampal defects in an Alzheimer disease mouse model. J Clin Invest. 2004;113:1456–1464. doi: 10.1172/JCI20864. [DOI] [PMC free article] [PubMed] [Google Scholar]
- Schmitt U, Hiemke C, Fahrenholz F, Schroeder A. Over-expression of two different forms of the alpha-secretase ADAM10 affects learning and memory in mice. Behav Brain Res. 2006;175:278–284. doi: 10.1016/j.bbr.2006.08.030. [DOI] [PubMed] [Google Scholar]
- Bell KF, Zheng L, Fahrenholz F, Cuello AC. ADAM-10 over-expression increases cortical synaptogenesis. Neurobiol Aging. 2008;29:554–565. doi: 10.1016/j.neurobiolaging.2006.11.004. [DOI] [PubMed] [Google Scholar]
- White JM. ADAMs: modulators of cell-cell and cell-matrix interactions. Curr Opin Cell Biol. 2003;15:598–606. doi: 10.1016/j.ceb.2003.08.001. [DOI] [PubMed] [Google Scholar]
- Tousseyn T, Blobel C, Serneels L, Nyabi O, Snellinx A, Maes E, et al. Shedding of the ADAM10 ectodomain is mediated by ADAM9 and is followed by a processing of the ADAM10 CTF by presenilin/gamma-secretase. Neurobiology of Aging. 2004;25:S524. doi: 10.1016/S0197-4580(04)81730-5. [DOI] [Google Scholar]
- Clement AB, Hanstein R, Schroder A, Nagel H, Endres K, Fahrenholz F, et al. Effects of neuron-specific ADAM10 modulation in an in vivo model of acute excitotoxic stress. Neuroscience. 2008;152:459–468. doi: 10.1016/j.neuroscience.2007.10.060. [DOI] [PubMed] [Google Scholar]
- Tusher VG, Tibshirani R, Chu G. Significance analysis of microarrays applied to the ionizing radiation response. Proc Natl Acad Sci USA. 2001;98:5116–5121. doi: 10.1073/pnas.091062498. [DOI] [PMC free article] [PubMed] [Google Scholar]
- Irizarry RA, Hobbs B, Collin F, Beazer-Barclay YD, Antonellis KJ, Scherf U, et al. Exploration, normalization, and summaries of high density oligonucleotide array probe level data. Biostatistics. 2003;4:249–264. doi: 10.1093/biostatistics/4.2.249. [DOI] [PubMed] [Google Scholar]
- Wu Z, Irizarry RA. Preprocessing of oligonucleotide array data. Nat Biotechnol. 2004;22:656–658. doi: 10.1038/nbt0604-656b. [DOI] [PubMed] [Google Scholar]
- Wu Z, Irizarry RA, Gentleman R, Murillo F, Spencer F. A model-based background adjustment for oligonucleotide expression arrays. J Am Statistical Assoc. 2004;99:909–917. doi: 10.1198/016214504000000683. [DOI] [Google Scholar]
- Rainer J, Sanchez-Cabo F, Stocker G, Sturn A, Trajanoski Z. CARMAweb: comprehensive R- and bioconductor-based web service for microarray data analysis. Nucleic Acids Res. 2004;34:W498–W503. doi: 10.1093/nar/gkl038. [DOI] [PMC free article] [PubMed] [Google Scholar]
- Benjamini Y, Hochberg Y. Controlling the false discovery rate: a practical and powerful approach to multiple testing. J R Statist Soc B. 1995;57:289–300. [Google Scholar]
- Moechars D, Dewachter I, Lorent K, Reverse D, Baekelandt V, Naidu A, et al. Early phenotypic changes in transgenic mice that overexpress different mutants of amyloid precursor protein in brain. J Biol Chem. 1999;274:6483–6492. doi: 10.1074/jbc.274.10.6483. [DOI] [PubMed] [Google Scholar]
- Shepherd CE, Goyette J, Utter V, Rahimi F, Yang Z, Geczy CL, et al. Inflammatory S100A9 and S100A12 proteins in Alzheimer's disease. Neurobiol Aging. 2006;27:1554–1563. doi: 10.1016/j.neurobiolaging.2005.09.033. [DOI] [PubMed] [Google Scholar]
- Sanchez-Font MF, Bosch-Comas A, Gonzalez-Duarte R, Marfany G. Overexpression of FABP7 in Down syndrome fetal brains is associated with PKNOX1 gene-dosage imbalance. Nucleic Acids Res. 2003;31:2769–2777. doi: 10.1093/nar/gkg396. [DOI] [PMC free article] [PubMed] [Google Scholar]
- Song JY, Ichtchenko K, Sudhof TC, Brose N. Neuroligin 1 is a postsynaptic cell-adhesion molecule of excitatory synapses. Proc Natl Acad Sci USA. 1999;96:1100–1105. doi: 10.1073/pnas.96.3.1100. [DOI] [PMC free article] [PubMed] [Google Scholar]
- Glaser C, Schulz S, Handschug K, Huse K, Birkenmeier G. Genetic and functional characteristics of the human in vivo LRP1/A2MR receptor suggested as a risk marker for Alzheimer's disease and other complex (degenerative) diseases. Neurosci Res. 2004;50:85–101. doi: 10.1016/j.neures.2004.06.001. [DOI] [PubMed] [Google Scholar]
- Nakamura Y, Yamamoto M, Kumamaru E. Significance of the variant and full-length forms of the very low density lipoprotein receptor in brain. Brain Res. 2001;922:209–215. doi: 10.1016/S0006-8993(01)03170-5. [DOI] [PubMed] [Google Scholar]
- Oddo S, Billings L, Kesslak JP, Cribbs DH, LaFerla FM. Abeta immunotherapy leads to clearance of early, but not late, hyperphosphorylated tau aggregates via the proteasome. Neuron. 2004;43:321–332. doi: 10.1016/j.neuron.2004.07.003. [DOI] [PubMed] [Google Scholar]
- Chang EH, Savage MJ, Flood DG, Thomas JM, Levy RB, Mahadomrongkul V, et al. AMPA receptor downscaling at the onset of Alzheimer's disease pathology in double knockin mice. Proc Natl Acad Sci USA. 2006;103:3410–3415. doi: 10.1073/pnas.0507313103. [DOI] [PMC free article] [PubMed] [Google Scholar]
- Dallas DJ, Genever PG, Patton AJ, Millichip MI, McKie N, Skerry TM. Localization of ADAM10 and Notch receptors in bone. Bone. 1999;25:9–15. doi: 10.1016/S8756-3282(99)00099-X. [DOI] [PubMed] [Google Scholar]
- Maretzky T, Reiss K, Ludwig A, Buchholz J, Scholz F, Proksch E, et al. ADAM10 mediates E-cadherin shedding and regulates epithelial cell-cell adhesion, migration, and beta-catenin translocation. Proc Natl Acad Sci USA. 2005;102:9182–9187. doi: 10.1073/pnas.0500918102. [DOI] [PMC free article] [PubMed] [Google Scholar]
- Reiss K, Maretzky T, Ludwig A, Tousseyn T, De SB, Hartmann D, et al. ADAM10 cleavage of N-cadherin and regulation of cell-cell adhesion and beta-catenin nuclear signalling. EMBO J. 2005 doi: 10.1038/sj.emboj.7600548. [DOI] [PMC free article] [PubMed] [Google Scholar]
- Dewachter I, Filipkowski RK, Priller C, Ris L, Neyton J, Croes S, et al. Deregulation of NMDA-receptor function and down-stream signaling in APP[V717I] transgenic mice. Neurobiol Aging. 2007;30:241–256. doi: 10.1016/j.neurobiolaging.2007.06.011. [DOI] [PubMed] [Google Scholar]
- Hsieh H, Boehm J, Sato C, Iwatsubo T, Tomita T, Sisodia S, et al. AMPAR removal underlies Abeta-induced synaptic depression and dendritic spine loss. Neuron. 2006;52:831–843. doi: 10.1016/j.neuron.2006.10.035. [DOI] [PMC free article] [PubMed] [Google Scholar]
- Carro E, Torres-Aleman I. The role of insulin and insulin-like growth factor I in the molecular and cellular mechanisms underlying the pathology of Alzheimer's disease. Eur J Pharmacol. 2004;490:127–133. doi: 10.1016/j.ejphar.2004.02.050. [DOI] [PubMed] [Google Scholar]
- Vardy ER, Rice PJ, Bowie PC, Holmes JD, Grant PJ, Hooper NM. Increased circulating insulin-like growth factor-1 in late-onset Alzheimer's disease. J Alzheimers Dis. 2007;12:285–290. doi: 10.3233/jad-2007-12401. [DOI] [PubMed] [Google Scholar]
- Donato R. S100: a multigenic family of calcium-modulated proteins of the EF-hand type with intracellular and extracellular functional roles. Int J Biochem Cell Biol. 2001;33:637–668. doi: 10.1016/S1357-2725(01)00046-2. [DOI] [PubMed] [Google Scholar]
- Foster R, Kandanearatchi A, Beasley C, Williams B, Khan N, Fagerhol MK, et al. Calprotectin in microglia from frontal cortex is up-regulated in schizophrenia: evidence for an inflammatory process? Eur J Neurosci. 2006;24:3561–3566. doi: 10.1111/j.1460-9568.2006.05219.x. [DOI] [PubMed] [Google Scholar]
- Bass NM. Cellular binding proteins for fatty acids and retinoids: similar or specialized functions? Mol Cell Biochem. 1993;123:191–202. doi: 10.1007/BF01076492. [DOI] [PubMed] [Google Scholar]
- Nistor M, Don M, Parekh M, Sarsoza F, Goodus M, Lopez GE, et al. Alpha- and beta-secretase activity as a function of age and beta-amyloid in Down syndrome and normal brain. Neurobiol Aging. 2007;28:1493–1506. doi: 10.1016/j.neurobiolaging.2006.06.023. [DOI] [PMC free article] [PubMed] [Google Scholar]
- Pruessmeyer J, Ludwig A. The good, the bad and the ugly substrates for ADAM10 and ADAM17 in brain pathology, inflammation and cancer. Semin Cell Dev Biol. 2008 doi: 10.1016/j.semcdb.2008.09.005. [DOI] [PubMed] [Google Scholar]
Associated Data
This section collects any data citations, data availability statements, or supplementary materials included in this article.
Supplementary Materials
Additional tables including differentially regulated genes in ADAM10 and mutant ADAM10 transgenic mice. Table S1 Complete list of significantly regulated genes in mono-transgenic ADAM10 mice (three females 5 months old ADAM10 mice as well as FVB/N wild-type mice). Table S2 Complete list of significantly regulated genes in mono-transgenic dnADAM10 mice (three females 5 months old, dnADAM10 mice as well as FVB/N wild-type mice). Table S3 Complete list of significantly regulated genes in double-transgenic ADAM10/APP[V717I] mice (three female and three male 5 months old, ADAM10/APP[V717I] mice as well as APP[V717I] mice). Table S4 Complete list of significantly regulated genes in double-transgenic dnADAM10/APP[V717I] mice (three female and three male 5 months old, dnADAM10/APP[V717I] mice as well as APP[V717I] mice). Table S5 Commonly regulated genes through ADAM10 overexpression in mono- and double transgenic mice (ADAM10 versus FVB/N (355 genes) compared to ADAM10/APP[V717I] versus APP[V717I] (592 genes). Table S6 Commonly regulated genes through dnADAM10 overexpression in mono- and double transgenic mice (dnADAM10 versus FVB/N (143 genes) compared to dnADAM10/APP[V717I] versus APP[V717I] (600 genes)). Table S7 934 Alzheimer disease genes by GeneCards (Weizmann Institute of Science, Version 2.36)