

SUMMARY
Mammalian cells infected with Toxoplasma gondii are characterized by a profound reprogramming of gene expression. We examined whether such transcriptional responses were linked to changes in the cell cycle of the host. Human foreskin fibroblasts (HFF) in the G0/G1 phase of the cell cycle were infected with T. gondii and FACS analysis of DNA content was performed. Cell cycle profiles revealed a promotion into the S phase followed by an arrest towards the G2/M boundary with infection. This response was markedly different from that of growth factor stimulation which caused cell cycle entry and completion. Transcriptional profiles of T. gondii-infected HFF showed sustained increases in transcripts associated with a G1/S transition and DNA synthesis coupled to an abrogation of cell cycle regulators critical in G2/M transition relative to growth factor stimulation. These divergent responses correlated with a distinct temporal modulation of the critical cell cycle regulator kinase ERK by infection. While the kinetics of ERK phosphorylation by EGF showed rapid and sustained activation, infected cells displayed an oscillatory pattern of activation. Our results suggest that T. gondii infection induces and maintains a “proliferation response” in the infected cell which may fulfill critical growth requirements of the parasite during intracellular residence.
Keywords: Toxoplasma, cell cycle, cyclin, ERK
INTRODUCTION
Toxoplasma gondii is an obligate intracellular parasite with a broad host range responsible for severe systemic disease among immunocompromised individuals (Montoya and Rosso, 2005; Luft and Remington, 1992). T. gondii has evolved a high level of adaptation with the host, recognized by its ability to subvert the immune system and establish a life-long chronic infection (Denkers, 2003; Tenter et al., 2000). This adaptation is underlined by the manipulation of a spectrum of functions at the cellular level. Parasite-induced phenotypic changes are characterized by marked changes in gene expression (Molestina and Sinai, 2005; Chaussabel et al., 2003; Molestina et al., 2003; Blader et al., 2001). These include host factors involved in intermediary metabolism at a period of maximal parasite growth (i.e., glycolysis, lipid and nucleotide biosynthesis) (Blader et al., 2001), as well as signaling pathways with roles in cell survival and apoptosis (Molestina and Sinai, 2005; Molestina et al., 2003; Payne et al., 2003).
We recently reported that the parasite-dependent reprogramming of gene expression in infected fibroblasts correlates with the modulation of transcripts that regulate cell proliferation (Molestina and Sinai, 2005). These include the transcription factor Egr-1 which has been shown to activate the expression of growth factors participating in the amplification of a mitogenic stimulus (Thiel and Cibelli, 2002; Silverman and Collins, 1999; Gashler and Sukhatme, 1995). We reasoned that induction of this type of response in the T. gondii-infected cell may have an effect on the status of the host cell cycle. While the role of viruses in cell cycle dysregulation is well established (Op De Beeck and Caillet-Fauquet, 1997; Vousden, 1994), involvement of bacteria and parasites (both protozoan and metazoan) is an understudied area. Among parasitic agents, the strongest and most direct link is observed in the transformation of bovine leukocytes by members of the Theileria species (Guergnon et al., 2003; Kuenzi et al., 2003; Heussler et al., 2001).
There is limited knowledge on the impact of T. gondii infection on the cell cycle partly due to the fact that infected cells do not undergo transformation. Earlier publications determined that the ability of T. gondii to infect synchronized cell cultures increased as cells proceeded from the G1 to the S phase and decreased as cells entered G2/M (Grimwood et al., 1996; Dvorak and Crane, 1981). A recent study by Radke et al (Radke et al., 2006) reported that cell division autoantigen-1, a host gene with negative functions in the cell cycle (Chai et al., 2001), slows parasite growth when overexpressed and induces the expression of bradyzoite-specific proteins. These results provide further evidence that changes in host cell transcription, particularly profiles that affect the cell cycle machinery, have the ability to modulate the intracellular environment and affect parasite development. The plausibility of an infection-dependent modulation of the cell cycle in the host is supported by additional studies showing: i) an increase in transcripts associated with diverse metabolic processes in the host cell which is consistent with events occurring in S phase (Blader et al., 2001), ii) a rearrangement of host cell microtubules and recruitment of the microtubule organizing center to the parasitophorous vacuole membrane (PVM) which may compromise progression of the cycle towards mitosis (Coppens et al., 2006); Romano et al., 2005), and iii) a downregulation of mitotic proteins by infection (Nelson et al., 2007).
Transition from one phase of the cell cycle to another is governed in an orderly fashion by the activities of cyclin dependent kinases (CDKs) in association with their respective cyclins (Ekholm and Reed, 2000; Morgan et al., 1998). Cyclin D/CDK4/6 and cyclin E/CDK2 complexes regulate passage through the G1/S restriction point (Pines, 1993; Koff et al., 1992). Cyclin A participates in the activation of replication complexes with CDK2 during S phase (Coverley et al., 2002; Rosenblatt et al., 1992) while entry into mitosis is dependent on cyclin B/CDK1 (Cortez and Elledge, 2000). The activities of CDK complexes are negatively controlled by CDK inhibitors (CKI) (Sherr and Roberts, 1999) to ensure proper progression of the cycle after exposure to environmental stresses resulting in DNA damage or improper DNA replication (Schwartz, 2002; Zhou and Elledge, 2000). The multiple layers of control of the cell cycle offer several opportunities for interference by infection which may involve the orchestrated participation of both host and parasite factors.
In this study we examined whether T. gondii infection resulted in the dysregulation of the host cell cycle. Our data suggest that the parasite has developed strategies to both induce a growth signal and prevent cell cycle progression in the infected cell. Perturbations in the host cell cycle machinery by T. gondii infection may influence how the parasite suits its own replication scheme during intracellular residence.
RESULTS
T. gondii infection promotes entry into the S phase
To study potential alterations in the host cell cycle by infection, experiments were performed in HFF as these primary cells are highly contact-inhibited, unlikely to carry mutations that may cause cell cycle dysregulation, and efficiently supportive of parasite growth. Non-synchronized HFF were initially grown for 5 days to ≥90% confluence to establish a culture which is largely contact-inhibited and non-proliferating (Tobey et al., 1990; Tobey et al., 1988). Cells were incubated in media alone or infected with the RH strain of T. gondii for 24 h and measurements of DNA content were performed by FACS analysis of propidium iodide-stained nuclei. As shown in Fig. 1A, uninfected HFF were predominantly in a G0/G1 resting state while infection induced a dose-dependent increase in the percentages of cells present in the S phase (Fig. 1B–D). Notably, the numbers of cells present in the G2/M population were negligible when a higher parasite load was applied (Fig. 1C, D). These results demonstrate that T. gondii infection induces a G1 to S transition, however, the failure of infected HFF to accumulate in the G2/M phase suggests a delay in the exit from the S phase. Similar outcomes were observed in non-synchronized cell populations (HeLa and mouse embryonic fibroblasts), where the analysis was complicated by the asynchrony in the starting cell population (data not shown).
Fig. 1.

T. gondii infection induces a G1 to S transition in the host cell. Non-synchronized HFF were grown for 5 days to ≥90% confluency to establish a contact-inhibited non-proliferating culture (Tobey et al., 1990; Tobey et al., 1988). Cells were infected with T. gondii RH for 24 h and DNA content was analyzed by FACS. Cell cycle profiles were obtained using ModFit software. Infection induced a dose-dependent increase in the percentages of cells present in the S phase (A–D). Notably, the numbers of cells present in G2/M were negligible when a higher parasite load was applied (C,D). FACS parameters were selected to exclude cell debris and aggregates from the analysis. The data correspond to a representative experiment of three performed. Similar cell cycle profiles were obtained for all experiments. MOI, multiplicity of infection.
The response elicited by T. gondii infection differed from epidermal growth factor (EGF), a classical mitogenic agent of fibroblasts (Carpenter and Cohen, 1976). As depicted in Fig. 2A, T. gondii initiated entry into the S phase suggestive of a G1 to S transition by 12 h, although this response was minimal relative to the non-treated control (NT). This contrasted with a greater stimulation of S phase entry in response to infection or EGF at the 24 and 32 h time points (Fig. 2B and C, respectively). Interestingly, higher numbers of cells were found to be in S-phase with infection relative to EGF, where increased cell numbers at the G2/M stage were evident (Fig. 2B,C). Furthermore, under conditions where cells were treated with EGF and infected with the parasite (EGF+RH), the DNA-content profile essentially mirrored that of cells that had been infected alone (Fig 2B). This was particularly the case for the population located in the S-phase of the cell cycle. The increased proportion of cells in S-phase coupled with the reduced numbers at G2/M (4N ploidy) suggest that Toxoplasma promotes entry into the cell cycle that is arrested in the S-phase and fails to progress to completion.
Fig. 2.

The mitogenic response elicited by T. gondii infection is different from that induced by epidermal growth factor (EGF) and is dominant over that of EGF. Contact-inhibited HFF grown in 6-well plates were incubated with media alone (NT), infected with T. gondii RH at an m.o.i. of 5:1, treated with 20 ng/ml of EGF or infected in the presence of EGF (EGF+RH). Cells were harvested at 12 (A), 24 (B) and 32 hours (C) following treatment and subjected to DNA content analysis by flow cytometry. Cell cycle profiles were obtained using ModFit software. The proportion of cells in S-phase was markedly higher in parasite infected cells relative to both EGF and untreated cells (B and C). In contrast, parasite infected cells exhibit a diminished G2/M (4N ploidy) population relative to EGF stimulated cells at both the 24 and 32 hour time points. Notably, infection of cells in the presence of EGF resulted in a cell cycle distribution very similar to that of cells infected with the parasites alone (EGF+RH). FACS analyses exclude signals from cell debris and aggregates. Results correspond to a representative experiment of three performed.
Transcriptional profile of cell cycle regulators in response to infection
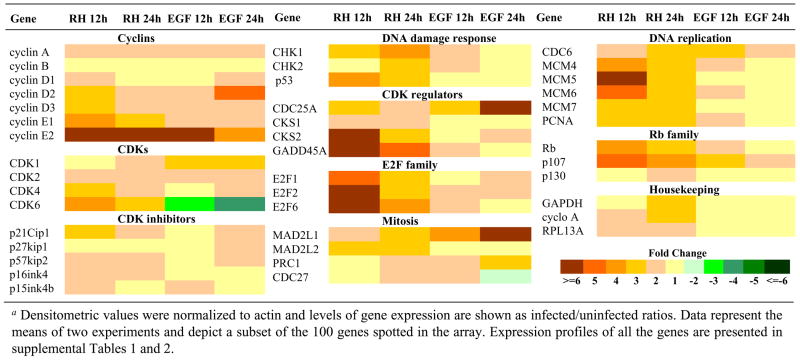
To examine the molecular mechanisms controlling the entry into S phase by infection, a transcriptional profile of genes involved in cell cycle progression was determined by DNA hybridization arrays (Superarray, Inc.). Results presented in Table 1 depict a subset of the 100 genes spotted in the array. Expression profiles of all the genes are presented in supplemental Tables 1 and 2. At 12 h of infection, increases of twofold or greater were observed in the expression of D and E cyclins, cyclin A, regulators of CDK function, members of the E2F and Rb families, and factors involved in DNA damage response, DNA replication, and mitosis (Table 1). This trend continued after 24 h with the response of factors affecting DNA replication displaying somewhat lower levels of expression compared to the earlier time point. A downregulatory response to infection was not apparent among the genes represented in the array as examined after 12 and 24 h (Table 1 and Supplemental Tables 1 and 2).
Table 1.
Modulation of host cell genes involved in the regulation of the cell cycle by T. gondiia.
|
Densitometric values were normalized to actin and levels of gene expression are shown as infected/uninfected ratios. Data represent the means of two experiments and depict a subset of the 100 genes spotted in the array. Expression profiles of all the genes are presented in supplemental Tables 1 and 2.
In general, the response of HFF to T. gondii infection resulted in common patterns of gene expression with EGF treatment but some notable differences were observed. Interestingly, levels of expression of transcripts associated with a G1/S transition were higher in T. gondii-infected cells compared to EGF, particularly at the 12 h time point (Table 1). These included the D cyclins, cyclin E1, and members of the E2F and Rb families. Upregulation of E2Fs by T. gondii may function as a positive feedback mechanism for the maintenance of the host cell in S phase given their roles as transcriptional regulators of genes participating in DNA metabolism and DNA synthesis (Stevaux and Dyson, 2002). Other noticeable differences among infection and EGF included a greater induction of factors involved in DNA replication such as MCM4, MCM5, MCM6, and MCM7 (Table 1).
We sought to confirm the results obtained by the hybridization arrays using semi-quantitative RT-PCR to monitor the levels of cyclins in the course of infection and following EGF treatment. We expanded the time scale of the experiment to include both early (8 h) and late (32 h) time points (Fig 3). The results obtained by this alternative approach were generally consistent with those observed in the arrays, with elevated levels of G1/S cyclins (cyclin D1, E1, E2) in response to parasite infection or EGF treatment (Fig. 3A–C). At later time points (24 and 32 h), the late S-phase cyclin A and the mitotic cyclin B exhibited increases in expression that were comparable between EGF and parasite infection (Fig. 3D,E). This despite the apparent block in the progression of infected cells to the G2/M stage based on DNA content analysis (Fig. 2).
Fig 3.

RT-PCR analysis of cyclin expression in response to EGF or T. gondii infection. HFF were left untreated (NT), stimulated with EGF (20ng/ml), or infected with T. gondii RH at an m.o.i. of 5:1. RNA was isolated after 8, 12, 24, and 32 hours of incubation. RT-PCR amplification and analysis of gene expression of cyclin D1 (A), cyclin E1 (B), cyclin E2 (C), cyclin A (D), cyclin B (E), and β-actin (F) were performed as described in Experimental Procedures. Gel images and corresponding densitometric profiles are shown from a representative experiment of three performed. Increased steady state message levels are observed following infection and EGF treatment consistent with cell cycle entry.
Altogether, infection with T. gondii resulted in the dysregulation of genes that encode cyclins, CDKs, and cell cycle checkpoint molecules participating in the control of cell growth and division (Table 1). The expression profiles of these genes are consistent with a promotion into the S phase based on the upregulation of genes involved in G1-S transition. Consistent with a potential arrest in S-phase, genes involved in DNA synthesis are induced at 12 h and maintained at 24 h post infection, while the response to EGF is lower and not sustained (Table 1). The relatively poor response of mitotic genes like MAD2L1 even at 24 h post-infection are consistent with the apparent block in the mitotic response. In this regard, the apparent induction of cyclin B levels seen by RT-PCR (Fig 3E) suggests that post transcriptional regulation may play a role in the parasite-directed changes in the host cell cycle. Toward examining this possibility, we performed a detailed time course of the cyclin profiles following infection or EGF treatment.
Analysis of cyclin levels in response to infection
Entry into the cell cycle depends on the periodic accumulation and degradation of G1 and S cyclins (Pines, 1993; Koff et al., 1992). Cyclin D starts to accumulate in early G1, cyclin E in late G1-early S, and cyclin A during S phase with a gradual decrease in G2 (Coverley et al., 2002; Rosenblatt et al., 1992). Progression to mitosis is dependent on the accumulation of cyclin B which eventually decreases with the resumption of the cell cycle (Cortez and Elledge, 2000). A comparison of cyclin protein levels in HFF as a result of infection or growth factor stimulation revealed different kinetic patterns consistent with the discrepancies of cell cycle profiles observed in Fig. 1. As shown in Fig. 4, T. gondii infection induced a slightly delayed increase in cyclin D1 compared to EGF treatment. However, elevations in cyclin E1 levels were apparent by 12 h post-infection (Fig. 4A) as opposed to 16 h post-EGF treatment (Fig. 4B) suggesting an earlier G1/S transition. Interestingly, the cyclin A response was markedly delayed and abrogated with infection compared to EGF in spite of the increased expression observed at the transcriptional level by 12 h (Table 1 and Fig. 3D). In addition, cyclin B was detected only after 32 h of T. gondii infection (Fig. 4A) in comparison to the increase observed at 24 h by growth factor stimulation (Fig. 4B). The gradual decreases in cyclins A and B with EGF treatment are consistent with exit from the S phase, progression towards mitosis, and initiation of a new round of the cycle (Fig. 4B), a feature which is not readily apparent in response to parasite infection (Fig. 4A). Thus, the delayed yet sustained effects in cyclin A and cyclin B levels by T. gondii infection are compatible with a delay in the exit from S and undefined passage across G2/M.
Fig. 4.

The cyclin profiles of infected cells correlate with entry into the cell cycle followed by interference in progression. Confluent HFF grown in 24-well plates were infected with T. gondii RH at an m.o.i. of 5:1 (A) or stimulated with 2 ng/ml of EGF (B) over a period of 36 h. Cells were processed for SDS-PAGE followed by immunoblotting using antibodies against cyclin D1, cyclin E1, cyclin A, cyclin B, and β-actin as a loading control. Both T. gondii infection and EGF treatment induced increases in the levels of cyclins D1 and E1 consistent with a G1/S transition. The kinetics of cyclins A and B on the other hand showed a delayed and abrogated response with infection. Results correspond to one representative experiment of three performed. Black lines below panels A and B represent the predicted stages of the cell cycle.
Activation of ERK by T. gondii displays an oscillatory profile
To further characterize the mitogenic response to infection in comparison to EGF, levels of ERK phosphorylation were determined given the role of this kinase in cell cycle entry (Steelman et al., 2004; Chang et al., 2003). As shown in Fig. 5, the kinetic profile of ERK activation by T. gondii was strikingly different to EGF. While infection induced an oscillatory pattern of activation during the first 24 h (Fig. 5A), EGF stimulated rapid and sustained phosphorylation of ERK (Fig. 5B). Interestingly, levels of phospho-ERK in T. gondii-infected cells remained elevated at later time points (Fig. 5A, 28–36 h). In contrast, the response to growth factor stimulation returned to baseline despite continuous treatment with EGF (Fig. 5B). The kinetic pattern of ERK activation observed in T. gondii-infected cells suggests a parasite-specific signaling event that may impact distinct transcriptional outputs and cell cycle profiles in the host.
Fig. 5.

Infection with T. gondii results in an oscillatory profile of ERK activation. Confluent HFF grown in 24-well plates were infected with T. gondii RH at an m.o.i. of 5:1 (A) or stimulated with 2 ng/ml of EGF (B) over a period of 36 h. Cells were processed for SDS-PAGE followed by immunoblotting using antibodies against phosphorylated ERK and total ERK as a loading control. The kinetic profile of ERK phosphorylation in infected cells shows an oscillatory pattern of activation in contrast to a rapid and sustained response induced by EGF during the first 24 h. At later time points, however, the response to growth factor stimulation returned to baseline while levels of phospho-ERK in T. gondii-infected cells remained elevated.
Requirement of parasite viability in the modulation of the host cell cycle
The requirement for parasite replication in the modulation of the host cell cycle was addressed by separate parasiticidal treatments that target distinct biological activities in T. gondii. Pyrimethamine is an inhibitor of parasite dihydrofolate reductase (DHFR) activity which interferes with nucleotide metabolic pathways required for growth within the parasitophorous vacuole (Hill and Dubey, 2002; Derouin, 2001; Georgiev, 1994). Clindamycin on the other hand inhibits replication of a nonphotosynthetic plastid in T. gondii (the apicoplast) (Camps et al., 2002) and causes a “delayed death” phenotype whereby the drug has no effect on parasite survival during a first round of infection (Fichera and Roos, 1997; Fichera et al., 1995). Parasites emerging from the first growth cycle are able to invade new cells but unable to replicate whether clindamycin is present or not (Fichera et al., 1995). This allows us to examine whether non-replicating parasites are able to induce a proliferation response in the absence of compounds that could impact the host cell.
The effects of pyrimethamine and clindamycin in the parasite-induced entry into the S phase were determined by FACS analysis of DNA content (Fig. 6). A marked decrease in the accumulation of infected cells in the S phase was observed after 24 h in the presence of pyrimethamine (Fig. 6C). Similar results were observed when HFF were infected with parasites that had emerged from one growth cycle of clindamycin treatment and incubated in media free of antibiotics (Fig. 6D). Experiments performed after 30 h of infection showed an increase in the percentage of pyrimethamine-treated cells present in the S phase to 29% compared to 47% of infected HFF free of antibiotics (Data not shown). Contrary to this, cells infected with clindamycin-treated parasites for 30 h failed to show an increase above the 14% accumulation in S phase observed at the earlier 24 h time point (Data not shown).
Fig. 6.

Parasite replication is required in the modulation of the host cell cycle by T. gondii. Confluent HFF were incubated in media alone (A) or infected with T. gondii RH at an m.o.i. of 5:1 in the absence (B) or presence of 10 μM pyrimethamine (C) for 24 h. Alternatively, cells were infected at an equivalent m.o.i. with parasites that had emerged from one growth cycle under 10 μM clindamycin treatment and incubated in media free of antibiotics for 24 h (D). DNA content was analyzed by FACS and cell cycle profiles were obtained using ModFit software. FACS signals from cell debris and aggregates were excluded from the analysis. Results correspond to one representative experiment of three performed. PYR, pyrimethamine; CLIND, clindamycin.
To examine whether the deficient response in S phase entry as a result of parasiticidal treatment correlated with a failure to induce changes in the levels of cyclins, immunoblot analysis of cyclins D, A, and E was performed in infected cells. Surprisingly, infection of HFF in the presence of 10 μM pyrimethamine showed only a moderate abrogation in the increased responses of such cyclins compared to infected cells treated with antibiotic-free media (Fig. 7). A similar pattern was observed in cells infected with parasites that had emerged from one growth cycle under 10 μM clindamycin treatment and subsequently incubated in media free of antibiotics. Of note, parasites deficient in replication failed to sustain elevated levels of phospho-ERK at late stages of infection possibly due to an abrogated response early in infection (Fig. 7). This correlated with a less pronounced oscillatory profile of activation compared to cells infected in the absence of antibiotic pressure (Fig. 7A and Fig. 5A). Altogether, early events post-infection appear sufficient to initiate entry into the cell cycle. However, parasite viability is likely required to provide a continuous mitogenic stimulus for the maintenance of the infected cells in S phase.
Fig. 7.

Infection with replication-deficient parasites causes a moderate abrogation in the levels of cyclins coupled to a failure in the sustained activation of ERK. Confluent HFF were infected with T. gondii RH at an m.o.i. of 5:1 in the absence (A) or presence of 10 μM pyrimethamine (B) for the indicated time points. Cells were also infected at an equivalent m.o.i. with parasites that had emerged from one growth cycle under 10 μM clindamycin treatment and incubated in media free of antibiotics (C). Infected cells were processed for SDS-PAGE followed by immunoblotting using antibodies against cyclin D1, cyclin E1, cyclin A, β-actin, phosphorylated ERK and total ERK. Results correspond to one representative experiment of three performed. PYR, pyrimethamine; CLIND, clindamycin.
DISCUSSION
The transcriptional studies of the T. gondii-infected cell have expanded our understanding of the signaling pathways and metabolic processes that are exploited by the parasite to establish a replication-competent environment (Molestina and Sinai, 2005; Chaussabel et al., 2003; Molestina et al., 2003; Blader et al., 2001). Interestingly, little attention has been paid to whether changes in these transcriptional programs affect the host cell cycle. This is particularly relevant since perturbation of the cell-cycle machinery in the host may influence how the parasite suits its own replication scheme and dictate the complex events regulating inter-conversion between the acute and chronic stages of infection (Radke et al., 2001).
The results presented above correlate with a rewiring of the activation circuits of the host cell to induce a “proliferation response” by infection. Transcriptional and protein profiles of cell cycle regulators in response to T. gondii are consistent with a promotion of the host cell into the S phase. However, it is important to note that while EGF-stimulated cells exhibit evidence for entry into G2/M and completion of the cycle, T. gondii-infected cells appear to be delayed in progression. These results suggest a parasite-induced entry into the S phase coupled with a perturbation in the mitotic process (Fig. 8). The manipulation of the intricate signaling networks underlying this phenotype may occur at different phases of the cell cycle in order to fine tune the magnitude of the mitogenic response.
Fig. 8.

Modulation of the host cell cycle by T. gondii infection. We propose a model whereby dysregulation of the cell cycle in infected cells occurs through a balance of proliferative and inhibitory signals. Infection of G0/G1 quiescent cells with T. gondii induces increases in D and E cyclins, thus promoting progression through G1 (A) and transition into the S phase (B), respectively. However, infected cells are delayed in progression partly due to an abrogated response in the accumulation of cyclins A and B (C). This may result in deficient activities of CDKs critical in the exit from the S phase and transition across the G2/M boundary (C). Importantly, optimal parasite growth is required for a robust mitogenic response and maintenance of the host cell in S phase. Potential mechanisms responsible for triggering entry into the cell cycle as well as the delayed response in cyclin A and B accumulation are further discussed in the text.
Gene expression profiles of cell cycle regulators obtained by DNA hybridization arrays provided insights into the underlying mechanisms responsible for the differences observed between infection and growth factor stimulation. A greater induction of components involved in G1/S transition such as cyclin E1, CDK4, and CDK6 was observed in T. gondii-infected cells compared to EGF (Table 1). This may contribute to an apparent earlier entry into S phase by infection as depicted from the protein profiles of cyclin levels. Cyclin E2, which is also involved in control of G1/S transition, was increased at a higher extent by infection as opposed to EGF at the later 24 h time point. Together with cyclin E1, the induction of cyclin E2 late in infection may function to ensure the activity of CDK2 as the host cell progresses through the S phase. This may represent a strategy to ensure the maintenance of the host cell at this stage of the cell cycle given the deficient response in the accumulation of cyclin A detected at the protein level (Fig. 4). In general, the observations made using the hybridization array approach were confirmed using semi quantitative RT-PCR (Fig. 3) which extended the time course of the experiment by an additional 6 hours, roughly a doubling time for the RH strain of T. gondii.
The infection-dependent perturbation in cell cycle progression following S-phase entry correlated with delayed and abrogated levels of cyclins A and B, two key players in the onset of mitosis (Yam et al., 2002; Juan et al., 1998). Alterations in the levels of these proteins may result from a dysregulation of the molecular mechanisms affecting their expression at the transcriptional level or a premature degradation of newly synthesized proteins. A plausible dysregulation of cyclin gene transcription may occur at multiple stages, primarily: a) Modulation of the activities of E2F transcription factors binding at the promoter regions of cyclin A and B genes. b) Interference in the activities of specific cyclin dependent kinases (CDKs) that contribute indirectly to the activation of cyclin gene expression by phosphorylating the retinoblastoma protein (Rb). c) Interference in the activation and subcellular compartmentalization of CDK complexes. The delayed kinetic patterns of cyclins A and B observed with infection would suggest a transient repression of E2F-mediated transcription. However, transcriptional profiles of cyclin A indicate increased levels of expression as measured at 12 and 24 h of infection (Table 1, Fig. 3D). In addition, mRNA levels of cyclin B appeared elevated in response to infection or EGF (Fig. 3E). As the arrays and RT-PCR experiments provide only snapshots of the host transcriptome at a particular time point, a temporal analysis of cyclin A and B gene expression in the context of E2F-dependent activities will be critical to establish the mechanism underlining the delayed process. The fact that the levels of these cyclins eventually increase late in infection suggest that a potential repression of transcription or premature degradation of newly synthesized protein may be regulated temporally. Of note, a recent publication suggests that a G2 block is affected by the parasite mediated manipulation of the host protein UHRF1, a ubiquitin-like protein with a ring finger domain, thus providing a potential link to a degradative cascade (Brunet et al., 2007). Such phenotype may reflect a strategy to prolong the exit of the host cell from the S phase in combination with the sustained activation of the mitogenic response.
A plausible modification of CDK activities as a mechanism responsible for the abrogated response in cyclin A and B expression by infection posits an interesting means of parasite interference of the host cell cycle. This is in lieu of the fact of the recent identification of novel parasite proteins with kinase and phosphatase activities which are delivered to the host cell nucleus from specialized secretory organelles called rhoptries following invasion (Gilbert et al., 2007; Saeij et al., 2007). CDK activities are regulated at multiple levels, such as phosphorylation status, association with CDK inhibitors (CKI), and subcellular location (Nilsson and Hoffmann, 2000; Fesquet et al., 1993; Gu et al., 1992). Potential interactions between parasite proteins that traverse the parasitophorous vacuole membrane and cyclin/CDK complexes may affect their catalytic activities and hinder normal progression across the cell cycle.
The kinetics of ERK phosphorylation showed marked differences between infection and growth factor stimulation. A major role of ERK in the promotion of cell cycle entry involves the phosphorylation of AP-1, a transcription factor which regulates the expression of cyclin D (Ravenhall et al., 2000; Lee et al., 1999). Contrary to EGF treatment, only moderate levels of ERK activation were observed early in infection (1–4 h, Fig. 5A) suggesting a minor role for this pathway in the increased levels of cyclin D expression at this stage. The promotion of cell cycle entry by T. gondii infection is likely contributed by the NF-κB family of transcription factors which recognize specific sequences at the promoter region of the cyclin D gene (Guttridge et al., 1999; Hinz et al., 1999; Joyce et al., 1999). Signaling via the NF-κB pathway displays a robust response early in infection (Molestina and Sinai, 2005) but a dampening effect at the time when ERK phosphorylation is elevated (8h, Fig. 5A). Such oscillatory patterns of activation may reflect a cross-talk between the NF-κB and ERK pathways in the regulation of cyclin D expression and cell cycle entry by T. gondii infection.
The divergence between the levels of ERK phosphorylation elicited by infection and growth factor stimulation was more pronounced after 24 h. T. gondii-infected cells displayed sustained levels of ERK phosphorylation while the response to EGF decreased gradually with the progression of the cycle towards G2/M (Fig. 5). Interestingly, the sustained ERK response observed late in infection mirrors the temporal profile of NF-κB activation in T. gondii-infected cells (Molestina and Sinai, 2005) and was dependent on parasite replication (Fig. 7). Prolonged activation of these signaling cascades may provide a positive feedback mechanism for the maintenance of the infected host cell in S phase. Such a response may derive from an amplification of the initial mitogenic signal triggered by infection via an autocrine loop. Alternatively, persistent activation of ERK may depend on a T. gondii-derived component associated with increased levels of parasite replication as suggested by the inhibitory studies with pyrimethamine and clindamycin (Fig. 7). Of note, cell cycle entry was affected at a greater extent in HFF infected with clindamycin-treated parasites compared to infected cells treated with pyrimethamine at 30 h p.i. This was consistent with a more pronounced decrease in ERK phosphorylation among infected cells harboring clindamycin-treated T. gondii. The basis for these differences, although unclear at present, are likely intrinsic to the different biological processes targeted by these compounds in the parasite.
T. gondii have developed a variety of strategies to manipulate signal-transduction pathways in the host in order to survive (Sinai et al., 2004; Denkers, 2003; Molestina et al., 2003). Triggering of a “proliferation response” by infection suggests manipulation of the host cell cycle suited to the parasite’s needs by supplying large pools of nutrients. Similar observations have been widely documented with viruses and are increasingly recognized in bacteria (Nougayrede et al., 2005; Oswald et al., 2005). Toxoplasmosis is a significant cause of morbidity and mortality among the immunocompromised (Montoya and Rosso, 2005; Remington et al., 2004). Elucidation of host and parasite factors affecting the cell cycle represents a novel area of investigation that will contribute to our knowledge of host-pathogen interactions and future development of therapeutic strategies. Importantly, the outcome of these studies is not entirely restricted to Toxoplasma, as it may shed light into the pathogenesis of other intracellular pathogens. In the future, the complex mechanisms used by highly adapted parasites to block or subvert cellular processes in the host may become fertile ground to explore fundamental aspects of gene regulation and cell cycle control.
EXPERIMENTAL PROCEDURES
Cell lines and parasite
Human foreskin fibroblasts (HFF; ATCC CRL-2522) were maintained in alpha minimum essential medium supplemented with 7% FBS, 100 U/ml penicillin, 100 μg/ml streptomycin, and 2 mM L-Glutamine (Gibco BRL, Rockville, MD). The RH strain of Toxoplasma gondii with a deletion in the hypoxanthine-xanthine-guanine-phosphoribosyl-transferase gene (Donald et al., 1996) (NIH AIDS Research and Reference Reagent Program) was used exclusively and maintained by serial passage in Vero cells (ATCC CCL-81) as previously described (Sinai et al., 2000).
Cell cycle analysis
HFF were seeded in 6-well plates at 2 × 10⁵ cells per well. Prior to infection, cultures were kept for 5 days until the monolayers reached ≥ 90% confluency. Under these conditions, >80% of cells were in the resting G0/G1 phase. HFF were infected for 24 h with T. gondii at multiplicities of infection (m.o.i.) of 3:1, 5:1, and 10:1. Cells were collected by trypsinization, washed in PBS, and fixed in 70% ethanol. The samples were subsequently stained for 30 min at room temperature in a solution containing 20 μg/ml of propidium iodide (PI), 0.1% (v/v) Triton X-100, and 200 μg/ml of DNase-free RNase (Sigma). Cell cycle profiles were determined by flow cytometry using a using a FACSCalibur system (Becton Dickinson, San Jose, CA). PI was activated by a 488 nm laser, detected at 585 nm, and the data was analyzed using ModFit (Verity Software House, Topsham, ME).
Cell cycle Arrays
Reagents used in gene array experiments including specific primer sets and hybridization membranes were purchased from SuperArray Inc. Confluent monolayers of HFF grown on 10 cm dishes were infected with T. gondii at an m.o.i. of 5:1 for 24 h. Total RNA was isolated and 5 μg used as template for synthesis of [α-32P]dCTP (ICN, Costa Mesa, CA) labeled cDNA probes with a cell cycle array-specific primer set. Hybridization conditions of cDNA probes and calculation of integrated densitometric values (IDV) from cDNA signals hybridized to each gene were performed as described (Molestina et al., 2003). To determine fold differences in gene expression after infection, IDVs were normalized to actin since GAPDH is known to be upregulated by T. gondii infection (Blader et al., 2001). Intensity ratios between infected and uninfected cells were calculated for each gene using the GEArray Analyzer software (SuperArray Inc.). Data were collected from two independent experiments and mean values representing levels of gene expression are shown in Table 1 and supplemental Table 1. Raw data from each array experiment performed for each time point under infection or growth factor stimulation are shown in supplemental Table 2.
RT-PCR analysis
Confluent HFF monolayers in 6 well plates were left untreated, stimulated with EGF (20ng/ml in complete cell culture medium) or infected with T. gondii RH at an m.o.i. of 5:1. Total RNA was isolated using mini RNeasy kit (Qiagen). cDNA was prepared from 1 μg of total RNA using a reverse transcription system (Promega). A 0.75 μl volume of the resulting cDNA was used as the template for conventional PCR, with the exception of the β-actin loading control where the cDNA template was diluted 1:10. Pilot experiments using a dilution series for β-actin identified the amount of template to ensure the absence of a saturated signal under the conditions used (data not shown). PCR was performed using the Reaction Ready Hot Start “sweet” PCR (PA-007) and primers for cyclins A, B, D1, E1, E2 and human β-actin (Catalog # PPH00125A-200, PPH00937E-200, PPH00128E-200, PPH00131A-200, PPH00955E-200 and PPH0073E-200, respectively) were purchased from Superarray. PCR conditions were as follows: 95°C for 15 minutes followed by 28 cycles of 95°C for 15 seconds, 55°C for 30 seconds and 72°C for 30 seconds. PCR products were resolved by agarose gel electrophoresis. The intensities of DNA bands stained with ethidium bromide were quantified using Scion Image (Scion Corporation) and normalized against β-actin. The β-actin signal was in turn normalized to a specific band in a known concentration of the molecular weight marker. This additional normalization was performed to account for the different concentration of ethidium bromide across different gels and within the same gel.
Immunoblot analysis
HFF were seeded in 24-well plates at 4 × 10⁴ cells per well. Prior to infection, cultures were kept for 5 days until the monolayers reached ≥ 90% confluency. Cells were infected with freshly passaged parasites at an m.o.i. of 5:1 for the time points indicated. For short term incubations (1–9 h), the inoculum was centrifuged onto the monolayer at 2000 RPM for 5 min at 4°C to synchronize invasion of cells. Monolayers were lysed in 80 μl of Laemmli buffer and 25 μl of sample were resolved by SDS-PAGE. Following immunoblotting, signals were detected using a chemiluminescence based system (Pierce, Rockford, IL). Antibodies against cyclin E (cat. # sc-481), cyclin A (cat. # sc-751), cyclin B (cat. # sc-245), and β-actin (cat. # sc-7210) were purchased from Santa Cruz Biotechnology. Antibodies against cyclin D1 (cat. # DC56), phosphorylated ERK (cat. # 20G11), and total ERK (cat. # 9102) were purchased from Cell Signaling Technology. Cyclin D1, cyclin E, and β-actin antibodies were diluted 1:600 while the remaining antibodies were used at a 1:1000 dilution.
Blockade of parasite replication
Were indicated, cell cycle profiles determined by FACS and cyclin levels assayed by immunoblot were determined from infected HFF in the presence of 10 μM pyrimethamine. Alternatively, HFF were infected with parasites emerging from a first growth cycle of clindamycin treatment (10 μM) and incubated for the indicated time points in antibiotic-free media. Killing by clindamycin exhibits a “delayed death” phenotype whereby the drug has no effect on parasite survival during a first round of infection. On a second round, however, parasites are able to invade new cells but unable to replicate normally whether clindamycin is present or not (Fichera and Roos, 1997; Fichera et al., 1995). Antibiotics were purchased from Sigma.
Supplementary Material
Suppl. Table 1. Modulation of host cell genes involved in the regulation of the cell cycle by T. gondiia.
Suppl. Table 2. Modulation of host cell genes involved in the regulation of the cell cycle by T. gondiia.
Acknowledgments
We thank Drs. E. Charles Snow and Heide Ford for helpful discussions and for providing antibodies. We thank members of the Sinai laboratory for their comments in the preparation of the manuscript. The technical assistance from the staff of the Core Laboratory of Flow Cytometry at the University of Kentucky College of Medicine is greatly appreciated. This work was supported by NIH grants RO-1 AI49367 (A.P.S.) and F32 AI056970-01 (R.E.M.).
Footnotes
This is an Accepted Work that has been peer-reviewed and approved for publication in the Cellular Microbiology, but has yet to undergo copy-editing and proof correction. See http://www.blackwell-synergy.com/loi/cmi for details. Please cite this article as a “Postprint”; doi: 10.1111/j.1462-5822.2008.01117.x
References
- Blader IJ, Manger ID, Boothroyd JC. Microarray analysis reveals previously unknown changes in Toxoplasma gondii-infected human cells. J Biol Chem. 2001;276:24223–24231. doi: 10.1074/jbc.M100951200. [DOI] [PubMed] [Google Scholar]
- Brunet J, Pfaff AW, Abidi A, Unoki M, Nakamura Y, Guinard M et al. Toxoplasma gondii exploits UHRF1 and induces host cell cycle arrest at G2 to enable its proliferation. Cell Microbiol. 2007 doi: 10.1111/j.1462-5822.2007.01093.x. in press. [DOI] [PubMed] [Google Scholar]
- Camps M, Arrizabalaga G, Boothroyd J. An rRNA mutation identifies the apicoplast as the target for clindamycin in Toxoplasma gondii. Mol Microbiol. 2002;43:1309–1318. doi: 10.1046/j.1365-2958.2002.02825.x. [DOI] [PubMed] [Google Scholar]
- Carpenter G, Cohen S. Human epidermal growth factor and the proliferation of human fibroblasts. J Cell Physiol. 1976;88:227–237. doi: 10.1002/jcp.1040880212. [DOI] [PubMed] [Google Scholar]
- Chai Z, Sarcevic B, Mawson A, Toh BH. SET-related cell division autoantigen-1 (CDA1) arrests cell growth. J Biol Chem. 2001;276:33665–33674. doi: 10.1074/jbc.M007681200. [DOI] [PubMed] [Google Scholar]
- Chang F, Steelman LS, Shelton JG, Lee JT, Navolanic PM, Blalock WL et al. Regulation of cell cycle progression and apoptosis by the Ras/Raf/MEK/ERK pathway (Review) Int J Oncol. 2003;22:469–480. [PubMed] [Google Scholar]
- Chaussabel D, Semnani RT, McDowell MA, Sacks D, Sher A, Nutman TB. Unique gene expression profiles of human macrophages and dendritic cells to phylogenetically distinct parasites. Blood. 2003;102:672–681. doi: 10.1182/blood-2002-10-3232. [DOI] [PubMed] [Google Scholar]
- Coppens I, Dunn JD, Romano JD, Pypaert M, Zhang H, Boothroyd JC, Joiner KA. Toxoplasma gondii sequesters lysosomes from mammalian hosts in the vacuolar space. Cell. 2006;125:261–274. doi: 10.1016/j.cell.2006.01.056. [DOI] [PubMed] [Google Scholar]
- Cortez D, Elledge SJ. Conducting the mitotic symphony. Nature. 2000;406:354–356. doi: 10.1038/35019227. [DOI] [PubMed] [Google Scholar]
- Coverley D, Laman H, Laskey RA. Distinct roles for cyclins E and A during DNA replication complex assembly and activation. Nat Cell Biol. 2002;4:523–528. doi: 10.1038/ncb813. [DOI] [PubMed] [Google Scholar]
- Denkers EY. From cells to signaling cascades: manipulation of innate immunity by Toxoplasma gondii. FEMS Immunol Med Microbiol. 2003;39:193–203. doi: 10.1016/S0928-8244(03)00279-7. [DOI] [PubMed] [Google Scholar]
- Derouin F. Anti-toxoplasmosis drugs. Curr Opin Investig Drugs. 2001;2:1368–1374. [PubMed] [Google Scholar]
- Donald RG, Carter D, Ullman B, Roos DS. Insertional tagging, cloning, and expression of the Toxoplasma gondii hypoxanthine-xanthine-guanine phosphoribosyltransferase gene. Use as a selectable marker for stable transformation. J Biol Chem. 1996;271:14010–14019. doi: 10.1074/jbc.271.24.14010. [DOI] [PubMed] [Google Scholar]
- Dvorak JA, Crane MS. Vertebrate cell cycle modulates infection by protozoan parasites. Science. 1981;214:1034–1036. doi: 10.1126/science.7029713. [DOI] [PubMed] [Google Scholar]
- Ekholm SV, Reed SI. Regulation of G(1) cyclin-dependent kinases in the mammalian cell cycle. Curr Opin Cell Biol. 2000;12:676–684. doi: 10.1016/s0955-0674(00)00151-4. [DOI] [PubMed] [Google Scholar]
- Fesquet D, Labbe JC, Derancourt J, Capony JP, Galas S, Girard F et al. The MO15 gene encodes the catalytic subunit of a protein kinase that activates cdc2 and other cyclin-dependent kinases (CDKs) through phosphorylation of Thr161 and its homologues. Embo J. 1993;12:3111–3121. doi: 10.1002/j.1460-2075.1993.tb05980.x. [DOI] [PMC free article] [PubMed] [Google Scholar]
- Fichera ME, Roos DS. A plastid organelle as a drug target in apicomplexan parasites. Nature. 1997;390:407–409. doi: 10.1038/37132. [DOI] [PubMed] [Google Scholar]
- Fichera ME, Bhopale MK, Roos DS. In vitro assays elucidate peculiar kinetics of clindamycin action against Toxoplasma gondii. Antimicrob Agents Chemother. 1995;39:1530–1537. doi: 10.1128/aac.39.7.1530. [DOI] [PMC free article] [PubMed] [Google Scholar]
- Gashler A, Sukhatme VP. Early growth response protein 1 (Egr-1): prototype of a zinc-finger family of transcription factors. Prog Nucleic Acid Res Mol Biol. 1995;50:191–224. doi: 10.1016/s0079-6603(08)60815-6. [DOI] [PubMed] [Google Scholar]
- Georgiev VS. Management of toxoplasmosis. Drugs. 1994;48:179–188. doi: 10.2165/00003495-199448020-00005. [DOI] [PubMed] [Google Scholar]
- Gilbert LA, Ravindran S, Turetzky JM, Boothroyd JC, Bradley PJ. Toxoplasma gondii targets a protein phosphatase 2C to the nuclei of infected host cells. Eukaryot Cell. 2007;6:73–83. doi: 10.1128/EC.00309-06. [DOI] [PMC free article] [PubMed] [Google Scholar]
- Grimwood J, Mineo JR, Kasper LH. Attachment of Toxoplasma gondii to host cells is host cell cycle dependent. Infect Immun. 1996;64:4099–4104. doi: 10.1128/iai.64.10.4099-4104.1996. [DOI] [PMC free article] [PubMed] [Google Scholar]
- Gu Y, Rosenblatt J, Morgan DO. Cell cycle regulation of CDK2 activity by phosphorylation of Thr160 and Tyr15. Embo J. 1992;11:3995–4005. doi: 10.1002/j.1460-2075.1992.tb05493.x. [DOI] [PMC free article] [PubMed] [Google Scholar]
- Guergnon J, Chaussepied M, Sopp P, Lizundia R, Moreau MF, Blumen B et al. A tumour necrosis factor alpha autocrine loop contributes to proliferation and nuclear factor-kappaB activation of Theileria parva-transformed B cells. Cell Microbiol. 2003;5:709–716. doi: 10.1046/j.1462-5822.2003.00314.x. [DOI] [PubMed] [Google Scholar]
- Guttridge DC, Albanese C, Reuther JY, Pestell RG, Baldwin AS., Jr NF-kappaB controls cell growth and differentiation through transcriptional regulation of cyclin D1. Mol Cell Biol. 1999;19:5785–5799. doi: 10.1128/mcb.19.8.5785. [DOI] [PMC free article] [PubMed] [Google Scholar]
- Heussler VT, Kuenzi P, Fraga F, Schwab RA, Hemmings BA, Dobbelaere DA. The Akt/PKB pathway is constitutively activated in Theileria- transformed leucocytes, but does not directly control constitutive NF-kappaB activation. Cell Microbiol. 2001;3:537–550. doi: 10.1046/j.1462-5822.2001.00134.x. [DOI] [PubMed] [Google Scholar]
- Hill D, Dubey JP. Toxoplasma gondii: transmission, diagnosis and prevention. Clin Microbiol Infect. 2002;8:634–640. doi: 10.1046/j.1469-0691.2002.00485.x. [DOI] [PubMed] [Google Scholar]
- Hinz M, Krappmann D, Eichten A, Heder A, Scheidereit C, Strauss M. NF-kappaB function in growth control: regulation of cyclin D1 expression and G0/G1-to-S-phase transition. Mol Cell Biol. 1999;19:2690–2698. doi: 10.1128/mcb.19.4.2690. [DOI] [PMC free article] [PubMed] [Google Scholar]
- Joyce D, Bouzahzah B, Fu M, Albanese C, D’Amico M, Steer J et al. Integration of Rac-dependent regulation of cyclin D1 transcription through a nuclear factor-kappaB-dependent pathway. J Biol Chem. 1999;274:25245–25249. doi: 10.1074/jbc.274.36.25245. [DOI] [PubMed] [Google Scholar]
- Juan G, Traganos F, James WM, Ray JM, Roberge M, Sauve DM et al. Histone H3 phosphorylation and expression of cyclins A and B1 measured in individual cells during their progression through G2 and mitosis. Cytometry. 1998;32:71–77. doi: 10.1002/(sici)1097-0320(19980601)32:2<71::aid-cyto1>3.0.co;2-h. [DOI] [PubMed] [Google Scholar]
- Koff A, Giordano A, Desai D, Yamashita K, Harper JW, Elledge S et al. Formation and activation of a cyclin E-cdk2 complex during the G1 phase of the human cell cycle. Science. 1992;257:1689–1694. doi: 10.1126/science.1388288. [DOI] [PubMed] [Google Scholar]
- Kuenzi P, Schneider P, Dobbelaere DA. Theileria parva-transformed T cells show enhanced resistance to Fas/Fas ligand-induced apoptosis. J Immunol. 2003;171:1224–1231. doi: 10.4049/jimmunol.171.3.1224. [DOI] [PubMed] [Google Scholar]
- Lee CH, Yun HJ, Kang HS, Kim HD. ERK/MAPK pathway is required for changes of cyclin D1 and B1 during phorbol 12-myristate 13-acetate-induced differentiation of K562 cells. IUBMB Life. 1999;48:585–591. doi: 10.1080/713803574. [DOI] [PubMed] [Google Scholar]
- Luft BJ, Remington JS. Toxoplasmic encephalitis in AIDS. Clin Infect Dis. 1992;15:211–222. doi: 10.1093/clinids/15.2.211. [DOI] [PubMed] [Google Scholar]
- Molestina RE, Sinai AP. Host and parasite-derived IKK activities direct distinct temporal phases of NF-{kappa}B activation and target gene expression following Toxoplasma gondii infection. J Cell Sci. 2005;118:5785–5796. doi: 10.1242/jcs.02709. [DOI] [PubMed] [Google Scholar]
- Molestina RE, Payne TM, Coppens I, Sinai AP. Activation of NF-kappaB by Toxoplasma gondii correlates with increased expression of antiapoptotic genes and localization of phosphorylated IkappaB to the parasitophorous vacuole membrane. J Cell Sci. 2003;116:4359–4371. doi: 10.1242/jcs.00683. [DOI] [PubMed] [Google Scholar]
- Montoya JG, Rosso F. Diagnosis and management of toxoplasmosis. Clin Perinatol. 2005;32:705–726. doi: 10.1016/j.clp.2005.04.011. [DOI] [PubMed] [Google Scholar]
- Morgan DO, Fisher RP, Espinoza FH, Farrell A, Nourse J, Chamberlin H, Jin P. Control of eukaryotic cell cycle progression by phosphorylation of cyclin-dependent kinases. Cancer J Sci Am. 1998;4(Suppl 1):S77–83. [PubMed] [Google Scholar]
- Nelson MM, Jones AR, Carmen JC, Sinai AP, Burchmore R, Wastling JM. Modulation of the host cell proteome by the intracellular apicomplexan parasite Toxoplasma gondii. Infect Immun. 2007 doi: 10.1128/IAI.0115-07. in press. [DOI] [PMC free article] [PubMed] [Google Scholar]
- Nilsson I, Hoffmann I. Cell cycle regulation by the Cdc25 phosphatase family. Prog Cell Cycle Res. 2000;4:107–114. doi: 10.1007/978-1-4615-4253-7_10. [DOI] [PubMed] [Google Scholar]
- Nougayrede JP, Taieb F, De Rycke J, Oswald E. Cyclomodulins: bacterial effectors that modulate the eukaryotic cell cycle. Trends Microbiol. 2005;13:103–110. doi: 10.1016/j.tim.2005.01.002. [DOI] [PubMed] [Google Scholar]
- Op De Beeck A, Caillet-Fauquet P. Viruses and the cell cycle. Prog Cell Cycle Res. 1997;3:1–19. doi: 10.1007/978-1-4615-5371-7_1. [DOI] [PubMed] [Google Scholar]
- Oswald E, Nougayrede JP, Taieb F, Sugai M. Bacterial toxins that modulate host cell-cycle progression. Curr Opin Microbiol. 2005;8:83–91. doi: 10.1016/j.mib.2004.12.011. [DOI] [PubMed] [Google Scholar]
- Payne TM, Molestina RE, Sinai AP. Inhibition of caspase activation and a requirement for NF-kappaB function in the Toxoplasma gondii-mediated blockade of host apoptosis. J Cell Sci. 2003;116:4345–4358. doi: 10.1242/jcs.00756. [DOI] [PubMed] [Google Scholar]
- Pines J. Cyclins and their associated cyclin-dependent kinases in the human cell cycle. Biochem Soc Trans. 1993;21:921–925. doi: 10.1042/bst0210921. [DOI] [PubMed] [Google Scholar]
- Radke JR, Striepen B, Guerini MN, Jerome ME, Roos DS, White MW. Defining the cell cycle for the tachyzoite stage of Toxoplasma gondii. Mol Biochem Parasitol. 2001;115:165–175. doi: 10.1016/s0166-6851(01)00284-5. [DOI] [PubMed] [Google Scholar]
- Radke JR, Donald RG, Eibs A, Jerome ME, Behnke MS, Liberator P, White MW. Changes in the expression of human cell division autoantigen-1 influence Toxoplasma gondii growth and development. PLoS Pathog. 2006;2:e105. doi: 10.1371/journal.ppat.0020105. [DOI] [PMC free article] [PubMed] [Google Scholar]
- Ravenhall C, Guida E, Harris T, Koutsoubos V, Stewart A. The importance of ERK activity in the regulation of cyclin D1 levels and DNA synthesis in human cultured airway smooth muscle. Br J Pharmacol. 2000;131:17–28. doi: 10.1038/sj.bjp.0703454. [DOI] [PMC free article] [PubMed] [Google Scholar]
- Remington JS, Thulliez P, Montoya JG. Recent developments for diagnosis of toxoplasmosis. J Clin Microbiol. 2004;42:941–945. doi: 10.1128/JCM.42.3.941-945.2004. [DOI] [PMC free article] [PubMed] [Google Scholar]
- Rosenblatt J, Gu Y, Morgan DO. Human cyclin-dependent kinase 2 is activated during the S and G2 phases of the cell cycle and associates with cyclin A. Proc Natl Acad Sci U S A. 1992;89:2824–2828. doi: 10.1073/pnas.89.7.2824. [DOI] [PMC free article] [PubMed] [Google Scholar]
- Saeij JP, Coller S, Boyle JP, Jerome ME, White MW, Boothroyd JC. Toxoplasma co-opts host gene expression by injection of a polymorphic kinase homologue. Nature. 2007;445:324–327. doi: 10.1038/nature05395. [DOI] [PMC free article] [PubMed] [Google Scholar]
- Schwartz GK. CDK inhibitors: cell cycle arrest versus apoptosis. Cell Cycle. 2002;1:122–123. doi: 10.4161/cc.1.2.115. [DOI] [PubMed] [Google Scholar]
- Sherr CJ, Roberts JM. CDK inhibitors: positive and negative regulators of G1-phase progression. Genes Dev. 1999;13:1501–1512. doi: 10.1101/gad.13.12.1501. [DOI] [PubMed] [Google Scholar]
- Silverman ES, Collins T. Pathways of Egr-1-mediated gene transcription in vascular biology. Am J Pathol. 1999;154:665–670. doi: 10.1016/S0002-9440(10)65312-6. [DOI] [PMC free article] [PubMed] [Google Scholar]
- Sinai AP, Paul S, Rabinovitch M, Kaplan G, Joiner KA. Coinfection of fibroblasts with Coxiella burnetti and Toxoplasma gondii: to each their own. Microbes Infect. 2000;2:727–736. doi: 10.1016/s1286-4579(00)90362-9. [DOI] [PubMed] [Google Scholar]
- Sinai AP, Payne TM, Carmen JC, Hardi L, Watson SJ, Molestina RE. Mechanisms underlying the manipulation of host apoptotic pathways by Toxoplasma gondii. Int J Parasitol. 2004;34:381–391. doi: 10.1016/j.ijpara.2003.11.009. [DOI] [PubMed] [Google Scholar]
- Steelman LS, Pohnert SC, Shelton JG, Franklin RA, Bertrand FE, McCubrey JA. JAK/STAT, Raf/MEK/ERK, PI3K/Akt and BCR-ABL in cell cycle progression and leukemogenesis. Leukemia. 2004;18:189–218. doi: 10.1038/sj.leu.2403241. [DOI] [PubMed] [Google Scholar]
- Stevaux O, Dyson NJ. A revised picture of the E2F transcriptional network and RB function. Curr Opin Cell Biol. 2002;14:684–691. doi: 10.1016/s0955-0674(02)00388-5. [DOI] [PubMed] [Google Scholar]
- Tenter AM, Heckeroth AR, Weiss LM. Toxoplasma gondii: from animals to humans. Int J Parasitol. 2000;30:1217–1258. doi: 10.1016/s0020-7519(00)00124-7. [DOI] [PMC free article] [PubMed] [Google Scholar]
- Thiel G, Cibelli G. Regulation of life and death by the zinc finger transcription factor Egr-1. J Cell Physiol. 2002;193:287–292. doi: 10.1002/jcp.10178. [DOI] [PubMed] [Google Scholar]
- Tobey RA, Valdez JG, Crissman HA. Synchronization of human diploid fibroblasts at multiple stages of the cell cycle. Exp Cell Res. 1988;179:400–416. doi: 10.1016/0014-4827(88)90279-0. [DOI] [PubMed] [Google Scholar]
- Tobey RA, Oishi N, Crissman HA. Cell cycle synchronization: reversible induction of G2 synchrony in cultured rodent and human diploid fibroblasts. Proc Natl Acad Sci U S A. 1990;87:5104–5108. doi: 10.1073/pnas.87.13.5104. [DOI] [PMC free article] [PubMed] [Google Scholar]
- Vousden KH. Interactions between papillomavirus proteins and tumor suppressor gene products. Adv Cancer Res. 1994;64:1–24. doi: 10.1016/s0065-230x(08)60833-7. [DOI] [PubMed] [Google Scholar]
- Yam CH, Fung TK, Poon RY. Cyclin A in cell cycle control and cancer. Cell Mol Life Sci. 2002;59:1317–1326. doi: 10.1007/s00018-002-8510-y. [DOI] [PMC free article] [PubMed] [Google Scholar]
- Zhou BB, Elledge SJ. The DNA damage response: putting checkpoints in perspective. Nature. 2000;408:433–439. doi: 10.1038/35044005. [DOI] [PubMed] [Google Scholar]
Associated Data
This section collects any data citations, data availability statements, or supplementary materials included in this article.
Supplementary Materials
Suppl. Table 1. Modulation of host cell genes involved in the regulation of the cell cycle by T. gondiia.
Suppl. Table 2. Modulation of host cell genes involved in the regulation of the cell cycle by T. gondiia.