The three-dimensional reconstruction program DAMMIN has been applied to time-resolved small-angle X-ray scattering data. The results are presented and their success in representing the molecules is assessed.
Keywords: time resolution, small-angle X-ray scattering (SAXS), shape reconstruction, biomolecules, biomolecular folding
Abstract
Modern computing power has made it possible to reconstruct low-resolution, three-dimensional shapes from solution small-angle X-ray scattering (SAXS) data on biomolecules without a priori knowledge of the structure. In conjunction with rapid mixing techniques, SAXS has been applied to time resolve conformational changes accompanying important biological processes, such as biomolecular folding. In response to the widespread interest in SAXS reconstructions, their value in conjunction with such time-resolved data has been examined. The group I intron from Tetrahymena thermophila and its P4–P6 subdomain are ideal model systems for investigation owing to extensive previous studies, including crystal structures. The goal of this paper is to assay the quality of reconstructions from time-resolved data given the sacrifice in signal-to-noise required to obtain sharp time resolution.
1. Introduction
Solution small-angle X-ray scattering (SAXS) provides low-resolution structural information about biomolecules. Geometrical parameters, such as radius of gyration ( ), fractal dimension or surface-to-volume ratio, are extracted from SAXS data by examining different regions of the scattering curve (Guinier & Fournet, 1955 ▶). Additional structural information is inferred through comparison of the scattering curve, I(
 ), or its Fourier inverse, p(r), with models and other data. However, in recent years modern computing power has made it possible to reconstruct a three-dimensional molecular shape whose scattering coincides with measured profiles over the entire range of a scattering curve (Svergun, 1999 ▶; Walther et al., 2000 ▶; Chacón et al., 2000 ▶; Heller et al., 2002 ▶). In addition, these ab initio algorithms allow users to propose molecular shapes without relying on previous knowledge. These reconstruction programs have produced shape envelopes for many proteins (Svergun & Koch, 2002 ▶; Grossmann, 2007 ▶) and nucleic acids (Nöllmann et al., 2004 ▶; Funari et al., 2000 ▶), enabling straightforward comparison between SAXS measurements and structural models.
Conformational changes in biomolecules, including folding, can be induced by solvent exchange through mixing. Commercially available stopped-flow mixers as well as continuous-flow microfluidic mixers have been interfaced with SAXS instrumentation to acquire time-resolved measurements of events such as protein and RNA folding (Moody et al., 1980 ▶; Tsuruta et al., 1989 ▶; Pollack et al., 1999 ▶; Fang et al., 2000 ▶; Russell et al., 2002 ▶; Akiyama et al., 2002 ▶). Such data are traditionally presented as sets of curves, showing scattering intensity as a function of scattering angle, acquired at different times after the initiation of folding. Alternatively, the time dependence of a single parameter, such as  , may be used to represent the results.
The information provided by time-resolved SAXS measurements, such as the global structures of transient conformational states, is not readily accessible to other techniques. The goal of this study is to evaluate the limits of applicability of reconstruction methods to time-resolved data by providing examples and discussing the pros and cons of this approach, in particular addressing two primary concerns. First, owing to practical limits on sample consumption, time-resolved data are noisy. Noise can mask structural information or worse, be interpreted as actual curvature leading to inaccurate features in the reconstruction. Second, SAXS is an ensemble measurement, naturally sampling all molecular states present in solution. It is unclear how a single reconstruction reflects the mixture of states present in a solution, for example, when folded and unfolded molecules coexist.
In an attempt to answer these questions, we reconstructed time-resolved data for two related systems. The P4–P6 subdomain of the group I intron from Tetrahymena thermophila is a relatively simple RNA. Though studies of folding that probe local structure reveal additional subtle features, the large-scale process reported by SAXS occurs as a single, two-state collapse (Schlatterer et al., 2008 ▶). The entire Tetrahymena thermophila ribozyme has a more complex fold (Das et al., 2003 ▶). Both molecules have been extensively studied (Pan et al., 1999 ▶; Rook et al., 1999 ▶), and their folded states crystallized in full and in large part, respectively (Cate et al., 1996 ▶; Guo et al., 2004 ▶), making them ideal examples of simple and complex molecules. For both constructs we have collected time-resolved scattering data and reconstructed structures along the Mg -induced folding pathways. More traditional analyses of these data have provided insight into folding trajectories and have been previously published (Kwok et al., 2006 ▶; Schlatterer et al., 2008 ▶). Here we present reconstructions of these data and compare them with shapes derived from crystal structures of the molecules, to assay the value of reconstruction methods in conjunction with the changing molecular shapes that accompany folding.
2. Methods
2.1. Sample preparation
The L-21 sca I construct of the Tetrahymena ribozyme and P4–P6 subdomain were prepared by in vitro transcription as described by Russell & Herschlag (1999 ▶). Prior to mixing with MgCl , full-length constructs were stored in a solution of 10 mM K
 MOPS pH 7.0 plus 100 mM KCl, and P4–P6 samples were stored in 50 mM K
 MOPS buffer pH 7.0. All RNA samples were annealed shortly before data collection by heating to 363 K for 1 min. This procedure ensured an initial state absent of tertiary structure.
2.2. X-ray data collection
2.2.1. APS
Data for both constructs were acquired on time scales ranging from 1.3 to 168 ms at the 8-ID I beamline at the Advanced Photon Source (APS) using a microfluidic mixer as described by Kwok et al. (2006 ▶). Tertiary structure acquisition was initiated by diffusive mixing with a solution containing 10 mM MgCl in addition to buffering ions matching those in the RNA solution. Up to 25 30 s images of RNA scattering were acquired at each time point, along with a comparable number of buffer background images. The large number was required to ensure sufficient signal-to-noise given the micrometre-scale sample size of the jet containing RNA.
2.2.2. CHESS
Time points of 157 ms and longer were collected at the G1 station of the Cornell High Energy Synchrotron Source (CHESS) using a modified SFM-4 stopped-flow mixer from Biologic (France). The details are also described by Kwok et al. (2006 ▶). Four 100  s images were acquired for each sample, along with buffer background images. Owing to aggregation of P4–P6 on the 100 ms time scale (Schlatterer et al., 2008 ▶), only the full-length construct was studied by stopped-flow.
2.3. Data Analysis
2.3.1. Initial data reduction
Initial data reduction was carried out using Matlab (The MathWorks Inc., Natick, MA, USA) following procedures described by Kwok et al. (2006 ▶). Images were radially integrated to yield scattering intensity versus the momentum transfer vector  , where
  is the scattering angle. Multiple scattering curves acquired at each time point, as outlined above, were checked for consistency before averaging and subtraction of the solution background. Portions of the curves deemed unreliable at the lowest
  because of parasitic scatter and at the highest
  because of low signal-to-background were removed before beginning reconstructions. The radius of gyration (
 ) was calculated for each curve from the scattering at the lowest angles (Guinier & Fournet, 1955 ▶).
2.3.2. Reconstructions
Reconstructions were produced using software made available by the Biological Small Angle Scattering group at the European Molecular Biology Laboratory (Konarev et al., 2006 ▶). GNOM (Svergun, 1992 ▶) generates a smooth representation of scattering intensity as a function of  , which is required as input for the reconstruction program. In this process the user must specify a maximum dimension (
 ). We generally set this parameter to be 5 Å larger than the number that maximized the default regularization parameters which GNOM uses to quantify a reasonable profile. This practice ensures that the shape is reconstructed within a sufficiently large sphere. The reconstruction program DAMMIN (Svergun, 1999 ▶) was run ten times in slow mode on the Cornell Center for Materials Science 30-node cluster. The runs, which required 12–24 h, were processed in parallel so the entire operation required only one day. The three-dimensional results were averaged using DAMAVER. In addition to an averaged reconstruction, DAMAVER produced a quantitative measure of the agreement between the ten individual shapes, the mean normalized spatial discrepancy (MNSD). A small MNSD indicates consistency between the ten individual reconstructions and thus a unique solution to the scattering curve. Finally, the averaged bead models were processed by Situs (Wriggers & Chacón, 2001 ▶) to generate a single surface envelope.
3. Results
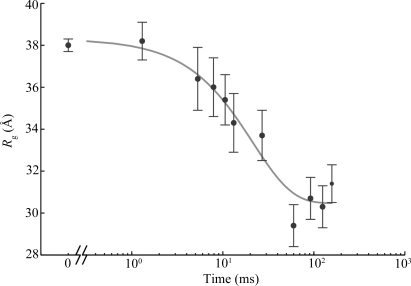
The P4–P6 domain folds in isolation, independent of the remaining structural elements of the Tetrahymena ribozyme. Cate et al. (1996 ▶) reported the crystal structure and Lipfert et al. (2007 ▶) presented static reconstructions of this ∼160 nucleotide domain. Time-resolved SAXS studies have shown that global folding is accurately described by a two-state model, in which linear combinations of the folded and unfolded scattering curves can accurately reproduce the scattering of the intermediate time points (Schlatterer et al., 2008 ▶). A plot of  versus time after mixing with Mg
 fits a single exponential equation, consistent with a single-phase collapse of the molecule (Fig. 1 ▶). Crystal structures reveal that the major feature of the folded state is a 150° bend near the middle of the RNA helix. Electrostatic repulsion in the initial, low-salt state restricts the shape of the RNA molecule to extended conformations (Das et al., 2003 ▶). Thus P4–P6 folding as observed by SAXS can be treated as a two-state process where, upon the addition of Mg
 , P4–P6 folds nearly in half. This bent structure is stabilized by native tertiary contacts (Schlatterer et al., 2008 ▶).
Figure 1.
Radius of gyration ( ) versus time for the P4–P6 subdomain. The points are calculated from fits to the Guinier region of the data (Guinier & Fournet, 1955 ▶), with the errors being determined by the 95% confidence intervals. The black line is the fit of the equation
 with
with  ,
,  and
and  ms. When measured by SAXS, P4–P6 folding is accurately described by a single exponential; thus the global compaction of P4–P6 is apparently a two-state process.
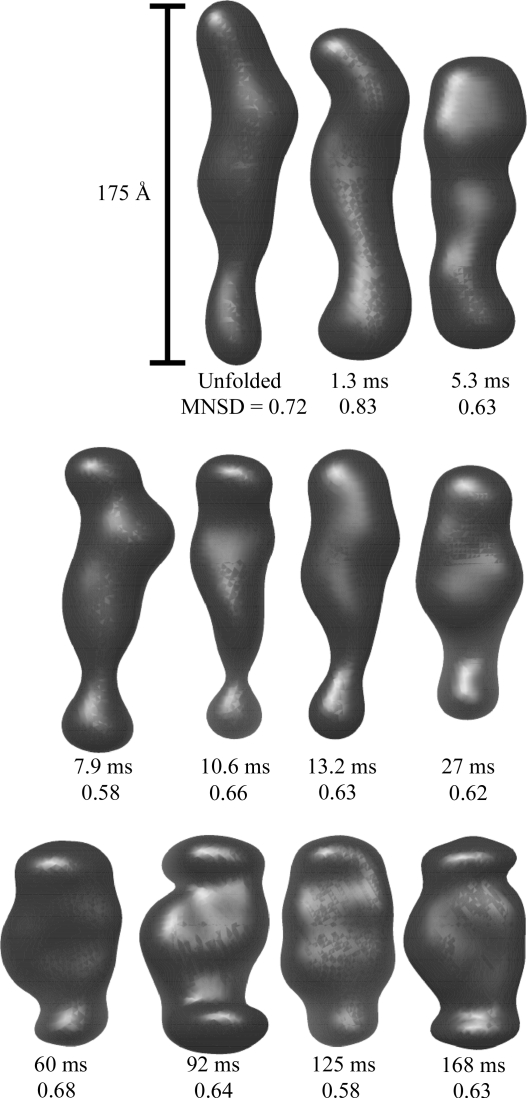
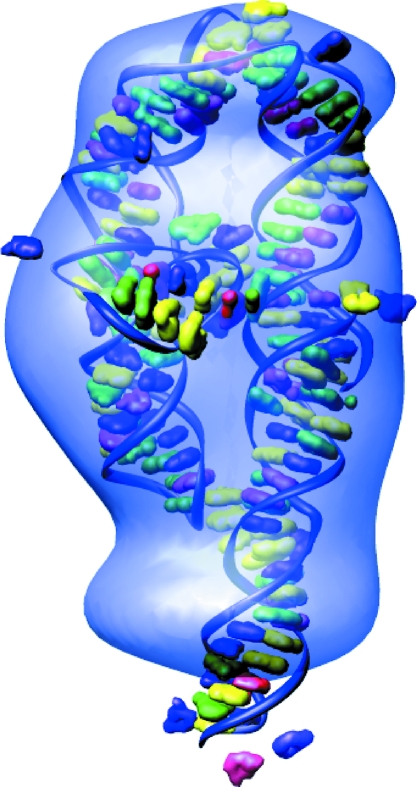
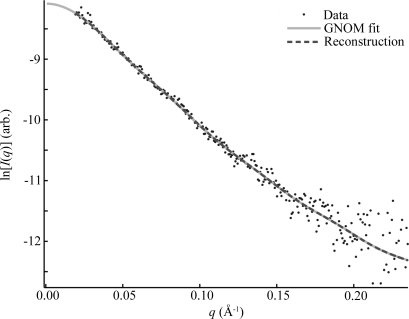
We reconstructed shapes reported by each time-resolved SAXS profile acquired during P4–P6 folding. The initial SAXS data for these reconstructions are presented in the supplementary material of Schlatterer et al. (2008 ▶). These structures, pictured in Fig. 2 ▶, indicate a progression from a thin, elongated structure to a more compact state, consistent with the folding model described above. Additionally, the final state can be docked into the crystal structure (Cate et al., 1996 ▶) as shown in Fig. 3 ▶. The agreement between the ten individual reconstructions for each curve, indicated quantitatively by the MNSD, is good. The large-scale features of the reconstructions reproduce well over the set; however, smaller features vary from one reconstruction to the next. A typical comparison of the theoretical scattering curves of the reconstructions to the GNOM fit and the data, shown in Fig. 4 ▶, demonstrates the fit of both GNOM and the reconstructions to the data. To quantify the agreement we computed the signal-to-noise ratio (S/N) as
where the output from GNOM was used as the fit. While the overall S/N was 27, quite good, the same analysis carried out on subsections of the data makes clear the lower S/N in the high- range, as demonstrated in Table 1 ▶. The noise in the data manifests itself as minor features in the curves output by GNOM. These features are unlikely to represent physical structure, but DAMMIN fits every feature in the GNOM curve precisely (Fig. 4 ▶). To compare calculated scatter from DAMMIN to the GNOM curve and the data, we define the mean discrepancy (MD) between two curves, as
where  and
and  are two curves and N is the total number of data points in each curve. The MD between the data and the GNOM fit is
  , but the MD between the GNOM fit and the DAMMIN reconstruction is
  , over an order of magnitude smaller. This difference demonstrates the strong dependence of the reconstructions on the GNOM interpretation of the data.
Figure 2.
Averaged reconstructions of the P4–P6 subdomain. Each shape is labeled with the time elapsed since mixing and the MNSD value that reflects the uniqueness of the reconstruction. While the MNSDs of two shapes are larger than 0.7, examination of the individual reconstructions (not shown) confirms that the averages represent the ensembles. All reconstructions are depicted on the same spatial scale.
Figure 3.
Comparison of the P4–P6 reconstruction with the crystal structure. The reconstruction of folded P4–P6 (∼150 ms after folding) is docked with the crystal structure of Protein Data Bank code 1gid (Cate et al., 1996 ▶), showing the agreement between the two. Situs (Wriggers & Chacón, 2001 ▶) was employed to find the best match between the two structures.
Figure 4.
GNOM and DAMMIN fits to the experimental data. This plot demonstrates the quality of typical fits to the data by both GNOM and DAMMIN. The dots represent 10.6 ms P4–P6 folding data, which have been scaled by a beam intensity monitor to account for small changes in X-ray intensity. The solid line is the GNOM fit to this data, and the dashed line is calculated from a single reconstruction, both of which are scaled to match the data by the programs that produced them. The curve found by GNOM fits the data well within the noise, but the noise is large compared with the precision of the reconstruction, which leaves room for error. DAMMIN and GNOM curves are indistinguishable, demonstrating how precisely the reconstruction fits the GNOM representation of the data. The consequences of these observations are discussed in the text.
Table 1. Calculated S/N for different regions of the 158 ms P4–P6 scattering curve.
While the S/N is high for most of the curve, in the high- regions where the information about small molecular features is available, the S/N approaches 1. This increases the chances that noise will be misinterpreted as signal in the reconstruction process
 range (Å range (Å ) ) |
S/N |
|---|---|
| 0.019–0.062 | 39.3 |
| 0.063–0.106 | 40.0 |
| 0.107–0.151 | 15.1 |
| 0.151–0.195 | 5.9 |
| 0.196–0.238 | 1.5 |
Of particular note is the reconstruction of the scattering curve taken 27 ms after the initiation of folding. This data point was acquired near the mid-point of the compaction illustrated in Fig. 1 ▶ and, according to a two-state fit, is approximately 63% unfolded (Schlatterer et al., 2008 ▶). The structure is not as elongated as that of unfolded P4–P6 but longer and thinner than the fully folded construct. A single half-folded P4–P6 molecule would probably have the ends of the helix separated by a 90° bend. In contrast, this structure is consistent with a roughly equal mixture of initial and final states present in the solution. Thus the reconstruction represents a spatial mean of the ensemble rather than an actual physical state of the molecule. In summary, this series of time-resolved reconstructions depicts with large-scale accuracy the averaged process of P4–P6 folding.
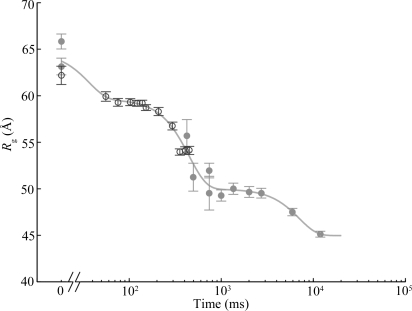
While the P4–P6 domain is a smaller molecule with a relatively simple structure, the full-length Tetrahymena ribozyme contains many helices to locate. Owing to its complex secondary structure, the unfolded state is harder to predict without detailed modeling, and likely corresponds to an ensemble of states. The  versus time curve, shown in Fig. 5 ▶, is likewise more complex. In this case folding takes several minutes. Three distinct collapse phases are observed under the experimental conditions employed, indicating the existence of two long-lived intermediates in addition to the initial and final states. In an effort to capture and characterize a true time-resolved intermediate state, we reconstructed only points where the
  of the molecule was not rapidly changing.
Figure 5.
Folding time course for the full-length ribozyme. The points are calculated from a fit to the Guinier region of the data (Guinier & Fournet, 1955 ▶), with the errors being determined by the 95% confidence intervals. The solid line is a fit to the expression  =
= 
 +
+  +
+  +
+  , where
  ,
,  ,
,  ,
,  ,
,  ms,
ms,  ms and
  ms. Radius of gyration versus time for the Tetrahymena ribozyme shows two long-lived intermediates on the folding pathway. Open circles correspond to data points acquired at the APS with the continuous-flow mixer; filled circles represent data collected with a stopped-flow mixer at CHESS.
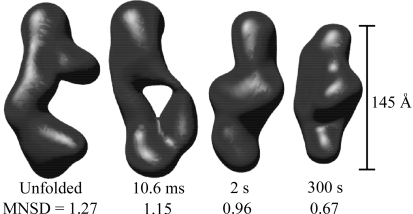
The resulting averaged shape envelopes, as well as the associated MNSD values, are displayed in Fig. 6 ▶. According to Volkov & Svergun (2003 ▶) an MNSD of less than 0.7 indicates ideal agreement between individual reconstructions. In general, we have found this to be true, though when the MNSD is less than 1 strong similarities between different constructs are observed. For this data set, we found the MNSD decreased as folding progressed. Only the final state had an MNSD of less than 0.7.
Figure 6.
Reconstructions for selected time points during folding of the full-length ribozyme. This figure indicates the time elapsed since mixing and shows the MNSD between ten individual reconstructions of scattering states along the folding pathway of the ribozyme. The initial and final states are shown, along with two states that correspond to the measured plateaus in the curve of  versus time.
4. Discussion
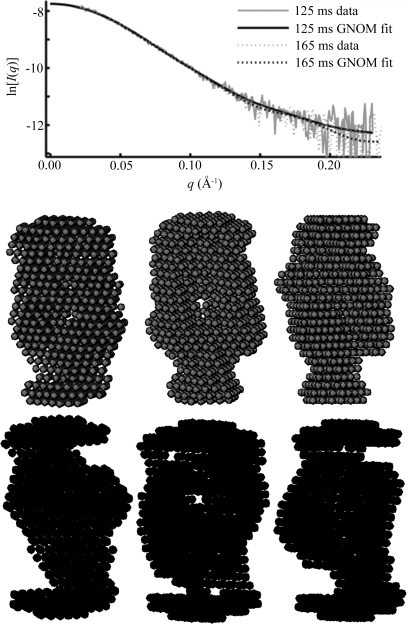
The first of our initial goals was to determine whether the noise present would prevent accurate reconstruction of time-resolved data. Our results address this question. In the case of P4–P6 folding, GNOM produces smooth curves which fit the data reasonably well and reflect the overall differences in the SAXS curves measured at different times after folding, despite noise in the data. Reconstructing with DAMMIN then produces shapes consistent on a large scale with data from the crystal structure and models. Variations between the reconstructions on a smaller scale are less reliable. For example, shape envelopes of the 92 and 168 ms time points from P4–P6 folding resemble each other much more closely than that of the intermediate 125 ms data point. Such a switch in an ensemble measurement cannot be physical. Fig. 7 ▶ demonstrates that some of these differences are inherent in the fitted intensity curves. Therefore small deviations may arise from noise in the scattering data since it cannot be fitted to the precision with which the GNOM curve is reconstructed.
Figure 7.
Variations in reconstructions of P4–P6. Above is a plot showing differences that arise in the GNOM fit to P4–P6 data acquired at 125 and 168 ms after folding was initiated. The GNOM fit shows variation in the high- region, despite the underlying data being nearly identical within the noise. Below are three individual reconstructions each for the 125 ms (upper) and 168 ms (lower) data. Although there is variation between the models reconstructed from a single curve, the variation is greater between the top and bottom sets of models. This is also reflected quantitatively in the MNSD, which is 0.58 and 0.63 for the 125 and 168 ms points, respectively, but 0.69 between shapes from the different reconstructions, slightly higher. Thus, in spite of the overall similarity in the data, models at these two time points reconstruct to slightly different shapes.
These inconsistencies might be mitigated by removing some of the highest- data. In fact, the DAMMIN manual cautions against including the outer portions of all scattering curves, but leaves it to the user to determine appropriate cutoffs, which depend on the details of each experiment. To test the effect of excluding the weak part of the signal, we repeated the reconstruction procedure on the three longest time curves mentioned above after removing the data at
  Å
Å where the output from GNOM showed the greatest variation. The signal-to-noise ratio for the eliminated data averages to ∼2, while the S/N of the remaining scatter increases by approximately 8. Qualitatively, these reconstructions appear to show less detail (supplementary data1). However, all three spatial averages had a smaller MNSD than their lower-S/N counterparts and we found greater agreement between them. Thus, although some information can be provided by noisy data, there is clearly a point at which the increase in noise leads to inaccuracy. In these cases the data are better removed.
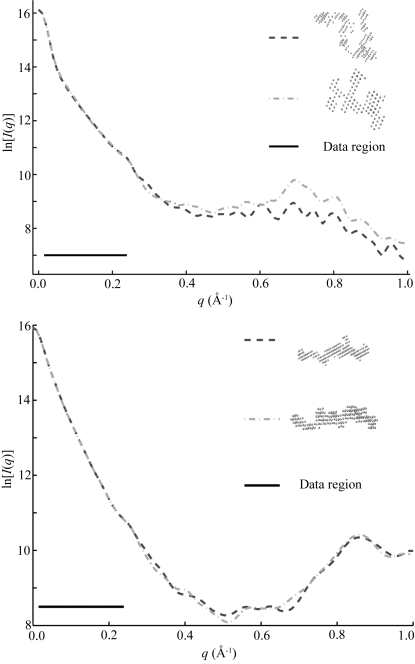
Of all of the states studied, the unfolded ribozyme is the most challenging to reconstruct. Ten reconstructions of this initial scattering curve produced ten different shapes, as evidenced by the large MNSD of the spatial average. Because this complex, unfolded molecule is not mechanically constrained, it is tempting to attribute variations of the reconstructions to supposed heterogeneity of the molecular ensemble. However, the calculated scattering curves for the individual reconstructions agree well with the data in the range of the measurements, as shown in Fig. 8 ▶. Therefore, with this experimental resolution, the SAXS data alone do not exclude the possibility that any one of the individual reconstructions might accurately represent the entire ensemble. However, if the scattering profiles of the reconstructed shapes are computed beyond the experimentally accessed range, differences are seen. Initially it may seem counterintuitive that important information exists at high  for a larger molecule, but the extended nature of the state demands measurements over a broad range of length scales (e.g. to high angle) to describe it completely. Unfortunately, the signal-to-noise is poor at high scattering angles, especially for time-resolved experiments, and as already demonstrated the high-
 data must contain sufficient S/N to be useful.
Figure 8.
Variations between reconstructions from the same SAXS data. This figure shows calculated scattering intensities for the most widely varying reconstructions of the scattering data representing unfolded molecules. The black line in both figures indicates the range over which we have acquired data, from approximately  Å
Å to
to  Å
Å . Top: Although these reconstructed models for the full-length ribozyme are very different, we note that the scattering profiles of both of these models agree well with our measurements (data not shown) and with each other within the data range. Discrepancies that are evident outside of the scattering regime might indicate there is more information to gather at larger
  . Bottom: For P4–P6 reconstructions the agreement is excellent both within and beyond the data range.
While the unfolded state(s) of the ribozyme cannot be reconstructed uniquely from the existing data, we note that the agreement for the ten reconstructions improves for scattering data measured at longer times after mixing, as indicated by the lower MNSD. The drop in  indicates that the ribozyme becomes more compact during this time. Although the MNSD is largest for extended states, we note that a simpler extended state (that of P4–P6) reconstructed well. Therefore, and not unexpectedly, reconstructions from states that are complex and extended pose the greatest challenges. Scattering profiles of these molecules should display intensity variations over a very large range of scattering angles. A large MNSD (produced from reconstructions of data acquired in the more accessible
  ranges described here) may in fact indicate that the states of interest are both complex and extended.
To address the question of how scattering data from multiple states will affect reconstruction, we turn to the SAXS data from P4–P6 folding which are adequately modeled by a two-state transition. At the time mid-point of the folding transition, where roughly half of the molecules are unfolded and half are folded, the reconstruction converges to an apparent spatial average of the population. This is not entirely unexpected since the SAXS data are a linear combination of scattering curves representing the states present in solution. Insight might be gained by analyzing this curve with singular value decomposition (Chen et al., 1996 ▶) and then applying reconstruction methods, but such an approach generally requires several different scattering curves, a limited number of states in solution and some additional knowledge of the system to determine the weights of the basis curves needed to build the relevant scattering states. Alternatively, a reconstruction that represents an average rather than a physical state may be employed to analyze bulk properties of the molecule in solution. For example, Lipfert et al. (2007 ▶) demonstrated the utility of reconstructions in electrostatic calculations of nucleic acid solutions. In such a case, the mean shape of a molecule in solution would be an ideal basis for modeling.
5. Conclusions
Our results demonstrate the feasibility and utility of reconstructions applied to time-resolved data. Even for the most complex molecules, where a unique structure was not readily identifiable, the MNSD may provide an additional measure of the rate of compaction. Furthermore, one could reasonably expect to reconstruct meaningful states near the end of the folding path. For simple molecules with less of a uniqueness problem, intermediate states might be found in this way. Additionally, there are many molecular processes that involve major conformational changes between two compact states with transient intermediates, which may be studied by the methods discussed herein. While scattering data may be noisy, as long as an overall shape of the curve can be elucidated, a reconstruction can accurately represent the prominent dimensions and overall changes of a molecule.
Reconstructions are also useful when comparing new SAXS data with existing structural data and models. While the scattering curve for a crystal structure can be calculated and compared with the data, differences might be challenging to interpret in the absence of three-dimensional shape envelopes. Data from techniques such as electron microscopy, which produces images but not scattering curves, are also hard to compare. Finally, there have been recent efforts to combine low-resolution data, atomic resolution data and computer modeling to maximize the information gained from each technique (Grossmann, 2007 ▶; Suhre et al., 2006 ▶). Time-resolved reconstructions used in conjunction with these techniques will provide deeper insight into the changes that take place in a molecule.
Supplementary Material
Supplementary material file. DOI: 10.1107/S0021889808028264/aj5112sup1.pdf
Acknowledgments
This work was funded by the Nanobiotechnology Center which is supported in part by the STC Program of the National Science Foundation under agreement No. ECS-9876771. Additional support was provided by the National Institutes of Health through P01-GM066275 and the National Science Foundation through MCB-0347220. We would like to thank beamline scientists Alec Sandy and Suresh Narayanan for their assistance at APS, and Arthur Woll for his assistance at CHESS. We thank Simon Mochrie for loan of the stopped-flow mixer. Use of the Advanced Photon Source was supported by the US Department of Energy, Office of Science, Office of Basic Energy Sciences, under contract No. DE-AC02-06CH11357. The Cornell High Energy Synchrotron Source is supported by the National Science Foundation and the National Institutes of Health/National Institute of General Medical Sciences under NSF award DMR-0225180. This work made use of the research computing facility of the Cornell Center for Materials Research (CCMR) with support from the National Science Foundation Materials Research Science and Engineering Centers (MRSEC) program (DMR 0520404).
Footnotes
Supplementary data for this paper are available from the IUCr electronic archives (Reference: AJ5112). Services for accessing these data are described at the back of the journal.
References
- Akiyama, S., Takahashi, S., Kimura, T., Ishimori, K., Morishima, I., Nishikawa, Y. & Fujisawa, T. (2002). Proc. Natl Acad. Sci. USA, 99, 1329–1334. [DOI] [PMC free article] [PubMed]
- Cate, J. H., Gooding, A. R., Podell, E., Zhou, K. H., Golden, B. L., Kundrot, C. E., Cech, T. R. & Doudna, J. A. (1996). Science, 273, 1678–1685. [DOI] [PubMed]
- Chacón, P., Díaz, J. F., Morán, F. & Andreu, J. M. (2000). J. Mol. Biol.299, 1289–1302. [DOI] [PubMed]
- Chen, L., Hodgson, K. O. & Doniach, S. (1996). J. Mol. Biol.261, 658–671. [DOI] [PubMed]
- Das, R., Kwok, L. W., Millett, I. S., Bai, Y., Mills, T. T., Jacob, J., Maskel, G. S., Seifert, S., Mochrie, S. G. J., Thiyagarajan, P., Doniach, S., Pollack, L. & Herschlag, D. (2003). J. Mol. Biol.332, 311–319. [DOI] [PubMed]
- Fang, X. W., Littrell, K., Yang, X., Henderson, S. J., Siefert, S., Thiyagarajan, P., Pan, T. & Sosnick, T. R. (2000). Biochemistry, 39, 11107–11113. [DOI] [PubMed]
- Funari, S. S., Rapp, G., Perbandt, M., Dierks, K., Vallazza, M., Betzel, C., Erdmann, V. A. & Svergun, D. I. (2000). J. Biol. Chem.275, 31283–31288. [DOI] [PubMed]
- Grossmann, J. G. (2007). J. Appl. Cryst.40, s217–s222.
- Guinier, A. & Fournet, G. (1955). Small-Angle Scattering of X-rays. New York: John Wiley and Sons Inc.
- Guo, F., Gooding, A. R. & Cech, T. R. (2004). Mol. Cell, 16, 351–362. [DOI] [PubMed]
- Heller, W. T., Abusamhadneh, E., Finley, N., Rosevear, P. R. & Trewhella, J. (2002). Biochemistry, 41, 15654–15663. [DOI] [PubMed]
- Konarev, P. V., Petoukhov, M. V., Volkov, V. V. & Svergun, D. I. (2006). J. Appl. Cryst.39, 277–286.
- Kwok, L. W., Shcherbakova, I., Lamb, J. S., Park, H. Y., Andresen, K., Smith, H., Brenowitz, M. & Pollack, L. (2006). J. Mol. Biol.355, 282–293. [DOI] [PubMed]
- Lipfert, J., Chu, V. B., Bai, Y., Herschlag, D. & Doniach, S. (2007). J. Appl. Cryst.40, s229–s234.
- Moody, M. F., Vachette, P., Foote, A. M., Tardieu, A., Koch, M. H. J. & Bordas, J. (1980). Proc. Natl Acad. Sci. USA, 77, 4040–4043. [DOI] [PMC free article] [PubMed]
- Nöllmann, M., Stark, W. M. & Byron, O. (2004). Biophys. J.86, 3060–3069. [DOI] [PMC free article] [PubMed]
- Pan, J., Thirumalai, D. & Woodson, S. A. (1999). Proc. Natl Acad. Sci. USA, 96, 6149–6154. [DOI] [PMC free article] [PubMed]
- Pollack, L., Tate, M. W., Darnton, N. C., Knight, J. B., Gruner, S. M., Eaton, W. A. & Austin, R. A. (1999). Proc. Natl Acad. Sci. USA, 96, 10115–10117. [DOI] [PMC free article] [PubMed]
- Rook, M. S., Treiber, D. K. & Williamson, J. R. (1999). Proc. Natl Acad. Sci. USA, 96, 12471–12476. [DOI] [PMC free article] [PubMed]
- Russell, R. & Herschlag, D. (1999). J. Mol. Biol.291, 1155–1167. [DOI] [PubMed]
- Russell, R., Millett, I. S., Tate, M. W., Kwok, L. W., Nakatani, B., Gruner, S. M., Mochrie, S. G. J. P. V. D. S., Herschlag, D. & Pollack, L. (2002). Proc. Natl Acad. Sci. USA, 99, 4266–4271. [DOI] [PMC free article] [PubMed]
- Schlatterer, J. C., Kwok, L. W., Lamb, J. S., Park, H. Y., Andresen, K., Brenowitz, M. & Pollack, L. (2008). J. Mol. Biol.379, 859–870. [DOI] [PMC free article] [PubMed]
- Suhre, K., Navaza, J. & Sanejouand, Y.-H. (2006). Acta Cryst. D62, 1098–1100. [DOI] [PubMed]
- Svergun, D. I. (1992). J. Appl. Cryst.25, 495–503.
- Svergun, D. I. (1999). Biophys. J.76, 2879–2886. [DOI] [PMC free article] [PubMed]
- Svergun, D. I. & Koch, M. H. J. (2002). Curr. Opin. Struct. Biol.12, 654–660. [DOI] [PubMed]
- Tsuruta, H., Nagamura, T., Kimura, K., Igarashi, Y., Kajita, A., Wang, Z. X., Wakabayashi, K., Amemiya, Y. & Kihara, H. (1989). Rev. Sci. Instrum.60, 2356–2358.
- Volkov, V. V. & Svergun, D. I. (2003). J. Appl. Cryst.36, 860–864.
- Walther, D., Cohen, F. E. & Doniach, S. (2000). J. Appl. Cryst.33, 350–363.
- Wriggers, W. & Chacón, P. (2001). J. Appl. Cryst.34, 773–776.
Associated Data
This section collects any data citations, data availability statements, or supplementary materials included in this article.
Supplementary Materials
Supplementary material file. DOI: 10.1107/S0021889808028264/aj5112sup1.pdf


