

Abstract
The calculation of protein interaction energetics is of fundamental interest, yet accurate quantities are difficult to obtain due to the complex and dynamic nature of protein interfaces. This is further complicated by the presence of water molecules, which can exhibit transient interactions of variable duration and strength with the protein surface. The T-cell receptor (TCR) and its staphylococcal enterotoxin 3 (SEC3) binding partner are well-characterized examples of a protein−protein interaction system exhibiting interfacial plasticity, cooperativity, and additivity among mutants. Specifically engineered mutants induce intercalating interfacial water molecules, which subsequently enhance protein−protein binding affinity. In this work, we perform a set of molecular mechanics (MM) Poisson−Boltzmann (PB) surface area (SA) calculations on the wild type and two mutant TCR-SEC3 systems and show that the method is able to discriminate between weak and strong binders only when key explicit water molecules are included in the analysis. The results presented here point to the promise of MM-PBSA toward rationalizing molecular recognition at protein−protein interfaces, while establishing a general approach to handle explicit interfacial water molecules in such calculations.
Introduction
Methods to calculate relative binding free energies vary in computational expense and accuracy. The more computationally expensive methods, i.e. free energy perturbation or thermodynamic integration,(1) can calculate relative binding free energies to within a few kcal/mol of experimental values or better. Absolute estimates of binding free energy remain difficult; however, for applications in drug and protein design, it can be useful to differentiate strong from weak binders. Srivinasan et al.(2) proposed an intermediate method. It calculates average free energy differences between bound and unbound states via examination of a molecular dynamics simulation. A molecular mechanics (MM) force field is used to calculate the internal energy, while a Poisson−Boltzmann (PB) calculation yields the polar component of the solvation free energy. The nonpolar contribution correlates with the surface area (SA). The method is known as MM-PBSA.
Previous applications of MM-PBSA included binding to nucleic acids2,3 and small molecule binding to enzymes.4,5 Applications of MM-PBSA to protein−protein interactions are relatively new and far less common. An example is the work by Gohlke and Case(6) on the Ras-Raf system. Of particular interest is to gain insight into molecular recognition. The ability to design protein surfaces that bind a given target protein or molecule has great potential for therapeutic treatment.(7) This is challenging because it is necessary to capture small effects on binding affinity due to mutations or other perturbations at the protein surface. Furthermore, the effects may be subtle and in some cases involve intercalating water molecules.
An example of how mutations can induce intercalating water molecules and improve binding affinity is the engineering of a T-cell receptor mutant that binds staphylococcal enterotoxin 3 (SEC3) 1000 times more strongly than wild type(8) (Figure 1). These systems are exceptionally well characterized in terms of their binding, thermodynamics, and structures and are examples of protein−protein systems that exhibit interfacial plasticity, cooperativity, and additivity among mutants. The effect of each TCR mutation (G17E, A52V, S54N, K66E, E80V, L81S, T87S, G96V) was analyzed via extensive kinetic and structural studies.9,10 In some cases, the affinity was additive, whereas in others it was cooperative.
Figure 1.

The three simulated systems are structurally aligned for comparison. The SEC domain and Vb domain are shown in cartoon representation, with the mutated positions shown in licorice (hydrophobic residues in white, polar in green, negatively charged in red, positively charged in blue). An excerpt of the full sequence alignment is shown with mutated positions highlighted and numbered.
The role of water at the interface of biomolecular complexes remains an open and intriguing question.11,12 In the case of the barnase/barstar and the D1.3/lysozyme complexes, it was found that crystallographically resolved water molecules accounted for 25% of the total interaction energy.(13) There is evidence that removing water mediated contacts, via introduction of functional groups that replace the water, can diminish binding in some cases,14−17 while it can be favorable in others.18−20 Moreover, the environment surrounding the water molecule(s) seems to play an important role. Olano and Rick(21) found that transferring a water molecule from the bulk solvent to a hydrophilic cavity is favorable (−4.7 kcal/mol), whereas transferring it to a hydrophobic cavity will be unfavorable (4.7 kcal/mol). Thus a protein−protein interface, which may contain variable interaction types, may present a combination of favorable and unfavorable water mediated contacts.
In this work, we perform three separate explicitly solvated molecular dynamics (MD) simulations using the available high-resolution crystal structures of the TCR/SEC3 complexes and perform MM-PBSA analyses on the resulting trajectories in order to capture their experimentally known binding affinities. The systems include the wild type and two strongly binding mutant systems. Our results show that the MM-PBSA method is able to discriminate between the strongly binding mutants and the weaker-binding wild type complex and suggest that including explicit water molecules in the binding energy calculations was crucial to obtaining the correct energetic trends with statistical significance.
Methods
Molecular Dynamics Simulations
The crystal structures used in this study had PDB codes 2AQ1 (KD = 5.50 × 10⁻⁹ M), 2AQ2 (KD = 1.14 × 10⁻⁸ M), and 2AQ3 (KD = 7.55 × 10⁻⁶ M), which span 3 orders of magnitude in terms of their binding affinities. The protonation states of the histidines and other titratable groups was determined with the WHATIF program.(22) All crystallographically resolved water molecules were retained in the systems; however, the ions (zinc and sulfate) were removed. No additional water molecules were added at the interfaces of any of the complexes. The Amber99 force field(23) was used with xLeap in Amber9(24) for system setup. A box of TIP3P water molecules(25) was added to solvate to each system. The composite systems each contain approximately 55,000 atoms (Table 1).
Table 1. Summary of Each of the Simulated Systems.
| system | mutants | number of atoms | total simulation time |
|---|---|---|---|
| 2aq1 | H72Q-r:SEC3−1A4 | 54,541 | 16 ns |
| 2aq2 | A52V/S54N/K66E: SEC3−1D3 | 55,435 | 16 ns |
| 2aq3 | mTCR15-SEC3 | 54,722 | 16 ns |
The systems were energy minimized for 50,000 steps with NAMD2.6(26) and then equilibrated at 298.15 K in the isobaric−isothermal (NPT) ensemble for 2 ns. Periodic boundary conditions and the hybrid Nose-Hoover Langevin piston method(27) were used to control pressure at 1 atm. After 2 ns, dynamics were continued in the canonical (NVT) ensemble for an additional 16 ns. All hydrogen bond lengths were constrained with the RATTLE algorithm, thus allowing a 2 fs time step. A multiple time-stepping algorithm was utilized, where bonded interactions were evaluated at every time step, and short-range nonbonded interactions were evaluated every 2 timesteps, and long-range electrostatic interactions were evaluated every 4 timesteps.28,29 Particle mesh Ewald was employed to efficiently treat electrostatics.(30) Simulations were performed on the San Diego Supercomputer Center’s Datastar platform with 64 processors, and each nanosecond of dynamics took approximately 0.18 days. The hydrogen bonding and salt bridge interaction analyses were performed with VMD(31) and Matlab.
MM-PBSA Calculations
MM-PBSA is a well-established method to calculate binding free energies. It requires dynamical sampling of the complexed system, usually in explicit water, and postprocessing of the trajectory structures. The binding free energy may be calculated by comparison of the complexed trajectory with separate trajectories of the unbound monomers or, as is more typically the case, from a single trajectory of the complex. The binding free energy is calculated using a simple thermodynamic cycle from the energy difference between the complex and the two unbound binding partners. The free energy of each species is calculated as follows
where HMM corresponds to the molecular mechanics energy, or enthalpic, contribution and is given by
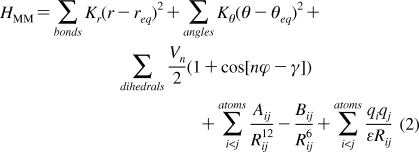 |
where, per the Amber9 manual, the first sum is over all the chemical bonds, the second term sums over all the angles, the third addresses the dihedral angle potential, and the last two terms explicitly describe the van der Waals and electrostatics contributions, respectively. The indices i and j denote individual atoms. ε is the dielectric constant.
Gsolv denotes the solvation free energy. There are two parts to this term. First there is the nonpolar contribution, i.e. the cost of opening a cavity in the condensed phase. The product of the surface area and an effective surface tension term often approximates the nonpolar contribution. There are, however, further corrections based on attractive and repulsive solvent−solute interactions that improve the estimate of the nonpolar contribution.(32) Second, the surrounding dielectric, water, responds to protein atomic charges inside the cavity. The work involved is the polar contribution to solvation. Unlike the molecular mechanics contribution, it implicitly includes the solvent entropy.
The entropy term should, in theory, account for the conformational entropy change of the two binding partners upon complexation. However, due to the complicated and computationally intensive nature of calculating entropy, only an approximate quantity is computed. Here, we perform a normal-mode analysis, using Nmode in Amber9, to compute the vibrational, rotational, and translational entropy.
For each complex snapshot, free energy calculations for the structure of each binding partner are carried out separately (in the absence of the other binding partner). The binding free energy is approximated by the difference
When comparing protein−protein binding of single residue mutants, Massova and Kollman(33) found the entropic contribution difference nearly canceled. Because of the high computational cost of this calculation and its approximate nature, it is often omitted from the overall binding free energy estimate.
Here, the MM-PBSA analysis was performed using the Amber parm99 force field for the MM contribution and APBS(34) for the Poisson−Boltzmann contribution. In order to achieve this, the iAPBS(35) patch was used to call APBS from Sander, the MD engine in Amber 9.
For the MM contributions, the dielectric constant was set to 1.0, and the interaction cutoff distance equaled 999 Å. Other parameters were default. For the APBS calculation, the grid spacing was 0.5 Å in each dimension, the solvent dielectric was set to 80.0, the protein dielectric was set to 1.0, the solvent radius was set to 1.4 Å, the boundary condition (bcfl) was set to 2, there were no counterions, the cubic spline window was set to 0.3, and the rest of the parameters were default values.
Selection of Interface Water Molecules
In this study, we chose to consider the effect of interfacial water molecules between SEC3 and its binding partners, e.g., the wild type and mutant TCRs, on the MM-PBSA calculations. In one case, we included all the interface water molecules; more specifically, the closest 200 water molecules to the protein interface were selected and included in the end point free energy calculations. The closest distances of each water molecule to the SEC3 domain and the TCR domain were computed. At every trajectory snapshot and for each water molecule, these two distances were summed, and this sum was used as a metric for the selection process. The 200 water molecules with the smallest sum of squared distances were chosen as interface water molecules for each snapshot. The interface water molecules were considered part of SEC3 for the purposes of the MM-PBSA calculations.
In the second case, we focus on fewer, specific water molecules that were suggested by the crystal structures to mediate contacts between residues Asn54 and Glu56 of TCR with the backbone amide of SEC3 Phe206 (Figure 2). To do that, at each trajectory snapshot, the shortest distance from each water molecule to TCR residues 54, 56, and SEC 206 was computed. For each water molecule, the square of the minimum distance to each of the residues was summed. This sum was used as a metric of how close any given water molecule was to the site of interaction. This list was sorted, and the two water molecules with the smallest sum of squared distances were chosen as the bridging water molecules for each snapshot. The same procedure was followed for the wild type and mutant trajectories; the two interface waters closest to TCR residues 54 and 56 and SEC3 residue 206 were included in the wild type calculation. The intercalating water molecules were considered part of SEC3 for the purposes of the MM-PBSA calculations.
Figure 2.

The S54N mutation stabilizes a water-mediated contact. A) Ser54 makes a water medicated contact with the backbone carbonyl of SEC3 Phe206. B) Ser54 in a conformation where the contact is broken. C) Asn54 making the water-mediated contact and also a hydrogen bond interaction with Asp56.
Block Averaging
Each trajectory was divided in 5 equal sections. MM-PBSA results for each of these segments were averaged. The standard error of the mean for these five data points was reported.
Results and Discussion
Kieke et al.(8) produced TCR mutants and selected the best binders against SEC3. Two iterations of this process yielded a mutant system that binds 1000 times stronger than wild type. The strongly binding complex involved nine mutations: G17E, A52V, S54N, K66E, Q72H, E80V, L81S, T87S, and G96V.(10) Four of the mutations are located at the binding interface (A52V, S54N, K66E, and Q72H); the other five are distal to the interface and did not show a significant contribution to the binding affinity.(10)
To explore the structural effects of the mutations, Cho et al.(9) resolved crystal structures of two mutant complexes. The H72Q-r system (PDB code: 2aq1) has eight of the total nine mutations and a dissociation constant of 5.5E(−9) M; Q72H was reversed, but it has a minor effect on the binding affinity (Kd = 5.5E(−9) M versus 5.3 E(−9) M). The A52V/S54N/K66E system (PDB code:2aq2) involves three mutations (A52V, S54N, and K66E) and has a 1.1 E(−8) M dissociation constant. Molecular dynamics simulations of these two mutants and the wild type complex were performed (Table 1), and the resulting trajectories were analyzed via MM-PBSA.
MD Simulations
MD simulations of the two mutants and wild type complexes spanned 16 ns. These were explicit solvent simulations, under periodic boundary conditions, with neutralizing counterions and where electrostatics were treated via PME.30,36 Except for minor fluctuations, the Cα rmsd of the trajectories is below 2.5 Å for the wild type system and below 2.0 Å for the mutants (Supporting Information).
Effect of Interfacial Water
Cho et al.(9) noted that the structure of the Ser54Asn mutant introduces several new bridging water molecules across the interface that were not present in the wild type system. These ordered interfacial water molecules, herein called intercalating water molecules, persisted in their original location at the interface throughout the 16 ns simulation (Figure 2). The wild type Ser54 system is also able to order water across the interface, but it easily adopts a second conformation that disrupts the hydrogen bond network. When Asn substitutes Ser, it forms a hydrogen bond with Asp56, which better positions it for ordering the interactions with the intercalating water molecules. Both the Ser and Asn contact the carbonyl oxygen of Phe206 on SEC3 via this water-mediated interaction. To quantify the difference in behavior between these two residues, the distance distribution between the F206 carbonyl oxygen and either the alcohol hydrogen of Ser54 or amide hydrogen in the case of the S54N mutant was calculated (Figure 3). As this distance is mediated by two water molecules, it is longer than the usual 3.5 Å between hydrogen bond donor and acceptor atoms. This result shows a dramatic shift in the distance distribution toward a shorter distance for the Asn mutant.
Figure 3.

Distance probability density for a water-mediated interaction across the interface. The interaction involves the backbone carbonyl of SEC3 Phe206 and either 1) the OH group of Ser54 (wild type) or 2) the amide group of the S54N mutant side chain. It is clear the Asn54 side chain makes this water mediated contact nearly all of the time.
End Point Free Energy Calculations
In the first and simplest case, we performed a MM-PBSA calculation on only the protein domains, without including any explicit water molecules. Such calculations have been shown in the literature to work for other protein−protein systems, such as the Ras-Raf complex.(6) The results of this calculation were indeed able to predict the correct binding affinity trend for the three systems, but their statistical uncertainties overlap (Table 2). The absolute free energy binding estimates were not correct, nor would we expect them to be given the approximations used in this study, such as neglecting the internal (strain) energy of the systems and entropic contributions. The standard error of the mean, however, indicates that when only the protein domains are included in the calculations, the three systems yield binding energy results that are all within statistical error.
Table 2. MM-PBSA Results Using iAPBSa.
| iAPBS/MM-PBSA results | H72Q-r | std error of mean | A52V S54N K66E | std error of mean | wild type | std error of mean |
|---|---|---|---|---|---|---|
| experimental Kd | 5.5 E(−9) M | 1.1 E(−8) M | 7.6 E(−6) M | |||
| no water molecules included | −47.7 | 3.1 | −47.2 | 0.8 | −44.1 | 1.2 |
| interfacial water molecules (200) | −146.3 | 4.7 | −143.8 | 14.7 | −148.2 | 3.0 |
| intercalating water molecules | −55.3 | 2.8 | −54.3 | 0.8 | −46.2 | 1.4 |
All results are in kcal/mol, except for the experimental Kd data. The internal entropy contributions are not included in these estimates since it was nearly the same for the three cases.
Entropy contribution estimates, using a harmonic approximation, yielded essentially the same results for the three complexes (TΔS = −39.8, −40.8, −40.0 with a standard deviation of ∼10 kcal/mol). Due to their similar values and large standard deviations, these values were not included in the analysis. The similarity of these entropy values is not surprising. In their work on computational alanine scanning, Massova and Kollman(33) found entropy contributions to be nearly the same for alanine mutants of a protein-peptide complex. It is also important to keep in mind that it is difficult to converge these estimates,(44) which may explain the large standard deviations. Fortunately, even without including these contributions, the effect of alanine mutations can be captured, to some extent, via MM-PB(GB)SA analysis.(6)
As a second case, all interfacial water molecules were included in the free energy calculations. More specifically, the 200 closest water molecules to both subunits were selected in each frame and included as part of the SEC3 domain in the MM-PBSA calculations. This approach is similar to hybrid solvent models where the first hydration shell is explicitly included, and a continuum solvent model approximates the bulk solvation beyond that point.37,38 The results including all interface water molecules yielded an incorrect energetic trend as compared to experimental binding affinities and high absolute values for the binding affinities in all three cases (Table 2). In addition, the statistical error is significantly higher than the other two scenarios considered. The larger number of explicit electrostatic and van der Waals contributions to the energetic terms causes the perceived higher binding affinity. In principle, this effect should be the same for the three cases and the relative difference between them should be unaffected. However, the statistical error in this case increases beyond the binding affinity differences; therefore, the ability to discern among the mutant and wild type systems is further reduced.
In a third case, the MM-PBSA analysis explicitly included two interfacial water molecules, which were first identified in the Ser54Asn mutant crystal structure (Figure 2). The two water molecules were considered as part of SEC for these calculations. The actual water molecule coordinates were taken from each individual MD snapshot so that they were the closest two water molecules to TCR residues 54 and 56 and SEC3 residue 206. When these two intercalating water molecules were included, the correct energetic trends were reproduced, and it was possible to discern between the strongly binding mutants and the weaker binding wild type complex with statistical significance (Table 2). This result underscores the importance of including specific interface water molecules, and not necessarily all water molecules, for the computational prediction of the binding energetics. In this case, the Ser54Asn mutation introduced an important water-mediated contact between the two protein subunits. Without accounting for explicit water, the contact is lost, along with the higher binding affinity that accompanies this mutation. These results are further substantiated by a previous study that employed end point free energy calculations for a nucleic acid system, which also showed better performance when a key explicit water molecule was included in the analysis.(3)
Considered more broadly, these results are not surprising considering that water is well-known to play an important role in protein dynamics and function.(39) The water molecules in the first hydration shell, which make direct contacts to protein residues, adapt to the topology and physicochemical character of the protein surface.(40) The subsequent dynamics of these water molecules is affected by the hydrophobicity and curvature of the protein surface.(41) Longer residence times of water molecules that make ordered interactions with exposed protein groups are frequently exhibited at protein−protein interfaces, and these longer residence times are typically related to stronger interaction energies.(42)
Limitations of the Method
The failure to differentiate between the H72Q-r and A52V/S54N/K66E mutants may be attributed, at least in part, to two reasons. First, the 10-fold difference in dissociation constants between the complexes corresponds to ∼1.6 kcal/mol binding free energy. This difference is very close to the error margin (∼1.35 kcal/mol) for the more rigorous and computationally intensive free energy of perturbation or thermodynamic integration calculations.(43) Therefore, it would be very surprising if this method could reliably rank complexes so similar in affinity. Second, the two mutant complexes are identical at the interface. The differences between the two complexes are located away from the interface.(10)
In addition, the entropic cost of fixing a water molecule at the interface was neglected. This value is particularly difficult to converge,(45) but it may be up to ∼2.1 kcal/mol.(46) Although we do not attempt to calculate it here, we note that accounting for this entropic penalty may bring our binding free energy estimates closer to the experimentally determined values. As a first order approximation, one may assume that the only difference in solvent entropy among the wild type and mutant systems is the ordering of the two intercalating water molecules. Given the value provided by Dunitz, one would estimate an entropic penalty of approximately 4.2 kcal/mol. Such an assumption would reduce, but not eliminate, the statistically significant difference between the wild type and mutant systems.
The main finding of this work is that including key intercalating water molecules in MM-PBSA calculations can help discriminate between strong- and weak-binding complexes. In the case of the TCR and SEC3 systems, the importance of particular intercalating water molecules was established experimentally, wherein the crystallographic structure of the mutant complexes showed that these ordered water molecules mediate interfacial contacts of the mutated residues.(9) No direct interface contacts were introduced by the mutations. In this work we show, by comparison to other scenarios where the interface water molecules are either completely excluded or included, that explicitly including select water molecules improves the predictive ability of the MM-PBSA calculations. Although we concede that ignoring the entropy loss of these water molecules will introduce some error that may overestimate the stability of the complex, calculations at this level of approximation may be sufficiently accurate to achieve the goal of discriminating between strong- and weak-binding protein−protein complexes.
Conclusions
The results presented here highlight the crucial role that intercalating water molecules play in protein−protein interaction energetics. The results also point to the limitations of using a completely continuum solvent model, such as PBSA. However, we show that such errors may be rescued if key water molecules, such as those present in the first solvent shell or as suggested from crystallographic data, are included explicitly in the calculations. More broadly, the ability to computationally discern between strong- and weak-binding complexes can be particularly useful in the study of molecular recognition and in the prediction and design of new or mutant protein systems. This work shows MM-PBSA may be of use in that effort.
Acknowledgments
We thank Dr. Robert Konecny for kindly providing the iAPBS wrapper for the calculations and Drs. David Cerutti and Tushar Jain and Profs. Roy Mariuzza and Mike Gilson for helpful discussions. R.E.A. is funded by NIH F32-GM077729 and NSF MRAC CHE060073N. Funding by NIH GM31749, NSF MCB-0506593, and MCA93S013 to J.A.M. also supported this work. Additional support from the Howard Hughes Medical Institute, San Diego Supercomputing Center, Accelrys, the W.M. Keck Foundation, the National Biomedical Computational Resource, and the Center for Theoretical Biological Physics is gratefully acknowledged.
Supporting Information Available
Cα rmsd trajectories for wild type and mutant system simulations. This material is available free of charge via the Internet at http://pubs.acs.org.
Funding Statement
National Institutes of Health, United States
Supplementary Material
References
- Simonson T.; Archontis G.; Karplus M. Free energy simulations come of age: Protein-ligand recognition. Acc. Chem. Res. 2002, 35 (6), 430–437. [DOI] [PubMed] [Google Scholar]
- Srinivasan J.; Cheatham T. E. III.; Kollman P.; Case D. Continuum solvent studies of the stability of DNA, RNA and phosphoramidate--DNA helices. J. Am. Chem. Soc. 1998, 120, 9401–9409. [Google Scholar]
- Spackova N.; Cheatham T. E. III.; Ryjacek F.; Lankas F.; van Meervelt L.; Hobza P.; Sponer J. Molecular dynamics simulations and thermodynamics analysis of DNA-drug complexes. Minor groove binding between 4’,6-diamidino-2-phenylindole and DNA duplexes in solution. J. Am. Chem. Soc. 2003, 125 (7), 1759–1769. [DOI] [PubMed] [Google Scholar]
- El-Barghouthi M. I.; Jaime C.; Al-Sakhen N. A.; Issa A. A.; Abdoh A. A.; Al Omari M. M.; Badwan A. A.; Zughul M. B. Molecular dynamics simulations and MM-PBSA calculations of the cyclodextrin inclusion complexes with 1-alkanols, para-substituted phenols and substituted imidazoles. J. Mol. Struct.: THEOCHEM 2008, 853 (1−3), 45–52. [Google Scholar]
- Swanson J. M. J.; Henchman R. H.; McCammon J. A. Revisiting Free Energy Calculations: A Theoretical Connection to MM/PBSA and Direct Calculation of the Association Free Energy. Biophys. J. 2004, 86 (1), 67–74. [DOI] [PMC free article] [PubMed] [Google Scholar]
- Gohlke H.; Kiel C.; Case D. Insights into Protein-Protein Binding by Binding Free Energy Calculation and Free Energy Decomposition for the Ras-Raf and Ras-RalGDS Complexes. J. Mol. Biol. 2003, 330 (4), 891–913. [DOI] [PubMed] [Google Scholar]
- Babine R.; Bender S. Molecular Recognition of Protein-Ligand Complexes: Applications to Drug Design. Chem. Rev. 1997, 97 (5), 1359–1472. [DOI] [PubMed] [Google Scholar]
- Kieke M. C.; Sundberg E.; Shusta E. V.; Mariuzza R. A.; Wittrup K. D.; Kranz D. M. High affinity T cell receptors from yeast display libraries block T cell activation by superantigens. J. Mol. Biol. 2001, 307 (5), 1305–1315. [DOI] [PubMed] [Google Scholar]
- Cho S.; Swaminathan C. P.; Yang J.; Kerzic M. C.; Guan R.; Kieke M. C.; Kranz D. M.; Mariuzza R. A.; Sundberg E. J. Structural basis of affinity maturation and intramolecular cooperativity in a protein-protein interaction. Structure 2005, 13 (12), 1775–1787. [DOI] [PMC free article] [PubMed] [Google Scholar]
- Yang J.; Swaminathan C. P.; Huang Y.; Guan R.; Cho S.; Kieke M. C.; Kranz D. M.; Mariuzza R. A.; Sundberg E. J. Dissecting cooperative and additive binding energetics in the affinity maturation pathway of a protein-protein interface. J. Biol. Chem. 2003, 278 (50), 50412–50421. [DOI] [PubMed] [Google Scholar]
- Li Z.; Lazaridis T. Water at biomolecular binding interfaces. Phys. Chem. Chem. Phys. 2007, 9, 573–581. [DOI] [PubMed] [Google Scholar]
- Papoian G.; Ulander J.; Wolynes P. Role of Water Mediated Interactions in Protein-Protein Recognition Landscapes. J. Am. Chem. Soc. 2003, 125, 9170–9178. [DOI] [PubMed] [Google Scholar]
- Covell D.; Wallqvist A. Analysis of protein-protein interactions and the effects of amino acid mutations on their energetics. The importance of water molecules in the binding epitope. J. Mol. Biol. 1997, 269 (2), 281–297. [DOI] [PubMed] [Google Scholar]
- Clarke C.; Woods R.; Gluska J.; Cooper A.; Nutley M.; Boons G. Involvement of Water in Carbohydrate-Protein Binding. J. Am. Chem. Soc. 2001, 123, 12238–12247. [DOI] [PubMed] [Google Scholar]
- Mikol V.; Papageorgiou C.; Borer X. The role of water molecules in the structure-based design of (5-hydroxynorvaline-)-2-cyclosporin: synthesis, biological activity and crystallographic analysis with cyclophilin A. J. Med. Chem. 1995, 38 (17), 3361–3367. [DOI] [PubMed] [Google Scholar]
- Sharrow S.; Edmonds K.; Goodman M.; Novotny M.; Stone M. Thermodynamic consequences of disrupting a water-mediated hydrogen bond network in a protein: pheromone complex. Protein Sci. 2005, 14, 249–256. [DOI] [PMC free article] [PubMed] [Google Scholar]
- Branden B.; Goldman E.; Mariuzza R.; Poljack R. Anatomy of an antibody molecule: structure, kinetics, thermodynamics and mutational studies of the antilysozyme antibody D1.3. Immunol. Rev. 1998, 163, 45–57. [DOI] [PubMed] [Google Scholar]
- Chen J.; Wawrzak Z.; Basarab G.; Jordan D. Structure-based design of protein inhibitors of scytalon dehydratase: displacement of a water molecule from the active site. Biochemistry 1998, 37 (51), 17735–17744. [DOI] [PubMed] [Google Scholar]
- Weber P.; Pantoliano M.; Simons D.; Salemme J. Structure-Based Design of Synthetic Azobenzene Ligands for Streptavidin. J. Am. Chem. Soc. 1994, 116, 2717–2724. [Google Scholar]
- Connelly P.; Aldape R.; Bruzzese F.; Chambers S.; Fitzgibbon M.; Fleming M.; Itoh S.; Livingston D.; Navia M.; Thomson J.; Wilson K. Enthalpy of hydrogen bond formation in a protein-ligand binding reaction. Proc. Natl. Acad. Sci. U.S.A. 1994, 91 (5), 1964–1968. [DOI] [PMC free article] [PubMed] [Google Scholar]
- Olano R.; Rick S. Hydration free energies and entropies for water in protein interiors. J. Am. Chem. Soc. 2004, 126 (25), 7991–8000. [DOI] [PubMed] [Google Scholar]
- Vriend G. WHAT IF: a molecular modeling and drug design program. J. Mol. Graphics 1990, 8 (1), 52–56. [DOI] [PubMed] [Google Scholar]
- Wang J.; Cieplak P.; Kollman P. A. How well does a restrained electrostatic potential (RESP) model perform in calculating conformational energies of organic and biological molecules. J. Comput. Chem. 2000, 21 (12), 1049–1074. [Google Scholar]
- Case D. A.; Darden T.; Cheatham T. E. III.; Simmerling C.; Wang J.; Duke R.; Luo R.; Merz K.; Pearlman D.; Crowley M.; Walker R.; Zhang W.; Wang B.; Hayik A.; Roiberg A.; Seabra G.; Wong K.; Paesani F.; Wu X.; Brozell S.; Tsui V.; Gohlke H.; Yang L.; Tan C.; Morgan J.; Hornak V.; Cui G.; Beroza P.; Matthews D.; Schfmeister C.; Ross W.; Kollman P.. AMBER 9; 2006.
- Jorgensen W. L.; Chandrasekhar J.; Madura J. D.; Impey R. W.; Klein M. L. Comparison of simple potential functions for simulating liquid water. J. Chem. Phys. 1983, 79 (2), 926–935. [Google Scholar]
- Phillips J. C.; Braun R.; Wang W.; Gumbart J.; Tajkhorshid E.; Villa E.; Chipot C.; Skeel R. D.; Kale L.; Schulten K. Scalable molecular dynamics with NAMD. J. Comput. Chem. 2005, 26 (16), 1781–1802. [DOI] [PMC free article] [PubMed] [Google Scholar]
- Feller S.; Zhang Y.; Pastor R.; Brooks B. Constant pressure molecular dynamics simulation: The Langevin piston method. J. Chem. Phys. 1995, 103, 4613. [Google Scholar]
- Schlick T.; Skeel R. D.; Brunger A. T.; Kalé L. V.; Board J. A.; Hermans J.; Schulten K. Algorithmic Challenges in Computational Molecular Biophysics. J. Comput. Phys. 1999, 151 (1), 9–48. [Google Scholar]
- Grubmuller H.; Heller H.; Windemuth A.; Schulten K. Generalized Verlet Algorithm for Efficient Molecular Dynamics Simulations with Long-range Interactions. Mol. Simul. 1991, 6 (1), 121–142. [Google Scholar]
- Darden T.; York D.; Pedersen L. Particle Mesh Ewald: An N log(N) Method for Ewald Sums in Large Systems. J. Chem. Phys. 1993, 98 (12), 10089–10092. [Google Scholar]
- Humphrey W.; Dalke A.; Schulten K. VMD: visual molecular dynamics. J. Mol. Graphics 1996, 14 (1), 33–38. [DOI] [PubMed] [Google Scholar]
- Wagoner J. A.; Baker N. A. Assessing implicit models for nonpolar mean solvation forces: The importance of dispersion and volume terms. Proc. Natl. Acad. Sci. U.S.A. 2006, 103 (22), 8331–8336. [DOI] [PMC free article] [PubMed] [Google Scholar]
- Massova I.; Kollman P. A. Computational alanine scanning to probe protein-protein interactions: A novel approach to evaluate binding free energies. J. Am. Chem. Soc. 1999, 121 (36), 8133–8143. [Google Scholar]
- Baker N.; Sept D.; Joseph S.; Holst M.; McCammon J. Electrostatics of nanosystems: application to microtubules and the ribosome. Proc. Natl. Acad. Sci. U.S.A. 2001, 98, 10037–10041. [DOI] [PMC free article] [PubMed] [Google Scholar]
- Konecny R. iAPBS interface on the Web. http://mccammon.ucsd.edu/iapbs (accessed April 4, 2008).
- Essmann U.; Perera L.; Berkowitz M. L.; Darden T.; Lee H.; Pedersen L. G. A Smooth Particle Mesh Ewald Method. J. Chem. Phys. 1995, 103 (19), 8577–8593. [Google Scholar]
- Lee M. S.; Olson M. A. Evaluation of Poisson solvation models using a hybrid explicit/implicit solvent method. J. Phys. Chem. B 2005, 109 (11), 5223–5236. [DOI] [PubMed] [Google Scholar]
- Beglov D.; Roux B. Dominant solvation effects from the primary shell of hydration: Approximation for molecular dynamics simulations. Biopolymers 1995, 35 (2), 171–178. [Google Scholar]
- Helms V. Protein dynamics tightly connected to the dynamics of surrounding and internal water molecules. ChemPhysChem 2007, 8 (1), 23–33. [DOI] [PubMed] [Google Scholar]
- Pizzitutti F.; Marchi M.; Sterpone F.; Rossky P. J. How protein surfaces induce anomalous dynamics of hydration water. J. Phys. Chem. B 2007, 111 (26), 7584–7590. [DOI] [PubMed] [Google Scholar]
- Hua L.; Huang X.; Zhou R.; Berne B. J. Dynamics of water confined in the interdomain region of a multidomain protein. J. Phys. Chem. B 2006, 110 (8), 3704–3711. [DOI] [PubMed] [Google Scholar]
- Schroder C.; Rudas T.; Boresch S.; Steinhauser O. Simulation studies of the protein-water interface. I. Properties at the molecular resolution. J. Chem. Phys. 2006, 124 (23), 234907. [DOI] [PubMed] [Google Scholar]
- Shirts M.; Pitera J.; Swope W.; Pande V. Extremely precise free energy calculations of amino acid side chain analogs: Comparison of common molecular mechanics force fields for proteins. J. Chem. Phys. 2003, 119, 5740–5761. [Google Scholar]
- Gohlke H.; Case D. A. Converging free energy estimates: MM-PB(GB)SA studies on the protein-protein complex Ras-Raf. J. Comput. Chem. 2003, 25 (2), 238–250. [DOI] [PubMed] [Google Scholar]
- Hamelberg D.; McCammon J. A. Standard Free Energy of Releasing a Localized Water Molecule from the Binding Pockets of Proteins: Double-Decoupling Method. J. Am. Chem. Soc. 2004, 126, 7683–7689. [DOI] [PubMed] [Google Scholar]
- Dunitz J. D. Entropic Cost of Bound Water in Crystals and Biomolecules. Science 1994, 264, 670. [DOI] [PubMed] [Google Scholar]
Associated Data
This section collects any data citations, data availability statements, or supplementary materials included in this article.