Abstract
Acquisition and loss of genetic material are essential forces in bacterial microevolution. They have been repeatedly linked with adaptation of lineages to new lifestyles, and in particular, pathogenicity. Comparative genomics has the potential to elucidate this genetic flux, but there are many methodological challenges involved in inferring evolutionary events from collections of genome sequences. Here we describe a model-based method for using whole-genome sequences to infer the patterns of genome content evolution. A fundamental property of our model is that it allows the rates at which genetic elements are gained or lost to vary in time and from one lineage to another. Our approach is purely sequence based, and does not rely on gene identification. We show how inference can be performed under our model and illustrate its use on three datasets from Francisella tularensis, Streptococcus pyogenes, and Escherichia coli. In all three examples, we found interesting variations in the rates of genetic material gain and loss, which strongly correlate with their lifestyle. The algorithms we describe are implemented in a computer software named GenoPlast.
Bacteria adapt to new environmental niches by remodeling their genomes. Genome sequencing has revealed a prominent role for gene gain and loss in the processes of niche adaptation, specialization, host-switching, and other lifestyle changes. Diverse bacterial species exhibit such genetic flux, which plays a crucial role in bacterial evolution (Ochman et al. 2000; Wren 2000; Dobrindt and Hacker 2001).
Previous studies of genomic flux have used annotated genes as the units of gain and loss. In the standard inference protocol, genes annotated in sequenced genomes are first assigned to orthologous groups on the basis of sequence homology. Paralogs in multicopy gene families are either disambiguated or discarded, and genes exhibiting only partial homology are usually subjected to a conservation threshold to be considered orthologous (e.g., 70% of the amino acid length must be conserved). The resulting one-to-one mapping of orthologous genes is then subjected to a gene flux analysis. Gene gains and losses are typically presumed to be equally likely to occur in all lineages, which enables parsimonious mapping of gene gains/losses to branches of a phylogenetic tree relating the organisms under study. Finally such studies usually investigate the relationship between gain, loss, and ecological niche.
However, some molecular processes underlying genomic flux operate without regard to gene boundaries. Short segments within genes, such as protein domains, are often gained or lost (Spratt 1988; Riley and Labedan 1997), and intergenic regulatory regions may also be subject to such pressures. Clusters of neighboring genes and operons may be gained or lost in a single event (Lawrence and Roth 1996). A complete evolutionary account would annotate individual events while also detecting variations in rate over time in particular lineages. The discovery of reductive genome evolution (Silva et al. 2001; Hershberg et al. 2007) has clearly demonstrated that in many cases, the process of genomic gain and loss is asymmetric in some lineages. Parsimony criteria are known to be unreliable when branch lengths are unequal (Felsenstein 1978; Pol and Siddall 2001; Swofford et al. 2001), meaning that statistical modeling of unequal rates is necessary for accurate evolutionary inference.
In the present work, we introduce a new method to reconstruct genomic flux based on raw genomic sequence (without annotated coding sequences) that can also infer lineage-specific changes in the rates of gain and loss. Our method takes whole-genome multiple alignments as input, and outputs a mapping of changes in genomic content to branches of a phylogenetic tree, along with confidence estimates. The method utilizes a stochastic model of genomic evolution by gain and loss, incorporating a compound Poisson process model (Huelsenbeck et al. 2000) to allow the rates of gain and loss to vary in time and between lineages. Therefore, our model does not assume that evolution proceeds according to a constant molecular clock (Linz et al. 2007). The importance of modeling the changes in the rate of gene flux has been recognized before (Hao and Golding 2004, 2008; Marri et al. 2006), but our method is the first to be able to infer from the data where such changes may have happened instead of relying on the user's prior knowledge.
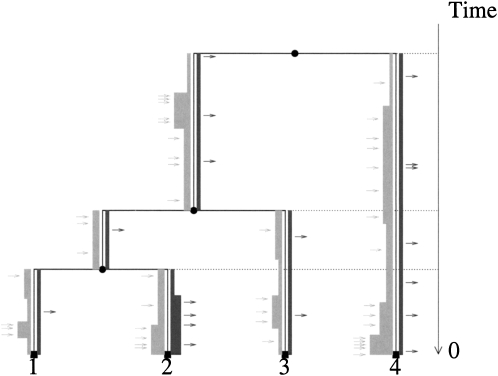
Our method processes a whole-genome multiple alignment to identify the parts that are present in all genomes (the core genome) and the parts present in some, but not all of them (the dispensable genome). The core genome is used to robustly infer a phylogenetic tree. Since the parts in the dispensable genome are not found in all genomes, they must have been gained or lost at least once along the branches of the phylogeny. In order to model the overall rate of genetic material being gained and lost, the dispensable genome is broken up into small “features” of constant size. We encode the presence or absence of these features in a particular genome as a binary character, and model the evolution of these binary characters along the phylogenetic tree. Thus, the rates of gain r+ and loss r− incorporated in our model reflect the total number of nucleotides gained and lost during the evolution of a population among sequences found in at least one of the genomes. Figure 1 gives an illustration of our model.
Figure 1.
Illustration of the model. The branches of the phylogeny T are in black. The width of the light gray line on the left of the branches is proportional to the value of r+ (frequency of feature gain). Similarly, the dark gray line on the right of each branch represents r− (frequency of feature loss). Individual feature gain events are represented by light gray arrows, and individual feature loss events are represented by black arrows.
Inference is performed under this model using a reversible-jump Markov chain Monte Carlo (MCMC) (Green 1995, 2003). Our prior model favors simple explanations for the observed patterns of feature presence and absence (i.e., low rates for gain and loss, and few changes in the rates). Thus, a change in the rate of gain and loss in a particular lineage must be supported by the data to be inferred by our method.
We assess the power of our method using a simulation study and illustrate its use for two groups of γ-Proteobacteria and one group of Firmicutes. In doing so, we demonstrate the ability of our approach to infer genomic flux that involves regulatory regions and fragments of genes. We further demonstrate that, using genome sequence alone, we are able to identify changes in the rate of genomic flux. The rate changes identified by our method are associated with microbial lifestyle changes such as transitions from generalist to host-restricted pathogen lifestyles. We have made a software implementation of the algorithm with a graphical interface freely available from http://go.warwick.ac.uk/genoplast/.
Results
Simulation study
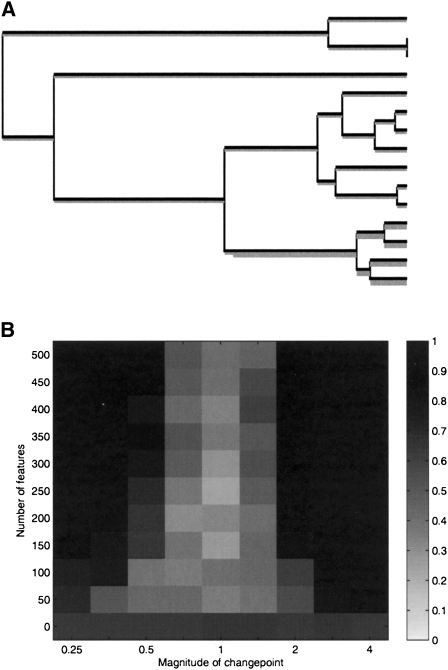
We simulated a genealogy from the coalescent model (Kingman 1982a,b) for a sample of 15 individuals. Feature gain and loss was simulated on this genealogy under the assumption that r is constant throughout, and that r+ contained a single changepoint, as shown in Figure 2A. Several such datasets were simulated with different values for the number of features f and for the magnitude m of the change in r+ at the unique changepoint (i.e., the ratio of values of r+ after and before the changepoint).
Figure 2.
Simulation study. (A) Coalescent genealogy on which the power study is based, with no changepoint in r− and a single changepoint in r+ on the branch above the last four isolates. (B) Intensity plot of the posterior probability of having exactly one changepoint in r+ on the correct branch, as a function of the number of independent features and the changepoint magnitude.
Inference was performed for each of these simulated datasets by running our MCMC algorithm for 20,000 iterations. Figure 2B shows the results for a grid of values of f from 0 to 500, and of m from 0.25 to 4.0. Each datapoint in Figure 2B is the average over 20 different simulations and inferences, of the posterior probability that there is exactly one changepoint in r+ on the correct branch. For m = 1, the changepoint has no effect in the simulation, and the results are as expected given the Poisson prior with parameter 1 that we used for the number of changepoints in r+ on the whole tree. Our power to detect the changepoint increases with the number of features f that we use, and also as the magnitude m increases above or decreases under 1.
The conditions shown on Figure 2A are in many ways optimal for the detection of the changepoint in r+, with no other changepoint on the whole tree confounding its effect, and its location implying an effect on a large subtree. Figure 2B should therefore be interpreted as the maximum that our method can offer in terms of changepoint detection. Yet, it shows that even with a small amount of data (the number of features in actual datasets is much larger), our method is able to detect even subtle changes in the rates.
Application to Francisella turalensis
The γ-proteobacterium Francisella tularensis is composed of several phenotypically diverse subspecies. The most virulent one is ssp. tularensis, which causes lethal pulmonary infections in humans and animals (Ellis et al. 2002). A first strain from subspecies tularensis was sequenced by Larsson et al. (2005), and two subsequent sequencing projects showed that it exhibits little genomic diversity (Beckstrom-Sternberg et al. 2007; Chaudhuri et al. 2007). Subspecies holarctica is a highly infectious but rarely fatal lineage (Ellis et al. 2002), of which three strains have been sequenced (Petrosino et al. 2006; P. Chain, F. Larimer, M. Land, S. Stilwagen, P. Larsson, S. Bearden, M. Chu, P. Oyston, M. Forsman, S. Andersson, et al., unpubl.; S. Godbole, L. Zhou, D. Bruce, R. Crawford, C. Detter, M. Dempsey, C. Lion, C. Munk, J. Noronha, R. Scheuermann, et al., unpubl.). A sequence from subspecies novicida, which is rarely associated with human disease, has also been determined (Rohmer et al. 2007).
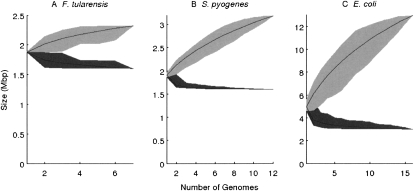
Table 1 summarizes the seven F. turalensis genomes. We aligned the genomes and determined their phylogeny based on the core genome as described in the Methods section. The average length of each genome is around 1.9 Mbp, of which 1.6 Mbp is found in all genomes (cf. Fig. 3A). The remaining genetic material (i.e., the dispensable genome) is made up of 7216 features of 100 bp present in one to six of the seven genomes.
Table 1.
Genomes in the Francisella tularensis data set
Figure 3.
Extent of the genomic regions found in all genomes (dark gray), or at least one genome (light gray), as a function of the number of genomes under study.
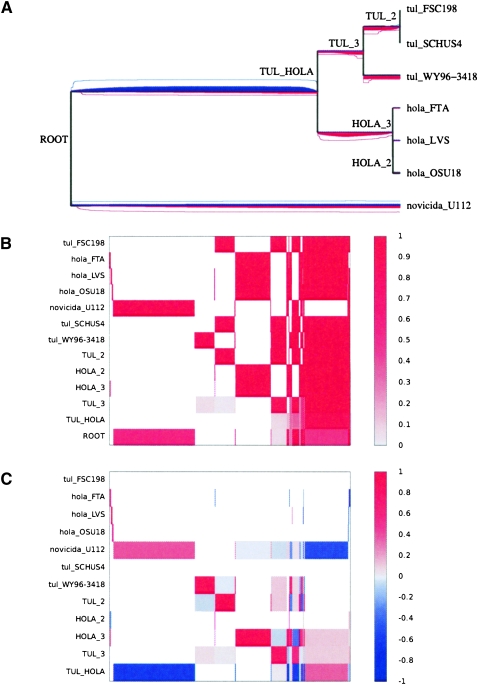
We reconstructed the history of gain and loss of these features using the algorithm described in the Methods section. Figure 4A shows the inferred flux for the Francisella data set, Figure 4B shows the inferred reconstruction of the genome content for the nodes of the phylogeny, and Figure 4C shows the inferred probabilities of gain or loss for each branch and each feature. The genome content of the root node is ambiguous (last row of Fig. 4C), and, therefore, much uncertainty exists regarding the events that occurred on the two branches directly under the root (fifth and last rows of Fig. 4B). The inclusion of the outgroup novicida is, however, useful to reduce the uncertainty on the remainder of the branches, in particular the reconstruction of the genome content of the most recent common ancestor of tularensis and holarctica (cf. penultimate row of Fig. 4C).
Figure 4.
Results on the Francisella turalensis data set. (A) Phylogeny of the sample with the compound level r+ of feature gain in red below, and the compound level r− of feature loss in blue above the branches of the phylogeny. The average level of r+ and r− at each position on the tree is proportional to the quantity of red and blue at that position, and a 95% credibility interval for each rate at each position is shown by two lines of the corresponding color. (B) Probability of presence of each feature in the genome of each node of the phylogeny shown in A. The x-axis represents the different features (ordered according to their pattern of presence in the genomes), and the y-axis shows the different nodes, labeled as in A. (C) Probability of feature gain and loss for the branches of the phylogeny shown in A. The x-axis represents the different features (ordered as in B), and the y-axis shows the different branches, labeled by the name in A of the node directly under the branch.
We found that a large amount of genetic material was lost on the branch above the ancestor of tularensis and holarctica with an average of 172 kbp lost (last row on Fig. 4C). This is consistent with the observation that a high proportion (∼10%) of their genes have degraded into pseudogenes (Larsson et al. 2005; Petrosino et al. 2006; Beckstrom-Sternberg et al. 2007) in contrast to the nonpathogenic novicida (Rohmer et al. 2007). Genome degradation and reduction both result in the disruption of pathways that may be redundant or even detrimental to the pathogenic lifestyle. Furthermore, a large amount of lateral gene transfer has taken place since the divergence of holarctica and tularensis, with an average of 144 and 70 kbp gained by each lineage, respectively. However, this flux seems to have stopped after the common ancestor of holartica, with only 12 kbp gained since then by the three genomes of holarctica combined. This scenario is compatible with the observation of substantial chromosomal rearrangement within tularensis (Beckstrom-Sternberg et al. 2007) as well as between holarctica and tularensis (Petrosino et al. 2006), but little within holarctica (Petrosino et al. 2006).
Application to Streptococcus pyogenes
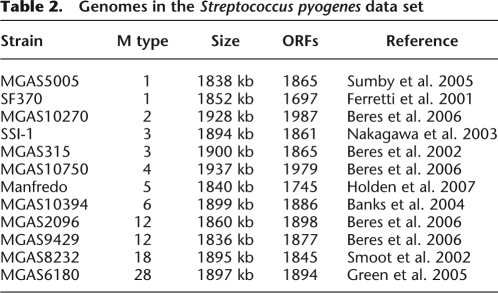
Streptococcus pyogenes is a Gram-positive bacterium responsible for a wide range of human diseases such as bacteremia, tonsillitis, scarlet fever, or acute rheumatic fever (Cunningham 2000). The species is traditionally subdivided according to serologic differences in the M protein, which are strongly correlated with the frequency and type of infection caused. A total of 12 S. pyogenes genomes have been sequenced, spanning nine different M types, and we included all of them in this study (cf. Table 2). Previous genome comparisons revealed that the most noticeable difference between those genomes lies in the presence or absence of integrated prophages (Ferretti et al. 2001; Beres et al. 2002; Nakagawa et al. 2003; Banks et al. 2004; Holden et al. 2007). Those prophages contain a number of genes associated with virulence, so that the history of prophage gain and loss is likely to be pivotal to explaining the different types of infection caused by different lineages.
Table 2.
Genomes in the Streptococcus pyogenes data set
The average length of the S. pyogenes genomes is around 1.9 Mbp, of which 1.6 Mbp is found in all 12 genomes (cf. Fig. 3B). There are 15,794 features of length 100 bp found in a strict subset of the genomes. The phylogeny estimated on the S. pyogenes core genome is highly star-like, in agreement with previous studies (Beres et al. 2006; Holden et al. 2007). The nine different M types are approximately equidistant, and the three pairs of genomes sharing the same M types are very closely related (MGAS5005 and SF370 sharing M type 1, SSI-1 and MGAS315 sharing M type 3, MGAS2096 and MGAS9429 sharing M type 12).
Our method avoids a common problem arising with analysis of prophage. The difficulty is that they almost all display some homology (Banks et al. 2004; Holden et al. 2007). Since prophage usually deteriorate faster than the core genome, it is difficult to definitely say whether homologous prophage were both vertically inherited or inherited via lateral transfer. The ambiguous orthology relationship in turn creates ambiguity for inference of prophage gain and loss. Furthermore, intragenomic recombination amongst resident prophages has been described (Nakagawa et al. 2003), which makes the reconstruction of flux even more tedious. Here we used Mauve as described in the Methods section to determine the orthologous regions of prophages. As Mauve is a synteny-based method, this results in a parsimonious evaluation of the gain and loss of prophage features, where all events can be safely assumed to have occurred, but one cannot exclude a more complex history obscured by the homology of different phages.
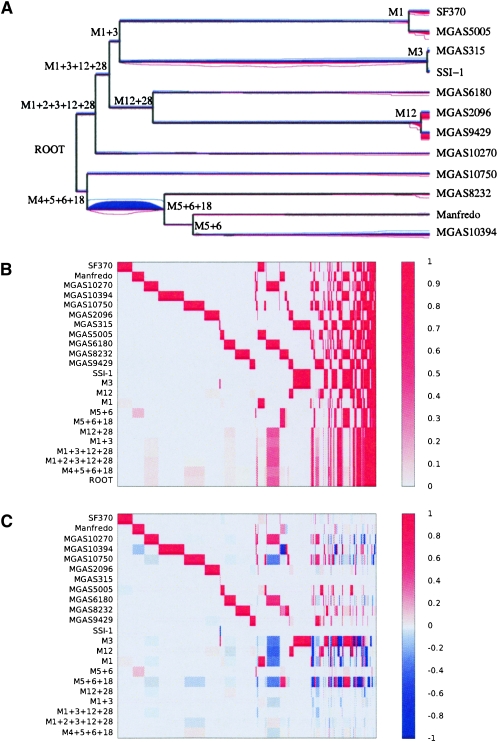
Our reconstruction of the genetic flux in S. pyogenes is shown in Figure 5. As expected, it is dominated by prophage gain and loss. The evolution of genome content seems to follow an approximate molecular clock with three clear exceptions. The first one is a clear increase in the rate of loss on the branch above the three genomes of type M5, M6, and M18, with 168 kbp lost on this relatively short branch. Furthermore, we found a clear increase in the rate of lateral gene transfer for the two genomes of type M1, and also for the two genomes of type M12. 415 kbp, 452 kbp, 430 kbp, and 459 kbp have been gained on the branches directly above SF370, MGAS315, MGAS5005, and SSI-1, respectively. The material gained by these four genomes since they diverged from one another is found in several locations around their genome (Supplemental Fig. 2), which indicates that several distinct insertion events happened on each branch. An increase in the rate of gain was inferred for two of the three M types where we have two genomes. Such an increase would be impossible to infer for the M types, where we have only one genome, because of the long branches separating the different M types, which make it impossible to infer how recently gain occurred. It is also possible that an increase in the gain of M3 could not be spotted because of the very close relatedness of genomes MGAS315 and SSI-1 within this M type, which makes them virtually identical (Nakagawa et al. 2003).
Figure 5.
Results on the Streptococcus pyogenes data set. (A) Phylogeny of the sample with the compound level r+ of feature gain in red below, and the compound level r− of feature loss in blue above the branches of the phylogeny. The average level of r+ and r− at each position on the tree is proportional to the quantity of red and blue at that position, and a 95% credibility interval for each rate at each position is shown by two lines of the corresponding color. (B) Probability of presence of each feature in the genome of each node of the phylogeny shown in A. The x-axis represents the different features (ordered according to their pattern of presence in the genomes), and the y-axis shows the different nodes, labeled as in A. (C) Probability of feature gain and loss for the branches of the phylogeny shown in A. The x-axis represents the different features (ordered as in B), and the y-axis shows the different branches, labeled by the name in A of the node directly under the branch.
These results therefore suggest that prophage integration has accelerated in recent times for the genomes of type M1 and M12, but also possibly for several other lineages of S. pyogenes. This is consistent with a previous study which found that maximum likelihood estimates for the rate of genomic flux was higher on the external branches than on the internal branches of a phylogeny of Streptococcus (Marri et al. 2006). Another possibility is that prophage integration occurred at a constant rate, but is balanced by prophage excision or deletion. That is, most of the older phage insertions are not visible, as they have been removed, and only recent insertions are detected. A similar observation has been noted in Salmonella enterica (Vernikos et al. 2007). The sequencing of additional genomes sharing the same M types should shed more light on these hypotheses, which could reflect a more recent adaptation of lineages to specific niches than previously thought (Marri et al. 2006).
Application to Escherichia coli and Shigella
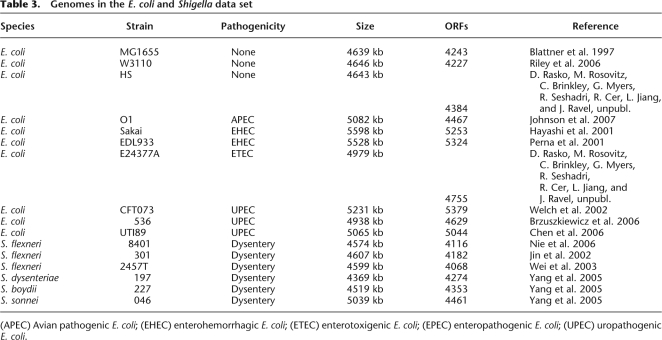
E. coli has long been considered an organism of choice for the study of bacterial pathogenicity due to the coexistence of various pathogenic and commensal lineages. A total of 10 genomes have so far been completely sequenced: three laboratory and commensal strains (MG1655, W3110, and HS), one avian pathogenic strain (APEC O1), two enterohemorrhagic strains (EHEC Sakai and EDL933), one enterotoxigenic strain (ETEC 24377A), and three uropathogenic strains (UPEC CFT073, 536, and UTI89).
We also included in our analysis the six sequenced genomes of the closely related genus Shigella: three from species S. flexneri (8401, 301, and 2457T) and one from each of the other three species (197, 227, and 046). Table 3 contains the list of these 16 genomes, with references to their original publications. All six strains of Shigella are causative agents of bacillary dysentery; hence, they have historically been classified in a separate genus, despite the fact that the Shigella phenotype has evolved multiple times from different clones of E. coli (Pupo et al. 2000; Jin et al. 2002; Wei et al. 2003). In agreement with this, the phylogeny we inferred for the 16 genomes shows the six strains of Shigella split into different phylogenetic groups.
Table 3.
Genomes in the E. coli and Shigella data set
(APEC) Avian pathogenic E. coli; (EHEC) enterohemorrhagic E. coli; (ETEC) enterotoxigenic E. coli; (EPEC) enteropathogenic E. coli; (UPEC) uropathogenic E. coli.
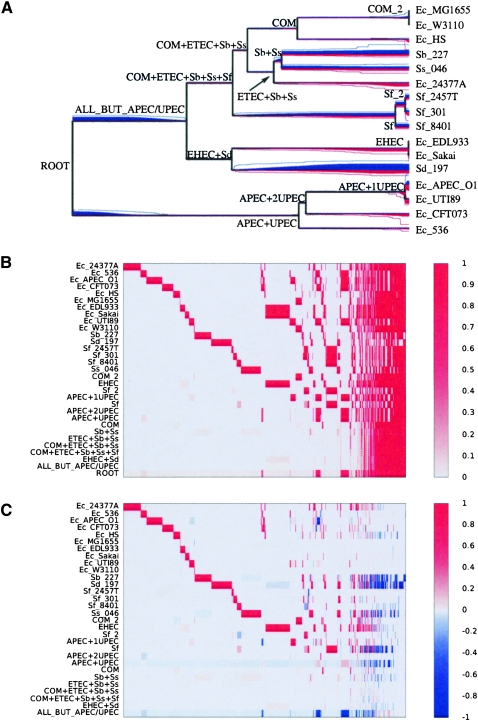
The mean of the lengths of those 16 genomes is approximately equal to 5 Mbp, of which ∼3 Mbp are found in all 16 genomes (Fig. 3C). The dispensable genome is made of 99,335 features of length 100 bp. The results of our analysis of genomic flux are shown in Figure 6. The branches on which the least gain and loss occurred are the ones above the three commensal and laboratory strains MG1655, W3110, and HS. These are therefore the closest in genomic content to the genome of the most recent common ancestor of all E. coli and Shigella.
Figure 6.
Results on the Escherichia coli and Shigella data set. (A) Phylogeny of the sample with the compound level r+ of feature gain in red below, and the compound level r− of feature loss in blue above the branches of the phylogeny. The average level of r+ and r− at each position on the tree is proportional to the quantity of red and blue at that position, and a 95% credibility interval for each rate at each position is shown by two lines of the corresponding color. (B) Probability of presence of each feature in the genome of each node of the phylogeny shown in A. The x-axis represents the different features (ordered according to their pattern of presence in the genomes), and the y-axis shows the different nodes, labeled as in A. (C) Probability of feature gain and loss for the branches of the phylogeny shown in A. The x-axis represents the different features (ordered as in B), and the y-axis shows the different branches, labeled by the name in A of the node directly under the branch.
All of the branches above the six Shigella genomes show important gains of genomic material (with an average of 977 kbp gained by each genome), comparable with the ones observed for pathogenic strains of E. coli such as 24377A or EDL933 and Sakai. However, the Shigella genomes have lost many more features than any of the E. coli genomes, with an average of 569 kbp lost by each genome. This genomic reduction can be traced back to a higher presence of insertion sequences (IS) in the Shigella genomes (Yang et al. 2005). Furthermore, a larger number of pseudogenes is found in the genomes of Shigella than in those of E. coli (Nie et al. 2006). The fact that the pathogenic E. coli have not undergone such genome degradation and reduction (except for APEC O1, cf. below) may be a reflection of their larger host range (Cunningham 2000).
The APEC O1 genome is the only avian pathogenic (APEC) strain in our data set (Johnson et al. 2007). The phylogeny we inferred from the core genome indicates that it is a close relative of the three strains of uropathogenic E. coli (UPEC) in our data set, and especially of UTI89. This close relationship, as well as a comparison of the genome sequences and annotation for these four strains, suggest that E. coli strains from animals might be the source of uropathogenic E. coli infections (Johnson et al. 2007). However, our analysis has found a clear increase in the rate of gain and loss on the branch directly above strain APEC O1, resulting in a gain of 691 kbp on this branch. The increase in the rate of gain is comparable to that found for other branches of pathogenic E. coli, but the increased loss is unique to APEC O1 amongst all studied genomes of E. coli, and similar to the high rates described above for Shigella. This result hints that in spite of the close relationship of APEC O1 with the three UPEC strains, it may have already started to adapt to the avian host. This hypothesis may imply that the natural reservoir of human urinary tract pathogenic E. coli is not animals, and will require validation through the sequencing of additional APEC and UPEC strains.
The analysis above uses features of constant size 100 bp, as the unit of genomic flux as described in the Methods section. Our model and algorithm can, however, be applied for any other unit such as the gene, which has been the unit traditionally used in studies of genomic flux (Hao and Golding 2004, 2008; Marri et al. 2006). We therefore reanalyzed the E. coli and Shigella data set using gene presence/absence data in order to compare the two approaches.
We found a total of 14,752 genes to be present in one, but not all of the 16 genomes. Supplemental Figure 3 shows the result of our analysis of genomic flux based on gene data. The overall inferred history of gene flux is the same as the one described above based on these features: The commensals and laboratory strains have endured little flux, pathogenic strains of E. coli have gained some material, and Shigella lineages have gained and lost a large amount of genes.
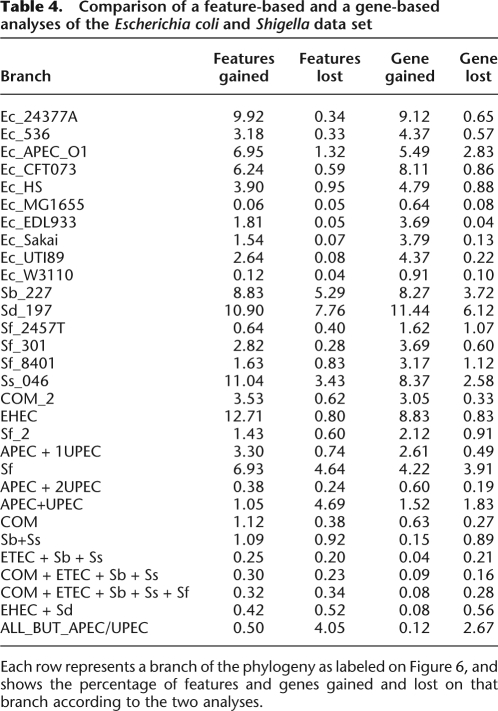
Table 4 contrasts the number of features and genes found to be gained and lost, on average, by both analyses on all the branches of the phylogeny. The gene-based and feature-based analyses are in good agreement, which is not surprising, since the regions of the genomes identified as having been gained and lost are roughly the same in both analyses. For this reason, features and genes are gained and lost in approximately the same proportion on the branches as illustrated in Table 4. Small differences between the two analysis could be caused, for example, by variation in the density of coding genes from one region of the dispensable genome to another, or genome degradation causing a loss of genes (turned into pseudogenes), but not features. The largest difference between the two analyses is found for the amount of loss on the branch above APEC and UPEC, but being directly under the root of the tree, the uncertainty is strong for that branch, with a 95% credibility interval of [1.8;12.1] for the feature-based analysis and [1.1;6.8] for the gene-based analysis (cf. Supplemental Table 1). All the credibility intervals for the amount gained or lost on the different branches are in good agreement when using features and genes.
Table 4.
Comparison of a feature-based and a gene-based analyses of the Escherichia coli and Shigella data set
Each row represents a branch of the phylogeny as labeled on Figure 6, and shows the percentage of features and genes gained and lost on that branch according to the two analyses.
Discussion
We have presented a novel method to reconstruct genome content evolution based on whole-genome alignments. Our method is based on a model of genomic evolution that has the essential property of allowing deviations from a molecular clock in acquisition and loss of genetic material. Our use of a relaxed clock is important for two reasons. First, when a lot of material is gained or lost in a single event (e.g., during phage integration), then we expect high variance in the amount of material flux on branches of the phylogeny, even if the events themselves follow a molecular clock. Second, accumulating evidence suggests that adaptation of an organism to a new niche is accompanied by increased rates of lateral gene transfer (Reid et al. 2000; Marri et al. 2006; Didelot et al. 2007) and/or gene loss (Maurelli et al. 1998; Cole et al. 2001; Welch et al. 2002; Cummings et al. 2004), so that the events themselves do not necessarily occur according to a molecular clock. As such, inferred changes in the rate of gene flux can provide a general means to capture changes in population dynamics or microbial lifestyle.
The methodology we described in order to perform inference under this model of genomic evolution makes use of Bayesian statistics, allowing for a complete quantification of the uncertainty in the reconstruction of material flux. This uncertainty is often large, especially on the branches directly under the genealogy root for which the data at the leaves is not very informative (e.g., Supplemental Table 1). The results can be graphically summarized as illustrated in Figures 4, 5, and 6 with datasets from F. turalensis, S. pyogenes, and E. coli. Our method gives a complete overview of the genomic flux, subsequently fixed in different parts of the phylogeny. As expected, we observed in all three examples a shifting distribution of this flux, which justifies our effort to model a relaxed clock for genomic flux. It is also clear in all three examples that genomic flux is strongly correlated with adaptation to a new lifestyle.
One innovation in the approach taken here is that we do not rely on gene identification. For this reason, the basic unit of our method is the feature (i.e., a sequence fragment of small size) rather than the gene. Clearly, this presents a number of advantages: Gene identification is a laborious process, the quality of existing annotations varies between genomes, and genes are not an indivisible unit of flux. Furthermore, it is always possible, after having found the list of features gained by a genome, to look into its annotation to find the genes (or gene fragments) affected, so that we do not lose the ability to identify gene gains or losses. However, our method can also be applied to gene presence/absence data. The choice of whether to use features or genes depends ultimately on which question is being asked: A gene-based view makes sense if one is interested in differences in functionality, whereas a feature-based view should be favored if one wants to study the mechanism of genomic flux.
Breaking down alignment blocks into features or genes as we do in the present work is useful in order to deal with rates of gain and loss in absolute terms (i.e., proportionally with the number of sites being gained or lost). However, we still fall short of a fully event-based reconstruction of history. Since each alignment block is found either in a contiguous region or not at all in each of the genomes, it is likely that each one was gained or lost in a single evolutionary event. By using alignment blocks as the unit of gain and loss instead of genes or features, one might therefore hope to reconstruct events. Unfortunately, alignment blocks often do not correspond to evolutionary units because of events occurring in different parts of the tree. For example, a region that was gained as a single unit in one or more branches of the phylogeny, but is broken up elsewhere, will appear to be two blocks throughout the phylogeny, wherever it is gained. The division into alignment blocks is highly dependent on exactly which genomes are in the sample, with poorly sampled lineages having larger blocks, which can, in turn, mislead inferences based on the rate of gain or loss of blocks.
Reconstructing the full history of evolutionary events that gave rise to the patterns of mosaicity in an observed sample of genome would therefore require a model of genome evolution that includes the possibility for a genome to gain a sequence of an arbitrary size at any position, to lose any subset of its sequence, and to move any subset to a different point (with the possibility of inversion and/or duplication). The inherent complexity of such a model would pose a serious challenge in trying to use it in an inferential setup. The approach we took in the present work avoids those difficulties, at the cost of being less evolutionary oriented.
Methods
Alignment
We start with a sample of n genome sequences from a single bacterial species or a few closely related species. We first produce a multiple alignment of those genomes using the Progressive Mauve algorithm (Darling et al. 2004; http://gel.ahabs.wisc.edu/mauve/index.php). The Progressive Mauve alignment algorithm identifies and aligns all conserved orthologous segments and all positionally conserved repeat elements. The resulting alignments represent a mosaic of rearranged segments conserved among all genomes, segments conserved among subsets of genomes, and segments unique to a particular genome.
The gaps in a multiple genome alignment can be removed to define the “core genome” of a group of organisms. Gaps in the alignment occur when one or more genomes contain a subsequence not present in remaining genomes. Small alignment gaps are typically caused by mutational processes such as slipped-strand mispairing, whereas large gaps typically result from recombination processes involving gene gain and loss. By excluding alignment columns that participate in gaps larger than some fixed size threshold, for example 20 nt, we can precisely define a set of alignment columns participating in the “core genome.” The core genome can then be used to robustly infer the phylogeny T of the sample. Here, we used the UPGMA algorithm to do so, but Supplemental Figure 1 shows that neighbor joining, maximum parsimony, and minimum evolution all agree with the UPGMA algorithm, except for one branching order in the E. coli data set. Using the other branching order does not affect the results of our genetic flux analysis though.
The remainder of the alignment represents the blocks that have been lost or gained at least once during the evolution of the sample from a common ancestor (also known as the dispensable genome). We consider that each such block is made of small genetic regions of fixed length (i.e., 100 bp) called features. Let f denote the number of the features thus defined. The dispensable genome can thus be summarized by the binary matrix D={di,j}i ∈ [1..n], j ∈ [1..f], where di, j = 1 if, and only if, individual i has the feature j in its genome.
The reason for choosing a feature size of 100 bp is as follows. Choosing a very small value (e.g., 10 bp) would increase the risk that some of the features do not represent real homologous material in all genomes. On the other hand, choosing a very high value (e.g., 10,000 bp) reduces our power to infer rate changes, since smaller elements are not taken into account, and, under the influence of rearrangements, even a large import can often be split into small subfragments. We consider that a value of 100 bp represents a good middle ground between these two potential issues, but our results are robust to slightly different choices.
Model of genome evolution
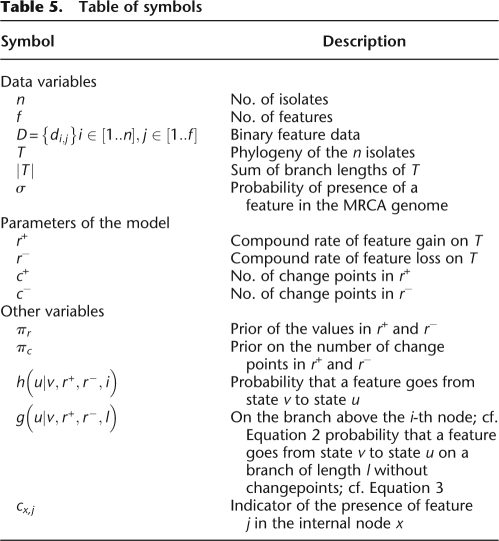
Our model assumes that feature gain follows a compound Poisson process (Huelsenbeck et al. 2000). This means that acquisition of features follows a Poisson process, whose rate r+ can vary along the branches of the phylogeny T. A number c+ of changes in r+ are uniformly distributed on T, and the different values taken by r+ are independent from one another. The loss of genetic features follows a similar (but fully independent) compound Poisson process with compound rate r− containing c− changes. All symbolic notations are summarized in Table 5 and an illustration of the model is given in Figure 1.
Table 5.
Table of symbols
The likelihood of the compound rates r+ and r− of our model can be decomposed feature-by-feature:
 |
To calculate this likelihood, let us first consider the probability g(|v,r+,r−,l) of observing state u ∈ [0, 1] at the bottom of a branch of length l when state v ∈ [0, 1] is at the top, and r+ and r− are constant throughout the branch (i.e., there is no changepoint on the branch). This can be calculated by considering a two-state continuous time Markov chain with the transition matrix A = [1 − r+,r+;r−, 1 − r−. Solving the Chapman-Kolmogorov equations for this process (Dynkin 1989) yields:
 |
Let us now consider the probability h(u|v,r+,r−,i) that a feature is in state u at node i in T, given that it is in state v at the parent node, and the values of r+ and r−. If there is no changepoint on the branch above the node i, then h(u|v,r+,r−,i)=g(u|v,r+,r−,l), where l is the length of the branch above node i. Otherwise, let c+i and c−i denote the number of changepoints on that branch for r+ and r− respectively. This branch can then be decomposed into 1 + c+i + c−i successive segments of lengths {lk}k∈ [1..1+c+i+c−i on each of which both r+ and r− are constant. h(u|v,r+,r−,i) can therefore be calculated using the following dynamic programming procedure:
Start with h(v): = 1 and h(1 − v): = 0;
h(0|v,r+,r−,i) is equal to h(0) and h(1|v,r+,r−,i) is equal to h(1).
Given this method to calculate h(u|v,r+,r−,i), it is now possible to apply Felsenstein's pruning (Felsenstein 1973, 1981) to calculate the likelihood component Lj:
For all leaves i ∈ [1..n], set f0(x): = 1−d and f1(x): = d where d = 1 if the isolate represented by the leaf i has feature j and d = 0 otherwise;
- The likelihood component Lj is equal to:
where σ represents the prior probability that a feature belongs to the genome of the most recent common ancestor of the sample. We estimate σ as the average length of a genome minus the length of the core genome and divided by the total length of the dispensable genome. In doing so, we encode a prior expectation that the ancestral genome size can be approximated as the average of modern genome sizes. The full likelihood follows from Equation 5 using Equation 1. Note that the calculation can be greatly simplified by noticing that any two features with the same pattern of occurrence in the n genomes contribute equal likelihood components to the overall likelihood, so that each pattern needs to be calculated only once.
Bayesian inference
We perform Bayesian inference under the model of genome evolution described above. This requires introduction of a prior πr for each of the different values taken by either r+ and r−, and a prior πc for the numbers c+ and c− of changepoints in r+ and r−. Using Bayes theorem, the posterior distribution P(r+,r−|D) can then be decomposed as follows:
 |
where r+i and r−i represent the different values taken by r+ and r−.
We use a MCMC in order to sample from the posterior distribution (Metropolis et al. 1953; Hastings 1970). However, because the dimensionality of r+ and r− depend on the number of changepoints, the dimensionality of the parameter space is not constant. We therefore use a reversible-jump MCMC (Green 1995, 2003). Our updating scheme uses two transdimensional jumps that propose to add and remove a changepoint to either r+ or r−. We also use a move to update the location of a changepoint on a branch, and a move to update the value associated with a changepoint in either r+ or r−. These moves are described in further detail in the Appendix.
Different uninformative priors for πr and πc were tested and found to have little effect on the posterior distributions for all three datasets. The results shown used πr = Exp(1) and πc = Poisson(1). For each data set, five occurrences of the MCMC were started at different points on the parameter space, chosen according to the prior distribution. Each MCMC was run for 200,000 iterations, the first half of which was discarded to avoid the influence of the starting point. Each iteration consists of an attempt at each of the moves described in the Appendix. Convergence of the MCMC was judged satisfactory in each case by manual comparison for the five runs of the trajectories of the likelihood, c + and c−, as well as application of the Gelman-Rubin test (Gelman and Rubin 1992) for c+, c−, and the values taken by r+ and r− at the top, middle, and bottom of each branch in the phylogeny. The results presented below for each data set are based on a concatenation of the five instances of the MCMC for maximum robustness.
Sampling internal states
The location at which features are gained or lost is not explicitly included in our parametrization of the model in order to improve convergence and mixing rates of the MCMC. It is, however, often interesting to know which features have been gained or lost at different points on the phylogeny, and with which posterior probability. Here we show how this can be done by adding a few steps to the dynamic programming algorithm described above for the calculation of the likelihood. Note that this does not interfere in any way with the likelihood calculation, and does not represent a change of parametrization.
In summary, after using a pruning algorithm in a first pass from bottom to top of T to calculate the likelihood as described above, it is possible to pass again through T from top to bottom in order to sample the state of each internal node (Hein 1989). This procedure is similar to the forward–backward algorithm of hidden Markov models (Rabiner 1989).
For each node x of T, let cx,j be equal to one if node x has feature j and to zero otherwise. The following steps 4 and 5 are added in order to sample cx,j for all nodes:
- Draw u ∼ Unif([0, 1]), and set:

Acknowledgments
We thank Bob Mau and Nicole T. Perna for key insights that inspired this work. We also thank three anonymous reviewers for useful comments, ideas, and discussion. This work was funded in part by Wellcome Trust Grant WT082930MA. X.D. was supported by a research fellowship from the Centre for Research in Statistical Methodology (CRiSM). A.E.D. was supported by NSF grant DBI-063075. D.F. was supported by the Science Foundation of Ireland, grant no. 05/FE1/B882.
Appendix
Markov chain Monte Carlo moves
The moves presented below are accepted according to the Metropolis-Hastings-Green ratio:
LR is equal to the ratio of likelihoods after and before the proposed move and can be calculated using Equation 1. The values of PR, QR, and J are given in each of the move descriptions below.
Move an existing changepoint in r+ along a branch of T
In this move, one of the c+ changepoints of r+ is uniformly chosen. We propose to update the age t of the changepoint to t′, which is drawn uniformly on the branch to which the changepoint belongs. This proposal distribution ensures that proposing to move the age of the changepoint from t to t′ is equally likely to propose a move from t′ to t, so that QR = 1. Furthermore, the model assumes a uniform distribution of the changepoints on T, so that PR = 1. Finally, since this jump does not change the dimensionality of the parameter, we have J = 1.
Update a value in r+
In this move, one of the (c+ + 1) values taken by r+ is uniformly chosen and proposed to be updated by adding u to it, where u ∼ Unif([− ∈ Z; ∈]). If the new value is out of the domain of definition of r+, the move is automatically rejected. Proposing to move from the old to the new value is equally likely than proposing to move from new to the old value, so that QR = 1. Furthermore, PR = πr(r + u)/πr(r) and J = 1.
Add/remove a changepoint in r+
This move first decides to add or remove a changepoint, each with probability a half. To add a changepoint, a point x is chosen uniformly on the branches of T, and the value t of r+ associated with the new changepoint is drawn from πr. To remove a changepoint, one of the c+ existing changepoints is chosen uniformly and removed. If no changepoint exists, the removing update is always rejected. Since the age of a new changepoint and its associated value are drawn from a proposal distribution, the Jacobian J is equal to one, even though this move is transdimensional (Troughton and Godsill 1998; Dellaportas et al. 2002; Lopes and West 2004).
If the move proposes to add a new changepoint at x with associated value t, we have:
If the move proposes to remove an existing changepoint x, we have:
Footnotes
[Supplemental material is available online at www.genome.org. The GenoPlast software is freely available from http://go.warwick.ac.uk/genoplast/.]
Article published online before print. Article and publication date are at http://www.genome.org/cgi/doi/10.1101/gr.082263.108.
References
- Banks D.J., Porcella S.F., Barbian K.D., Beres S.B., Philips L.E., Voyich J.M., DeLeo F.R., Martin J.M., Somerville G.A., Musser J.M., et al. Progress toward characterization of the group A Streptococcus metagenome: Complete genome sequence of a macrolide-resistant serotype M6 strain. J. Infect. Dis. 2004;190:727–738. doi: 10.1086/422697. [DOI] [PubMed] [Google Scholar]
- Beckstrom-Sternberg S.M., Auerbach R.K., Godbole S., Pearson J.V., Beckstrom-Sternberg J.S., Deng Z., Munk C., Kubota K., Zhou Y., Bruce D., et al. Complete genomic characterization of a pathogenic A.II strain of Francisella tularensis subspecies tularensis. PLoS One. 2007;2:e947. doi: 10.1371/journal.pone.0000947. [DOI] [PMC free article] [PubMed] [Google Scholar]
- Beres S.B., Sylva G.L., Barbian K.D., Lei B., Hoff J.S., Mammarella N.D., Liu M.Y., Smoot J.C., Porcella S.F., Parkins L.D., et al. Genome sequence of a serotype M3 strain of group A Streptococcus: Phage-encoded toxins, the high-virulence phenotype, and clone emergence. Proc. Natl. Acad. Sci. 2002;99:10078–10083. doi: 10.1073/pnas.152298499. [DOI] [PMC free article] [PubMed] [Google Scholar]
- Beres S.B., Richter E.W., Nagiec M.J., Sumby P., Porcella S.F., Deleo F.R., Musser J.M. Molecular genetic anatomy of inter- and intraserotype variation in the human bacterial pathogen group A Streptococcus. Proc. Natl. Acad. Sci. 2006;103:7059–7064. doi: 10.1073/pnas.0510279103. [DOI] [PMC free article] [PubMed] [Google Scholar]
- Blattner F.R., Plunkett G., Bloch C.A., Perna N.T., Burland V., Riley M., Collado-Vides J., Glasner J.D., Rode C.K., Mayhew G.F., et al. The complete genome sequence of Escherichia coli K-12. Science. 1997;277:1453–1474. doi: 10.1126/science.277.5331.1453. [DOI] [PubMed] [Google Scholar]
- Brzuszkiewicz E., Brüggemann H., Liesegang H., Emmerth M., Olschlager T., Nagy G., Albermann K., Wagner C., Buchrieser C., Emody L., et al. How to become a uropathogen: Comparative genomic analysis of extraintestinal pathogenic Escherichia coli strains. Proc. Natl. Acad. Sci. 2006;103:12879–12884. doi: 10.1073/pnas.0603038103. [DOI] [PMC free article] [PubMed] [Google Scholar]
- Chain P., Larimer F., Land M., Stilwagen S., Larsson P., Bearden S., Chu M., Oyston P., Forsman M., Andersson S., Lindler L., et al. 2007. Complete genome sequence of Francisella tularensis LVS [Google Scholar]
- Chaudhuri R.R., Ren C.P., Desmond L., Vincent G.A., Silman N.J., Brehm J.K., Elmore M.J., Hudson M.J., Forsman M., Isherwood K.E., et al. Genome sequencing shows that European isolates of Francisella tularensis subspecies tularensis are almost identical to US laboratory strain Schu S4. PLoS One. 2007;2:e352. doi: 10.1371/journal.pone.0000352. [DOI] [PMC free article] [PubMed] [Google Scholar]
- Chen S.L., Hung C.S., Xu J., Reigstad C.S., Magrini V., Sabo A., Blasiar D., Bieri T., Meyer R.R., Ozersky P., et al. Identification of genes subject to positive selection in uropathogenic strains of Escherichia coli: A comparative genomics approach. Proc. Natl. Acad. Sci. 2006;103:5977–5982. doi: 10.1073/pnas.0600938103. [DOI] [PMC free article] [PubMed] [Google Scholar]
- Cole S.T., Eiglmeier K., Parkhill J., James K.D., Thomson N.R., Wheeler P.R., Honore N., Garnier T., Churcher C., Harris D., et al. Massive gene decay in the leprosy bacillus. Nature. 2001;409:1007–1011. doi: 10.1038/35059006. [DOI] [PubMed] [Google Scholar]
- Cummings C.A., Brinig M.M., Lepp P.W., van de Pas S., Relman D.A. Bordetella species are distinguished by patterns of substantial gene loss and host adaptation. J. Bacteriol. 2004;186:1484–1492. doi: 10.1128/JB.186.5.1484-1492.2004. [DOI] [PMC free article] [PubMed] [Google Scholar]
- Cunningham M.W. Pathogenesis of group A streptococcal infections. Clin. Microbiol. Rev. 2000;13:470–511. doi: 10.1128/cmr.13.3.470-511.2000. [DOI] [PMC free article] [PubMed] [Google Scholar]
- Darling A.C., Mau B., Blattner F.R., Perna N.T. Mauve: Multiple alignment of conserved genomic sequence with rearrangements. Genome Res. 2004;14:1394–1403. doi: 10.1101/gr.2289704. [DOI] [PMC free article] [PubMed] [Google Scholar]
- Dellaportas P., Forster J., Ntzoufras I. On Bayesian model and variable selection using MCMC. Stat. Comput. 2002;12:27–36. [Google Scholar]
- Didelot X., Achtman M., Parkhill J., Thomson N.R., Falush D. A bimodal pattern of relatedness between the Salmonella Paratyphi A and Typhi genomes: Convergence or divergence by homologous recombination? Genome Res. 2007;17:61–68. doi: 10.1101/gr.5512906. [DOI] [PMC free article] [PubMed] [Google Scholar]
- Dobrindt U., Hacker J. Whole genome plasticity in pathogenic bacteria. Curr. Opin. Microbiol. 2001;4:550–557. doi: 10.1016/s1369-5274(00)00250-2. [DOI] [PubMed] [Google Scholar]
- Dynkin E.B. Kolmogorov and the theory of Markov processes. Ann. Probab. 1989;17:822–832. [Google Scholar]
- Ellis J., Oyston P.C., Green M., Titball R.W. Tularemia. Clin. Microbiol. Rev. 2002;15:631–646. doi: 10.1128/CMR.15.4.631-646.2002. [DOI] [PMC free article] [PubMed] [Google Scholar]
- Felsenstein J. Maximum likelihood and minimum-steps methods for estimating evolutionary trees from data on discrete characters. Syst. Zool. 1973;22:240–249. [Google Scholar]
- Felsenstein J. Cases in which parsimony or compatibility methods will be positively mis-leading. Syst. Zool. 1978;27:l–4. [Google Scholar]
- Felsenstein J. Evolutionary trees from DNA sequences: A maximum likelihood approach. J. Mol. Evol. 1981;17:368–376. doi: 10.1007/BF01734359. [DOI] [PubMed] [Google Scholar]
- Ferretti J.J., McShan W.M., Ajdic D., Savic D.J., Savic G., Lyon K., Primeaux C., Sezate S., Suvorov A.N., Kenton S., et al. Complete genome sequence of an M1 strain of Streptococcus pyogenes. Proc. Natl. Acad. Sci. 2001;98:4658–4663. doi: 10.1073/pnas.071559398. [DOI] [PMC free article] [PubMed] [Google Scholar]
- Gelman A., Rubin D.B. Inference from iterative simulation using multiple sequences. Stat. Sci. 1992;7:457–511. [Google Scholar]
- Green P.J. Reversible jump Markov chain Monte Carlo computation and Bayesian model determination. Biometrika. 1995;82:711–732. [Google Scholar]
- Green P. Trans-dimensional Markov chain Monte Carlo. Highly Structured Stochastic Systems. 2003;27:179–198. [Google Scholar]
- Green N.M., Zhang S., Porcella S.F., Nagiec M.J., Barbian K.D., Beres S.B., LeFebvre R.B., Musser J.M. Genome sequence of a serotype M28 strain of group A Streptococcus: Potential new insights into puerperal sepsis and bacterial disease specificity. J. Infect. Dis. 2005;192:760–770. doi: 10.1086/430618. [DOI] [PubMed] [Google Scholar]
- Hao W., Golding G. Patterns of bacterial gene movement. Mol. Biol. Evol. 2004;21:1294–1307. doi: 10.1093/molbev/msh129. [DOI] [PubMed] [Google Scholar]
- Hao W., Golding G. Uncovering rate variation of lateral gene transfer during bacterial genome evolution. BMC Genomics. 2008;9:235. doi: 10.1186/1471-2164-9-235. [DOI] [PMC free article] [PubMed] [Google Scholar]
- Hastings W.K. Monte Carlo sampling methods using Markov chains and their applications. Biometrika. 1970;57:97–109. [Google Scholar]
- Hayashi T., Makino K., Ohnishi M., Kurokawa K., Ishii K., Yokoyama K., Han C.G., Ohtsubo E., Nakayama K., Murata T., et al. Complete genome sequence of enterohemorrhagic Escherichia coli O157:H7 and genomic comparison with a laboratory strain K-12. DNA Res. 2001;8:11–22. doi: 10.1093/dnares/8.1.11. [DOI] [PubMed] [Google Scholar]
- Hein J. A new method that simultaneously aligns and reconstructs ancestral sequences for any number of homologous sequences, when the phylogeny is given. Mol. Biol. Evol. 1989;6:649–668. doi: 10.1093/oxfordjournals.molbev.a040577. [DOI] [PubMed] [Google Scholar]
- Hershberg R., Tang H., Petrov D.A. Reduced selection leads to accelerated gene loss in Shigella. Genome Biol. 2007;8:R164. doi: 10.1186//gb-2007-8-8-r164. [DOI] [PMC free article] [PubMed] [Google Scholar]
- Holden M.T., Scott A., Cherevach I., Chillingworth T., Churcher C., Cronin A., Dowd L., Feltwell T., Hamlin N., Holroyd S., et al. Complete genome of acute rheumatic fever-associated serotype M5 Streptococcus pyogenes strain manfredo. J. Bacteriol. 2007;189:1473–1477. doi: 10.1128/JB.01227-06. [DOI] [PMC free article] [PubMed] [Google Scholar]
- Huelsenbeck J.P., Larget B., Swofford D. A compound poisson process for relaxing the molecular clock. Genetics. 2000;154:1879–1892. doi: 10.1093/genetics/154.4.1879. [DOI] [PMC free article] [PubMed] [Google Scholar]
- Jin Q., Yuan Z., Xu J., Wang Y., Shen Y., Lu W., Wang J., Liu H., Yang J., Yang F., et al. Genome sequence of Shigella flexneri 2a: Insights into pathogenicity through comparison with genomes of Escherichia coli K12 and O157. Nucleic Acids Res. 2002;30:4432–4441. doi: 10.1093/nar/gkf566. [DOI] [PMC free article] [PubMed] [Google Scholar]
- Johnson T.J., Kariyawasam S., Wannemuehler Y., Mangiamele P., Johnson S.J., Doetkott C., Skyberg J.A., Lynne A.M., Johnson J.R., Nolan L.K., et al. The genome sequence of avian pathogenic Escherichia coli strain O1:K1:H7 shares strong similarities with human extraintestinal pathogenic E. coli genomes. J. Bacteriol. 2007;189:3228–3236. doi: 10.1128/JB.01726-06. [DOI] [PMC free article] [PubMed] [Google Scholar]
- Kingman J.F.C. On the genealogy of large populations. J. Appl. Probab. 1982a;19:27–43. [Google Scholar]
- Kingman J.F.C. The coalescent. Stochastic Process. Appl. 1982b;13:235–248. [Google Scholar]
- Larsson P., Oyston P.C., Chain P., Chu M.C., Duffield M., Fuxelius H.H., Garcia E., Halltorp G., Johansson D., Isherwood K.E., et al. The complete genome sequence of Francisella tularensis, the causative agent of tularemia. Nat. Genet. 2005;37:153–159. doi: 10.1038/ng1499. [DOI] [PubMed] [Google Scholar]
- Lawrence J.G., Roth J.R. Selfish operons: Horizontal transfer may drive the evolution of gene clusters. Genetics. 1996;143:1843–1860. doi: 10.1093/genetics/143.4.1843. [DOI] [PMC free article] [PubMed] [Google Scholar]
- Linz S., Radtke A., von Haeseler A. A likelihood framework to measure horizontal gene transfer. Mol. Biol. Evol. 2007;24:1312–1319. doi: 10.1093/molbev/msm052. [DOI] [PubMed] [Google Scholar]
- Lopes H.F., West M. Technical Report ISDS, Institute of Statistics and Decision Sciences, Duke University. Duke University; Durham, NC: 2004. Model uncertainty in factor analysis. [Google Scholar]
- Marri P.R., Hao W., Golding G.B. Gene gain and gene loss in Streptococcus: Is it driven by habitat? Mol. Biol. Evol. 2006;23:2379–2391. doi: 10.1093/molbev/msl115. [DOI] [PubMed] [Google Scholar]
- Maurelli A.T., Fernández R.E., Bloch C.A., Rode C.K., Fasano A. “Black holes” and bacterial pathogenicity: A large genomic deletion that enhances the virulence of Shigella spp. and enteroinvasive Escherichia coli. Proc. Natl. Acad. Sci. 1998;95:3943–3948. doi: 10.1073/pnas.95.7.3943. [DOI] [PMC free article] [PubMed] [Google Scholar]
- Metropolis N., Rosenbluth A.W., Rosenbluth M.N., Teller A.H., Teller E. Equations of state calculations by fast computing machines. J. Chem. Phys. 1953;21:1087–1091. [Google Scholar]
- Nakagawa I., Kurokawa K., Yamashita A., Nakata M., Tomiyasu Y., Okahashi N., Kawabata S., Yamazaki K., Shiba T., Yasunaga T., et al. Genome sequence of an M3 strain of Streptococcus pyogenes reveals a large-scale genomic rearrangement in invasive strains and new insights into phage evolution. Genome Res. 2003;13:1042–1055. doi: 10.1101/gr.1096703. [DOI] [PMC free article] [PubMed] [Google Scholar]
- Nie H., Yang F., Zhang X., Yang J., Chen L., Wang J., Xiong Z., Peng J., Sun L., Dong J., et al. Complete genome sequence of Shigella flexneri 5b and comparison with Shigella flexneri 2a. BMC Genomics. 2006;7:173. doi: 10.1186/1471-2164-7-173. [DOI] [PMC free article] [PubMed] [Google Scholar]
- Ochman H., Lawrence J.G., Groisman E.A. Lateral gene transfer and the nature of bacterial innovation. Nature. 2000;405:299–304. doi: 10.1038/35012500. [DOI] [PubMed] [Google Scholar]
- Perna N.T., Plunkett G., Burland V., Mau B., Glasner J.D., Rose D.J., Mayhew G.F., Evans P.S., Gregor J., Kirkpatrick H.A., et al. Genome sequence of enterohaemorrhagic Escherichia coli O157:H7. Nature. 2001;409:529–533. doi: 10.1038/35054089. [DOI] [PubMed] [Google Scholar]
- Petrosino J.F., Xiang Q., Karpathy S.E., Jiang H., Yerrapragada S., Liu Y., Gioia J., Hemphill L., Gonzalez A., Raghavan T.M., et al. Chromosome rearrangement and diversification of Francisella tularensis revealed by the type B (OSU18) genome sequence. J. Bacteriol. 2006;188:6977–6985. doi: 10.1128/JB.00506-06. [DOI] [PMC free article] [PubMed] [Google Scholar]
- Pol D., Siddall M. Biases in maximum likelihood and parsimony: A simulation approach to a 10-Taxon Case. Cladistics. 2001;17:266–281. doi: 10.1111/j.1096-0031.2001.tb00123.x. [DOI] [PubMed] [Google Scholar]
- Pupo G.M., Lan R., Reeves P.R. Multiple independent origins of Shigella clones of Escherichia coli and convergent evolution of many of their characteristics. Proc. Natl. Acad. Sci. 2000;97:10567–10572. doi: 10.1073/pnas.180094797. [DOI] [PMC free article] [PubMed] [Google Scholar]
- Rabiner L.R. A tutorial on hidden Markov models and selected applications in speech recognition. Proc. IEEE. 1989;77:257–286. [Google Scholar]
- Reid S.D., Herbelin C.J., Bumbaugh A.C., Selander R.K., Whittam T.S. Parallel evolution of virulence in pathogenic Escherichia coli. Nature. 2000;406:64–67. doi: 10.1038/35017546. [DOI] [PubMed] [Google Scholar]
- Riley M., Labedan B. Protein evolution viewed through Escherichia coli protein sequences: Introducing the notion of a structural segment of homology, the module. J. Mol. Biol. 1997;268:857–868. doi: 10.1006/jmbi.1997.1003. [DOI] [PubMed] [Google Scholar]
- Riley M., Abe T., Arnaud M.B., Berlyn M.K., Blattner F.R., Chaudhuri R.R., Glasner J.D., Horiuchi T., Keseler I.M., Kosuge T., et al. Escherichia coli K-12: A cooperatively developed annotation snapshot. Nucleic Acids Res. 2006;34:1–9. doi: 10.1093/nar/gkj405. [DOI] [PMC free article] [PubMed] [Google Scholar]
- Rohmer L., Fong C., Abmayr S., Wasnick M., Larson-Freeman T.J., Radey M., Guina T., Svensson K., Hayden H.S., Jacobs M., et al. Comparison of Francisella tularensis genomes reveals evolutionary events associated with the emergence of human-pathogenic strains. Genome Biol. 2007;8:R102. doi: 10.1186/gb-2007-8-6-r102. [DOI] [PMC free article] [PubMed] [Google Scholar]
- Silva F.J., Latorre A., Moya A. Genome size reduction through multiple events of gene disintegration in Buchnera APS. Trends Genet. 2001;17:615–618. doi: 10.1016/s0168-9525(01)02483-0. [DOI] [PubMed] [Google Scholar]
- Smoot J.C., Barbian K.D., Van Gompel J.J., Smoot L.M., Chaussee M.S., Sylva G.L., Sturdevant D.E., Ricklefs S.M., Porcella S.F., Parkins L.D., et al. Genome sequence and comparative microarray analysis of serotype M18 group A Streptococcus strains associated with acute rheumatic fever outbreaks. Proc. Natl. Acad. Sci. 2002;99:4668–4673. doi: 10.1073/pnas.062526099. [DOI] [PMC free article] [PubMed] [Google Scholar]
- Spratt B.G. Hybrid penicillin-binding proteins in penicillin-resistant strains of Neisseria gonorrhoeae. Nature. 1988;332:173–176. doi: 10.1038/332173a0. [DOI] [PubMed] [Google Scholar]
- Sumby P., Porcella S.F., Madrigal A.G., Barbian K.D., Virtaneva K., Ricklefs S.M., Sturde-Vant D.E., Graham M.R., Vuopio-Varkila J., Hoe N.P., et al. Evolutionary origin and emergence of a highly successful clone of serotype M1 group A Streptococcus involved multiple horizontal gene transfer events. J. Infect. Dis. 2005;192:771–782. doi: 10.1086/432514. [DOI] [PubMed] [Google Scholar]
- Swofford D., Waddell P., Huelsenbeck J., Foster P., Lewis P., Rogers J. Bias in phylogenetic estimation and its relevance to the choice between parsimony and likelihood methods. Syst. Biol. 2001;50:525–539. [PubMed] [Google Scholar]
- Troughton P.T., Godsill S.J. Technical Report CUED/F- INFENG/TR.304. 1997. A reversible jump sampler for autoregressive time series, employing full conditionals to achieve efficient model space moves. [Google Scholar]
- Vernikos G., Thomson N., Parkhill J. Genetic flux over time in the Salmonella lineage. Genome Biol. 2007;8:R100. doi: 10.1186/gb-2007-8-6-r100. [DOI] [PMC free article] [PubMed] [Google Scholar]
- Wei J., Goldberg M.B., Burland V., Venkatesan M.M., Deng W., Fournier G., Mayhew G.F., Plunkett G., Rose D.J., Darling A., et al. Complete genome sequence and comparative genomics of Shigella flexneri serotype 2a strain 2457T. Infect. Immun. 2003;71:2775–2786. doi: 10.1128/IAI.71.5.2775-2786.2003. [DOI] [PMC free article] [PubMed] [Google Scholar]
- Welch R.A., Burland V., Plunkett G., Redford P., Roesch P., Rasko D., Buckles E.L., Liou S.R., Boutin A., Hackett J., et al. Extensive mosaic structure revealed by the complete genome sequence of uropathogenic Escherichia coli. Proc. Natl. Acad. Sci. 2002;99:17020–17024. doi: 10.1073/pnas.252529799. [DOI] [PMC free article] [PubMed] [Google Scholar]
- Wren B.W. Microbial genome analysis: Insights into virulence, host adaptation and evolution. Nat. Rev. Genet. 2000;1:30–39. doi: 10.1038/35049551. [DOI] [PubMed] [Google Scholar]
- Yang F., Yang J., Zhang X., Chen L., Jiang Y., Yan Y., Tang X., Wang J., Xiong Z., Dong J., et al. Genome dynamics and diversity of Shigella species, the etiologic agents of bacillary dysentery. Nucleic Acids Res. 2005;33:6445–6458. doi: 10.1093/nar/gki954. [DOI] [PMC free article] [PubMed] [Google Scholar]


