Abstract
Concerted depolarization and Ca2+ rise during neuronal action potentials activate large-conductance Ca2+- and voltage-dependent K+ (BK) channels, whose robust K+ currents increase the rate of action potential repolarization. Gain-of-function BK channels in mouse knockout of the inhibitory β4 subunit and in a human mutation (αD434G) have been linked to epilepsy. Here, we investigate mechanisms underlying the gain-of-function effects of the equivalent mouse mutation (αD369G), its modulation by the β4 subunit, and potential consequences of the mutation on BK currents during action potentials. Kinetic analysis in the context of the Horrigan-Aldrich allosteric gating model revealed that changes in intrinsic and Ca2+-dependent gating largely account for the gain-of-function effects. D369G causes a greater than twofold increase in the closed-to-open equilibrium constant (6.6e−7→1.65e−6) and an approximate twofold decrease in Ca2+-dissociation constants (closed channel: 11.3→5.2 µM; open channel: 0.92→0.54 µM). The β4 subunit inhibits mutant channels through a slowing of activation kinetics. In physiological recording solutions, we established the Ca2+ dependence of current recruitment during action potential–shaped stimuli. D369G and β4 have opposing effects on BK current recruitment, where D369G reduces and β4 increases K1/2 (K1/2 μM: αWT 13.7, αD369G 6.3, αWT/β4 24.8, and αD369G/β4 15.0). Collectively, our results suggest that the D369G enhancement of intrinsic gating and Ca2+ binding underlies greater contributions of BK current in the sharpening of action potentials for both α and α/β4 channels.
INTRODUCTION
Large-conductance Ca2+- and voltage-activated K+ (BK) channels open in response to additive effects of Ca2+ and voltage to contribute to action potential repolarization in neurons. It is generally assumed that outward K+ currents through BK channels repolarize the cell and reduce excitability (Faber and Sah, 2003). However, in some neurons, the sharpening of action potentials due to increased BK channel activation has been found to facilitate high frequency firing (Brenner et al., 2005; Gu et al., 2007).
The observation that increased BK channel activation increases excitability in some neurons may explain the otherwise paradoxical finding that a human BK potassium channel gain-of-function mutation (D434G) is associated with epilepsy (Du et al., 2005). The D434G mutation resides in the RCK1 domain, a putative Ca2+-binding domain within the pore-forming α subunit (Jiang et al., 2001, Bao et al., 2002, Zeng et al., 2005). In heterologous expression systems, the D434G mutation speeds channel activation, increases steady-state open probabilities, and results in Ca2+-dependent G-V shifts consistent with increased Ca2+ sensitivity (Du et al., 2005; Diez-Sampedro et al., 2006).
In the context of the Horrigan-Aldrich (HA) model (Horrigan and Aldrich, 2002), BK channel gating is determined by three equilibria: a central “closed-to-open” step (also called intrinsic gating [L]), voltage sensor activation (J), and Ca2+ binding (K). These are coupled through allosteric interactions between them (C, D, E, respectively; see Table I). Changes in closed-to-open equilibrium can alter the apparent Ca2+ sensitivity of G-V relations (Wang and Brenner, 2006). In addition, increased “Ca2+ sensitivity” could arise through either changes in Ca2+ affinity (i.e., binding) or allosteric coupling between Ca2+ binding and gating.
TABLE I.
HA Model Gating Parameters (Horrigan and Aldrich, 2002)
| L | C-O equilibrium constant (unliganded channel, resting voltage sensors). |
| L=L0 exp(zLV/kT) | |
| L0, zL The zero voltage value of L and its partial charge, respectively. | |
| J | R-A equilibrium constant (closed, unliganded channel). |
| J = J0 exp(zJV/kT) | |
| J0, zJ The zero voltage value of J and its partial charge, respectively. | |
| K | Equilibrium constant for Ca2+ binding (closed channel, resting voltage sensors). |
| K=[Ca2+] / KC | |
| KC Ca2+ dissociation constant (closed channel, resting voltage-sensors). | |
| C | Allosteric factor describing interaction between channel opening and Ca2+ binding. |
| C = KC / KO | |
| KO Ca2+ dissociation constant (open channel, resting voltage-sensors). | |
| D | Allosteric factor describing interaction between channel opening and voltage sensor activation. |
| D = exp [-zJ (Vho-Vhc)/kT] | |
| VhO, VhC Half-activating voltage of QC and QO, respectively | |
| QC, QO Steady-state gating charge distribution for closed or open channels. | |
| E | Allosteric factor describing interaction between Ca2+ binding and voltage-sensor activation. |
In addition, it was observed that the inhibitory effect of β4 is lost in the D434G mutant channels (Diez-Sampedro et al., 2006).This is quite surprising because β subunit interaction domains have not previously been mapped to this region (RCK1 domain) of the channel (Wallner et al., 1996; Qian et al., 2002; Morrow et al., 2006). Further, this implies that the D434G epilepsy phenotype may partly result from a loss of modulation by β4.
Here, we seek to gain a better understanding of the effects of D434G mutation by using the equivalent mutation in the mouse BK channel (D369G). Guided by the HA allosteric gating model for BK channels (Horrigan and Aldrich, 2002), we used recording conditions to identify specific gating parameters altered by the mutation. We further reexamined effects of the mutation on BK channels coassembled with the inhibitory β4 subunit using conventional voltage step protocols as well as action potential–shaped stimuli to understand potential functional consequences. These studies reveal that the D369G mutation promotes channel activation by increasing both intrinsic gating and Ca2+ affinities. Although the mutation does not qualitatively perturb β4 inhibitory effects on activation kinetics, we did find that BK/β4 channels containing D369G show greater relative current during action potential–type stimuli. This may have important implications in understanding the D434G epileptic phenotype in humans.
MATERIALS AND METHODS
Patch Clamp Recording of HEK Cells
Experiments were performed with the mouse α subunit cDNA expression vector in pcDNA3 (GenBank accession no. MMU09383) and mouse β4 in the vector pcDNA3.1Hygro(+) (Invitrogen). The D369G mutation, originally described in the human gene (D434G in human) (Du et al., 2005), was introduced in the mouse α subunit cDNA using the Quick-Change Mutagenesis kit (Agilent Technologies) and verified by sequencing. The human α subunit wild-type cDNA (GenBank accession no. NM002247) and D434G mutant cDNAs were cloned in pCDNA 3.1. Expression constructs were transfected at a ratio of 1:10 α to β4 subunit using 2–3 µg of total DNA and 10 µl of lipofectamine reagent per 35-mm dish of HEK293 cells. After 5 h of incubation, the cells were re-plated on German glass coverslips (Bioindustrial Products) and analyzed by electrophysiology for the next 1–3 d. Green fluorescent protein expression from cotransfection (0.2 µg) of the EGFP-N1 vector (Clontech Laboratories, Inc.) was used to identify channel-expressing cells.
Macropatch recordings were made using the excised inside-out patch clamp configuration. Experiments were performed at 22°C. Data were sampled at 10- to 30-µs intervals and low-pass filtered at 8.4 kHz using the EPC8 four-pole bessel filter (HEKA). Data were analyzed without further filtering. Leak currents were subtracted after the test pulse using P/5 negative pulses from a holding potential of −120 mV. Patch pipettes (borosilicate glass; Sutter Instrument Co.) were coated with Sticky Wax (Kerr Corp.) and fire polished to ∼1.5–3-MΩ resistance.
The “symmetrical” external recording solution (electrode solution for Figs. 1–6) was composed of the following (in mM): 20 HEPES, 140 KMeSO3, 2 KCl, and 2 MgCl2, pH 7.2. The “physiological” external recording solution (electrode solution for Figs. 7 and 8) was composed of the following (in mM): 10 HEPES, 145 NaCl, 5 KCl, 1 MgCl2, and 2 CaCl2, pH 7.2. Internal solutions were composed of a pH 7.2 solution of the following (in mM): 20 HEPES, 140 KMeSO3, and 2 KCl. Intracellular Ca2+ was buffered with 5 mM EGTA (0.073 and 0.006 µM), HEDTA (2.1 and 0.363 µM) or NTA (41 µM), and free [Ca2+] was measured using a Ca2+-sensitive electrode (Orion Research, Inc.). In low Ca2+ solutions (0.073 and 0.006 µM), Ba2+ was chelated with 40 µM (+)-18-crown-6-tetracarboxylic acid (Cox et al., 1997).
Figure 1.
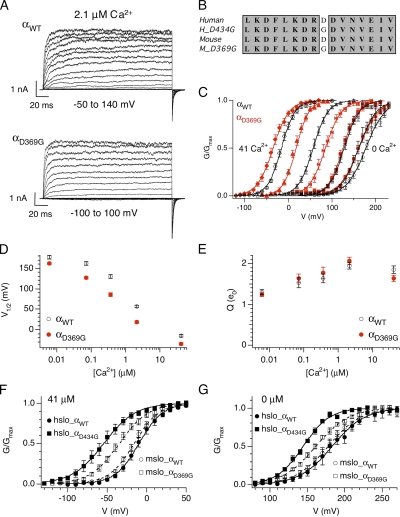
D369G shifts mslo steady-state G-V relation to hyperpolarizing membrane potentials. (A) A family of currents from wild-type (top) or D369G mutant (bottom) BK channels composed of only the pore forming α subunits. Recorded in 2.1 μM Ca2+, currents were evoked in response to 200-ms depolarizations at the indicated membrane potentials. (B) Alignment of amino acid sequence flanking the lysine (D) to glycine (G) epilepsy mutation. (C) Mean G-V relations at different Ca2+ for αWT and αD369G. Each point represents mean data from 5 to 26 experiments. Solid curves represent fits to the Boltzmann function. (D) Mean V1/2 and (E) mean effective gating charge (Q) values plotted as a function of Ca2+. Error bars represent SEM. (F) D434G shifts G-V to more negative membrane potentials at 41 µM Ca2+ compared to D369G (hslo_αWT: n = 9; hslo_αD434G: n = 10; mslo_αWT: n = 19; mslo_αD369G: n = 18). (G) D434G shifts G-V to more negative membrane potentials at nominal Ca2+ compared to D369G (hslo_αWT: n = 5; hslo_αD434G: n = 5; mslo_αWT: n = 12; mslo_αD369G: n = 14). Symbols represent mean G/Gmax data, curves represent fits to the Boltzmann function, and error bars represent SEM.
Figure 2.
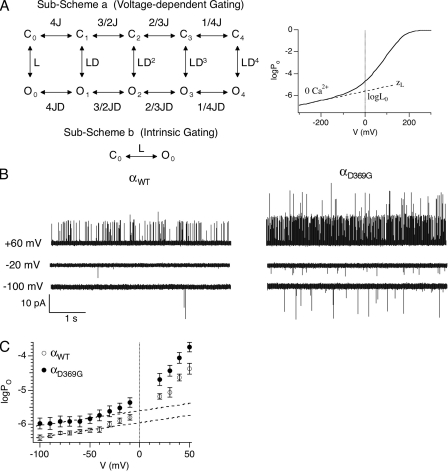
D369G decreases the energetic barrier for channel to open. (A; left) According to the dual-allosteric mechanism (Horrigan et al., 1999; Horrigan and Aldrich, 2002), BK channel transitions between closed (C) and open (O) conformation is allosterically regulated by the state of four independent and identical voltage sensors. Sub-Scheme a represents BK channel’s gating scheme at 0 Ca2+. The channel resides in either the open or closed conformation, with 0–4 voltage sensors in the activated state. The equilibrium between C-O transitions is allosterically regulated by the states of the voltage sensors. Sub-Scheme b represents BK channel’s gating scheme at 0 Ca2+ and very negative voltages. With all voltage sensors in the resting state, the channel resides in one of two conformations, C0 and O0. The equilibrium between the C0-O0 transition is described by L, the intrinsic equilibrium for channel opening in the absence of Ca2+ and voltage sensor activation. (Right) This illustrates how two components of L (L0 and zL) can be estimated by logPo-V data at 0 Ca2+ and negative voltages. The curve represents simulated logPo versus voltage curve in nominally 0 Ca2+. The gating parameters used for simulation are as follows: L0 = 2.5 × 10⁻⁶, zL = 0.25 e0, zJ = 0.54e0, VhC = 173 mV, and VhO = 25 mV. Dashed line represents fit for logPo-V at limiting slope using Eq. 4. L0 and zL can be derived from the fit (Horrigan and Aldrich, 2002). (B) Single-channel BK currents recorded in nominally 0 [Ca2+] at the indicated voltages. αWT and αD369G data were obtained from patches containing estimated 64 and 317 channels, respectively. All traces were filtered at 5 kHz. (C) D369G increases L0. Mean logPo plotted as a function of voltage in nominally 0 Ca2+ (αWT: n = 5–13; αD369G: n = 6–11). Error bars represent SEM. L0 was estimated by linear fits (dashed lines) of logPo-V relations between −100 to −50 mV using Eq. 1. zL value was set as 0.25 e0.
Figure 3.
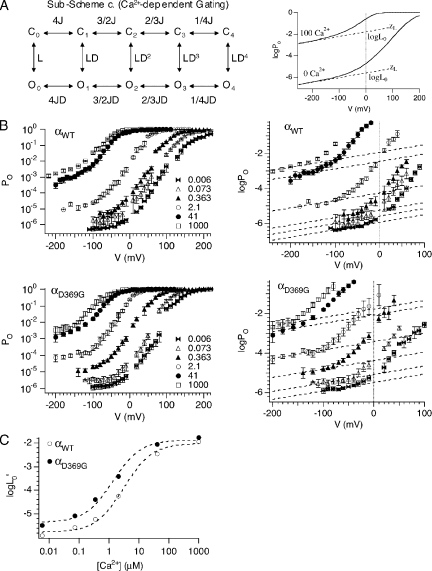
D369G increases channel’s Ca2+-binding affinities. (A; left) According to the dual-allosteric mechanism (Horrigan and Aldrich, 2002), BK channel transitions between closed (C) and open (O) conformation are allosterically regulated by the state of four independent and identical Ca2+-binding sites. Sub-Scheme c represents BK channel’s gating scheme at very negative voltages, where voltage sensors remain in the resting states. The channel resides in either closed or open conformations, with 0–4 Ca2+-binding sites occupied. The equilibrium between the C-O transitions is allosterically regulated by the states of the Ca2+-binding sites. In the absence of voltage sensor activation, voltage dependence of the C-O transition is entirely dependent on zL. (Right) This illustrates how logL0′ can be estimated by logPo-V data at high Ca2+ and very negative voltages. Curves are simulated logPo-V curves in nominally 0 Ca2+ and 100 μM Ca2+ according to Sub-Scheme c. The gating parameters used for simulation are as follows: L0 = 2.5 × 10⁻⁶, zL = 0.25 e0, zJ = 0.54 e0, VhC = 173 mV, VhO = 25 mV, KC = 13.9 µM, and KO = 1.4 µM. Dashed lines represent fits for logPo-V at limiting slopes using Eq. 8. L0′ and zL can be derived from the fits (Horrigan and Aldrich, 2002). (B) Symbols represent averaged logPo-V relations at various Ca2+. Error bars represent SEM. Dashed lines are fits for mean logPo-V at limiting slope using Eq. 2 and zL of 0.25 e0. (C) Open and closed symbols are logL0′ versus Ca2+ for αWT and αD369G BK channels, respectively. Curves represent fits of logL0′-Ca2+ using Eq. 3.
Figure 4.
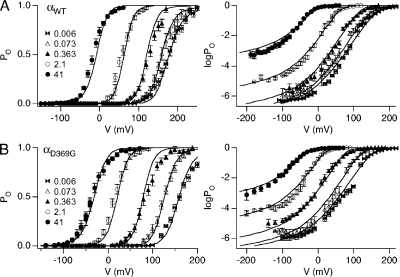
Changes in Ca2+ affinities and intrinsic gating are sufficient to account for changes between αWT (A) and αD369G (B). Fits (curve and gating parameters listed in Table II) are compared with average PO-V and logPo-V data (symbols).
Figure 5.
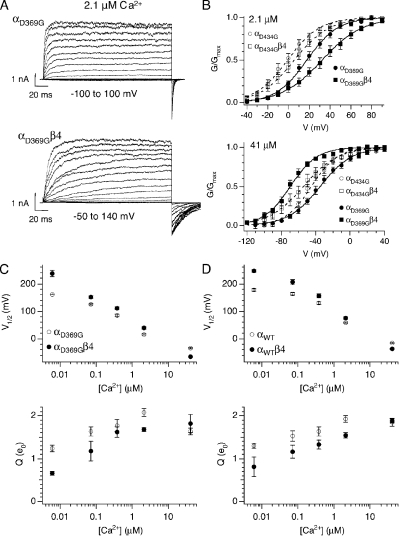
Ca2-dependent effects of β4 on mutant BK channel G-V. (A) A family of currents from αD369G BK channels composed of either the pore forming alone (top) or with the β4 auxiliary subunits (bottom). Recorded in 2.1 µM Ca2+, currents were evoked in response to 200-ms depolarizations. (B, top) Effect of β4 on mslo and hslo mutant G-V relations at 2.1 µM Ca2+ (hslo_αD434G: n = 7; hslo_αD434G β4: n = 9; mslo_αD369G: n = 22; mslo_αD369G β4: n = 32). (B, bottom) Effect of β4 on mslo and hslo mutant G-V relations at 41 µM Ca2+ (hslo_αD434G: n = 10; hslo_αD434G β4: n = 11; mslo_αD369G: n = 18; mslo_αD369G β4: n = 15). Symbols represent mean G/Gmax data, curves represent fits to the Boltzmann function, and error bars represent SEM. (C) Effects of β4 on steady-state gating of mutant channels. Mean V1/2 (top) and mean effective gating charge (Q) values (bottom) plotted as a function of Ca2+. Error bars represent SEM. (D) Effects of β4 on steady-state gating of wild-type channels. Mean V1/2 (top) and mean effective gating charge (Q) values (bottom) plotted as a function of Ca2+. Error bars represent SEM.
Figure 6.
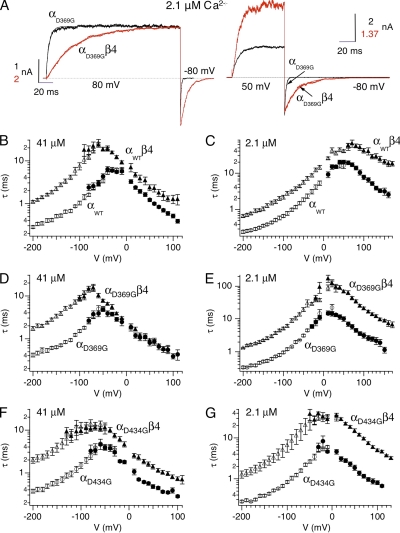
Effects of β4 on D369G BK channel gating kinetics. (A; left) Compare activation kinetics. αD369G and αD369Gβ4 currents at 2.1 µM Ca2+. Patches were held at −80 mV and stepped to +80 mV for 200 ms. Superimposed on the current traces are the single-exponential fits to the activation time courses (αD369G: τ = 4.7 ms; αD369Gβ4: τ = 40.3 ms). (Right) Compare deactivation kinetics. αD369G and αD369Gβ4 currents at 2.1 µM Ca2+. Channels were activated at +50 mV before membrane was stepped to −80 mV for 100 ms. Superimposed on the current traces are the single-exponential fits to the deactivation time courses (αD369G: τ = 1.1ms; αD369Gβ4: τ = 11.7 ms). (B) Comparison of αWT and αWTβ4 channel kinetics at 41 µM Ca2+ (αWT activation: n = 8–26; αWT deactivation: n = 12; αWTβ4 activation: n = 13–35; αWTβ4 deactivation: n = 16–21). (C) Comparison of αWT and αWTβ4 channel kinetics at 2.1 µM Ca2+ (αWT activation: n = 17; αWT deactivation: n = 6–30; αWTβ4 activation: n = 7–22; αWTβ4 deactivation: n = 11–12). (D) Comparison of αD369G and αD369Gβ4 channel kinetics at 41 µM Ca2+ (αD369G activation: n = 5–18; αD369G deactivation: n = 13–14; αD369Gβ4 activation: n = 5–16; αD369Gβ4 deactivation: n = 13). (E) Comparison of αD369G and αD369Gβ4 channel kinetics at 2.1 µM Ca2+ (αD369G activation: n = 5–23; αD369G deactivation: n = 13–19; αD369Gβ4 activation: n = 6–34; αD369Gβ4 deactivation: n = 8–20). (F) Comparison of αD434G and αD434Gβ4 channel kinetics at 41 µM Ca2+ (αD434G activation: n = 11; αD434G deactivation: n = 7; αD434Gβ4 activation: n = 11; αD434Gβ4 deactivation: n = 10). (G) Comparison of αD434G and αD434Gβ4 channel kinetics at 2.1 µM Ca2+ (αD434G activation: n = 7; αD434G deactivation: n = 5; αD434Gβ4 activation: n = 9; αD434Gβ4 deactivation: n = 9). Filled symbols represent measurements obtained from tail currents (deactivation time constant), and empty symbols represent measurements obtained from activation time constant.
Figure 7.
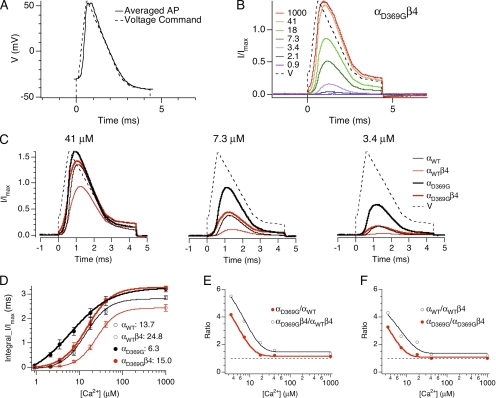
Ca2+-dependent effects of the mutation on BK channel recruitment by spike-shaped depolarization. (A) Voltage command of the spike-shaped depolarization (dashed line) approximating average DG granule cell action potentials (trace). (B) Representative patch showing αD369Gβ4 current evoked by spike depolarization and various intracellular Ca2+. (C) Average BK current for different channels at 41 µM Ca2+ (αWT: n = 19; αWTβ4: n = 16; αD369G: n = 22; αD369Gβ4: n = 18), 7.3 µM Ca2+ (αWT: n = 10; αWTβ4: n = 11; αD369G: n = 16; αD369Gβ4: n = 9), and 3.4 µM Ca2+ (αWT: n = 9; αWTβ4: n = 8; αD369G: n = 12; αD369Gβ4: n = 7). Currents in B and C were normalized to maximal current size obtained from 0 mV tail current (0 mV) at saturating (1 mM) Ca2+. (D) Average current integral as a function of intracellular Ca2+ concentration. Error bars represent SEM. Curves represent fits to Hill equations (αWT: K1/2 = 13.7, n = 1.6; αWTβ4: K1/2 = 24.8, n = 1.9; αD369G: K1/2 = 6.3, n = 0.9; αD369Gβ4: K1/2 = 15.0, n = 1.5). (E) Fold increase in current resulting from the D369G mutation measured from ratio values (from D) of αD369G/αWT (red) and αD369Gβ4/ αWTβ4 (green). (F) Fold increase in current resulting from channels lacking β4 measured from ratio values (from D) of α/αWTβ4 (green) and αD369G/αD369Gβ4 (blue).
Figure 8.
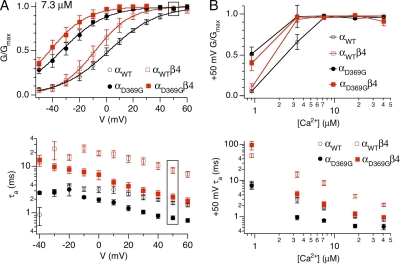
Ca2+-dependent effects of the mutation on BK channel gating in “physiological” solutions. (A; top) Average G-V relationship at 7.3 µM Ca2+ (αWT: n = 18; αWTβ4: n = 10; αD369G: n = 8; αD369Gβ4: n = 10). (Bottom) Average activation time constants at 7.3 µM Ca2+ (αWT: n = 15; αWTβ4: n = 10; αD369G: n = 8; αD369Gβ4: n = 9). Boxed regions indicate values at +50 mV. (B; top) G/Gmax versus Ca2+ concentration at +50 mV. (Bottom) Average activation time constants at +50 mV as a function of Ca2+ concentration.
Analysis of Macroscopic Currents
G-V relationships were obtained using a test pulse followed by a step to a post test voltage to measure instantaneous tail current 200 microseconds after the test pulse. For symmetrical Ca2+, +60 mV was used for 0.073 and 0.006 µM Ca2+ and −80 mV was used for higher Ca2+. For physiological external solutions, 0 mV was used. In experiments where Gmax was not reached, Gmax values at higher [Ca2+] from the same patch was used. G/Gmax-V data were fit with the Boltzmann function, G/Gmax = 1/(1 + eZF(V1/2−V)/RT), where V is the test potential, V1/2 is the membrane potential at half-maximal conductance, Q is the effective gating charge, and F, R, and T are constants.
For action potential–shaped stimuli, we used the physiological pipette solution described above. The action potential stimulus waveforms were ramp voltage steps designed to simulate action potentials from wild-type dentate gyrus (DG) granule neurons during 105-pA current injections (Brenner et al., 2005). Prepulse is −80 mV for 100 msec, followed by a 0.1-msec step to a threshold voltage of −30 mV. Action potential rise is from −30 to +57 mV over 0.5 msec. Repolarization is in three phases: from +57 to −28 mV over 2 msec, −28 to −38 mV for 0.56 msec, and −38 to −42 mV in 1.2 msec. To subtract capacitance and leak currents, a P/5 leak subtraction protocol was used from a holding potential of −120 mV. The action potential currents were normalized to maximal current in the same patch measured from the tail current (0 mV) after a maximal activating 40-msec square wave stimulus in 1 mM of internal calcium concentration.
Single-Channel Analysis
Single-channel opening events were obtained from patches containing one to hundreds of channels. Recordings are of 20 s to hundreds of seconds long. Analysis was performed using TAC and TACFIT programs (Bruxton Corporation). NPO was determined using either all-point amplitude histogram or by event detection using a 50% amplitude criteria. The probability (Pk) of occupying each open level (k) gave rise to NPO:
 . PO was then determined by normalizing NPO values by channel number (N). N was obtained from the instantaneous tail current amplitude during maximal opening at saturating [Ca2+] divided by the single-channel current for each channel at the tail voltage.
RESULTS
D369G Increases BK Channel Opening
A mouse BK channel mutation (αD369G) equivalent to αD434G in humans (Fig. 1 B) was generated and transiently expressed in HEK 293 cells. Ionic currents were recorded using excised inside-out patches to allow control of [Ca2+] at the cytoplasmic side of the membrane. Fig. 1 A shows representative BK currents in response to test voltage steps in 2.1 µM of internal Ca2+. Tail current amplitudes (G at −80 mV) were normalized to maximum tail current (Gmax at −80 mV) to generate average G-V (G/Gmax-V) relationships. Relative to αWT, G-V relationships are consistently shifted to negative potentials for αD369G (Fig. 1 C). Plots of V1/2 (voltage at half-maximal G/Gmax) versus Ca2+ demonstrate more dramatic shifts at intermediate Ca2+ (between 0.073 and 2.1 µM) and smaller shifts at low (nominal) and high Ca2+ (41 µM; Fig. 1 D; values are listed in Table II). The D369G mutation, however, does not significantly alter the slope or the equivalent gating charge (Q) of the G-V relationship (Fig. 1 E and Table II).
TABLE II.
G-V Parameters
| Ca2+ (μM) | αWT | αD369G | αWTβ4 | αD369Gβ4 | ||||||||
| V1/2 (mV) | Q (e0) | n | V1/2 (mV) | Q (e0) | n | V1/2 (mV) | Q (e0) | n | V1/2 (mV) | Q (e0) | n | |
| 0.006 | 177.6 ± 4.0 | 1.30 ± 0.06 | 12 | 161.5 ± 2.5 | 1.23 ± 0.05 | 14 | 246.1 ± 3.8 | 0.81 ± 0.23 | 4 | 237.2 ± 12.2 | 0.66 ± 0.05 | 9 |
| 0.073 | 162.5 ± 5.2 | 1.53 ± 0.12 | 13 | 126.2 ± 3.0 | 1.63 ± 0.11 | 9 | 206.4 ± 9.7 | 1.16 ± 0.16 | 6 | 150.9 ± 3.74 | 1.34 ± 0.13 | 9 |
| 0.363 | 130.2 ± 3.8 | 1.63 ± 0.11 | 15 | 85.6 ± 4.3 | 1.77 ± 0.14 | 16 | 155.8 ± 6.2 | 1.33 ± 0.10 | 19 | 111.0 ± 3.8 | 1.84 ± 0.12 | 10 |
| 2.1 | 57.3 ± 3.1 | 1.93 ± 0.08 | 26 | 16.2 ± 3.1 | 2.06 ± 0.09 | 22 | 74.5 ± 5.6 | 1.54 ± 0.06 | 19 | 40.2 ± 3.6 | 1.62 ± 0.05 | 32 |
| 41 | −15.7 ± 2.5 | 1.85 ± 0.09 | 19 | −34.3 ± 3.6 | 1.63 ± 0.08 | 18 | −36.9 ± 2.8 | 1.88 ± 0.04 | 38 | −65.6 ± 2.7 | 1.77 ± 0.13 | 15 |
The values shown are Boltzmann-fit parameters. They indicate mean ± sem.
Effects of D369G on V1/2 and Q are qualitatively similar to previous descriptions of the equivalent human D434G mutation (Du et al., 2005; Diez-Sampedro et al., 2006), confirming that D369G is a gain-of-function mutation. We directly compared effects of the mutation on human (hslo) and mouse (mslo) channels at 41 and 0 µM Ca2+. Although effects were qualitatively similar, D434G produced larger G-V shifts on hslo than D369G did on mslo. At 41 µM Ca2+, ΔV1/2 for hslo and mslo are ∼−35 and −20 mV, respectively (Fig. 1 F). At 0 Ca2+, ΔV1/2 for hslo and mslo are ∼−36 and −16 mV, respectively (Fig. 1 G). Whereas the size of G-V shift at 41 µM Ca2+ is comparable to previous results on the hslo mutant channel (Du et al., 2005; Diez-Sampedro et al., 2006), negative shift at 0 Ca2+ was not observed previously (Diez-Sampedro et al., 2006).
Increased Intrinsic Gating and Ca2+-binding Affinities Underlie Increased Channel Opening of the D369G Mutation
To better understand how the D369G mutation alters BK channel gating, we used recording conditions that isolate the effects on intrinsic gating from Ca2+- and voltage-dependent gating. Fig. 2 A illustrates how intrinsic gating (closed-to-open transition in the absence of Ca2+ binding and voltage sensor activation) can be examined. At 0 Ca2+, we observe gating of primarily unliganded channels (i.e., with 0 Ca2+ bound). In the context of the HA model, these reside in 1 of 10 states: closed or open, with 0–4 voltage sensors activated (Fig. 2 A, Sub-Scheme a) (Horrigan and Aldrich, 2002). At 0 Ca2+ and very negative membrane potentials (i.e., toward the “limiting slope” of the G-V curve, where voltage sensors are not activated), channels reside primarily in either C0 or O0 (Fig. 2 A, Sub-Scheme b) (Horrigan and Aldrich, 2002). LogPO at the limiting slope is only weakly voltage dependent, reflecting the weak voltage dependence of closed-to-open transition. Fitting the limiting slope phase of logPo-V relations (Fig. 2 A, right panel) by
 |
(1) |
provides an estimate of intrinsic gating (L0) and the weak voltage dependence due to the closed-to-open transition (ZL) (Horrigan and Aldrich, 2002). Fig. 2 B shows representative currents recorded at 0 Ca2+ for estimation of these parameters. Although these membrane patches contain tens to hundreds of channels, only single-channel openings were observed under these conditions. There is a striking drop in the voltage dependence of Po below −20 mV, which likely reflects relaxation of voltage sensors (and thus “intrinsic” gating). This is reflected in the average logPO-V relationships that show a similar limiting slope voltage dependence (ZL, dashed line) in both αWT and αD369G channels (Fig. 2 C). However, αD369G has an increased logPo relative to αWT in this portion of the curve, indicating an increased intrinsic gating (Fig. 2 C). Fitting of the logPO-V relationship at the limiting slope (using Eq. 1) estimates a greater than twofold increase in intrinsic gating equilibrium constant for αD369G over αWT (2.49 ± 0.08e−6 vs. 1.12 ± 0.02e−6, respectively; see Table III). This could contribute to the leftward G-V shift for αD369G seen in nominal Ca2+ (Fig. 1 C). In addition, the observation that logPo deflects from the limiting slope at similar voltages (∼−30 mV; Fig. 1 C) for αWT and αD369G suggests that open-channel voltage sensors are not altered by the D369G mutation (Wang and Brenner, 2006).
TABLE III.
Gating Parameters Based on Limiting Slope logP0
| αWT | αD369G | |
| L0 | 1.12 ± 0.02e−6 | 2.49 ± 0.08e−6 |
| KC (μM) | 8.7 ± 0.8 | 3.8 ± 1.0 |
| KO (μM) | 1.0 ± 0.2 | 0.5 ± 0.1 |
| C | 8.7 ± 0.8 | 7.5 ± 0.8 |
To understand how the mutation might affect Ca2+ sensitivity, we recorded current at very negative voltages, but over a range of Ca2+ (Fig. 3, A and B). At very negative voltages where voltage sensors are not activated, the channel resides in 1 of 10 states: closed or open, with 0–4 subunits bound to Ca2+ (Fig. 3 A, Sub-Scheme c). The limiting slope logPO-V was fitted using
 |
(2) |
to obtain an estimate of channel open probability at a corresponding Ca2+ in the absence of voltage sensor activation (Horrigan and Aldrich, 2002). The limiting slope PO’s at 0 mV (L0’) were plotted as a function of Ca2+ concentration and fitted using
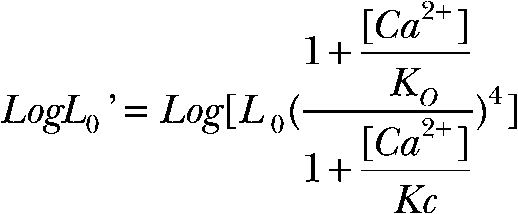 |
(3) |
to estimate open- and closed-channel Ca2+-binding affinity of KO and KC, respectively, and coupling between Ca2+ binding and gating (C = KC/KO) (Horrigan and Aldrich, 2002). For the αD369G channels, the log(L0’) versus [Ca2+] curve is shifted to lower Ca2+ concentrations compared with αWT channels, with a small decrease in the slope (Fig. 3 C). Fitting of the data using Eq. 3 indicates that the D369G mutation does not alter the coupling between Ca2+ binding and gating (CD369G = 7.5 ± 0.8; CWT = 8.7 ± 0.8), but increases apparent Ca2+-binding affinities of both the closed (KC_D369G = 3.8 ± 1.0 µM; KC_WT = 8.7 ± 0.8 µM) and open channels (KO_D369G = 0.5 ± 0.1 µM; KO_WT = 1.0 ± 0.2 µM; 2.3- and twofold, respectively; see Table III). In summary, the major effects of the D369G mutation are increases in apparent Ca2+-binding affinities and intrinsic gating, both of which contribute to higher PO.
To determine whether changes in intrinsic gating (L0) and Ca2+ affinities (KC and KO) are sufficient to account for differences between αWT to αD369G, we simultaneously fitted PO and log(Po)--V data (Fig. 4) using the allosteric gating model. The voltage-dependent parameters were fixed at αWT values to determine if changes in other parameters are sufficient to fit the data. The resulting parameters are very similar to those obtained from the above measurements (Table IV) and fit the data reasonably well (Fig. 4, A and B). There is a predicted 2.5-fold increase in L0 and a 2.2- and 1.7-fold increase in closed- (1/KC) and open-channel (1/KO) Ca2+-binding affinity, respectively. These results indicate that changes in these parameters can largely account for the increased channel openings observed in the αD369G mutant channels.
TABLE IV.
Gating Parameters Based on PO and logPO
| αWT | αD369G | ||
| L0 | 6.6e−7 ± 3e−8 | 1.65e−6 ± 3e−8 | |
| KC (μM) | 11.3 ± 0.2 | 5.2 ± 0.1 | |
| KO (μM) | 0.92 ± 0.02 | 0.54 ± 0.01 | |
| E | 4.9 ± 0.2 | 7.6 ± 0.2 | |
| zL (e0) | 0.25 | ||
| zJ (e0) | 0.58 | ||
| VhC (mV) | 181.7 | ||
| VhO (mV) | 14.8 |
β4 Modulation of Steady-state and Kinetic Properties of D369G Channels
A previous study indicated that the BK channel’s accessory β4 subunit has little effect on the V1/2 of human D434G channels (Diez-Sampedro et al., 2006). This raised the possibility that D369G perturbs co-assembly or functional interactions with the β4 subunit. In addition, it suggests that the D369G mutation may cause more severe defects in β4-expressing neurons, where β4 otherwise inhibits channel opening. We tested these ideas by coexpressing αWT or αD369G with or without β4 (Fig. 5 A). We observed that coexpression of the β4 subunit resulted in shifted G-V relations in D369G mutant channels (Fig. 5 B and Table II), indicating that β4 does indeed modulate steady-state gating of the mutant. Similar to wild-type channels (Fig. 5 D, top), β4 causes a negative G-V shift at high Ca2+ (41 µM Ca2+) and positive G-V shifts at lower Ca2+ concentrations (<2.1 µM Ca2+; Fig. 5 C, top) (Wang et al., 2006). Also, β4 reduces the equivalent gating charge (slope of G-V relation) of D369G channels (Fig. 5 C, bottom), similar to wild-type channels (Fig. 5 D, bottom) (Wang et al., 2006).
The effects of β4 on the gating kinetics of αD369G channels are also similar to its effects on αWT. At 2.1 µM, step depolarization from −80 to +80 mV activates αD369G/β4 channels visibly slower compared with αD369G channels (Fig. 6 A, left). Similarly, αD369G/β4 channels deactivate more slowly compared with αD369G channels (Fig. 6 A, right). At 41 and 2.1 µM Ca2+, we observed qualitatively similar effects of β4 on αWT and αD369G channel–gating kinetics (Fig. 6, B–E); β4 coexpression results in slowed activation kinetics, and this effect is greater at lower Ca2+ compared with higher Ca2+ (Fig. 6, B–E, filled symbols).
β4 shift of both mouse αWT and αD369G V1/2 is in contrast with a previous study showing that β4 affects V1/2 of human αWT, but not the equivalent human mutation (αD434G) (Diez-Sampedro et al., 2006). In the previous study, α and β4 were transfected in a low ratio (3:1 ratio; Diez-Sampedro et al., 2006), raising the possibility that β4 was not saturated for D434G channels. Here, we transfected D434G and β4 in a 1:10 ratio to examine the effects of β4 on hslo D434G channels (Fig. 5 B). The effects of β4 on D434G G-V relations at 41 and 2.1 µM Ca2+ are small, similar to the previous observation (Diez-Sampedro et al., 2006). However, the β4 subunit does interact with human αD434G channels as suggested by the dramatic slowing of activation and deactivation kinetics (Fig. 6, F and G). In summary, these results indicate that effects of β4 on steady-state opening of the epilepsy gain-of-function mutation are larger for mslo compared with hslo. However, activation kinetics of mslo and hslo mutant channels are dramatically slowed by β4, suggesting that recruitment of both channels during action potentials would be reduced by β4.
The D369G Mutation Alters the Ca2+ Dependence of BK Currents during Action Potential–shaped Voltage Commands
Recruitment of BK channel current during an action potential depends critically on the time course of channel opening as a function of membrane voltage and Ca2+. To consider the relative current activation during action potentials, we used voltage commands designed to mimic those of action potentials measured in neurons (hippocampus DG granule cells, where the β4 subunit is expressed) (Brenner et al., 2005). The recordings were conducted using physiological ionic concentrations of K+ and Na+ to mimic a physiological K+-driving force and to account for possible effects of these ionic conditions on channel activation.
Fig. 7 A shows the command voltage (dashed line) superimposed on an averaged action potential waveform (trace) from wild-type (α/β4) DG granule neurons (Brenner et al., 2005). Representative recordings from a single αD369G/β4 patch at various internal Ca2+ is shown in Fig. 7 B. BK currents were activated with a small delay after the voltage command. The normalized BK currents show a graded increase with increasing Ca2+. Fig. 7 C shows averaged BK currents at the indicated Ca2+ where BK current sizes follow the trend: αD369G > αD369G/β4 ≈ αWT > αWT/β4. As predicted by the gating kinetics in Fig. 6, β4 inhibition of both αWT (thin red vs. thin black) and αD369G (thick red vs. thick black) current recruitment is much greater at low than at higher Ca2+ concentration (Fig. 7 C). The increase of current activation by the D369G mutation in the presence (thick vs. thin red) or absence (thick vs. thin black) of β4 subunits is also greater at lower [Ca2+] (Fig. 7 C).
Summary data across a broad range of Ca2+ for different channels is plotted in Fig. 7 D. D369G and the β4 subunit have opposing effects on current recruited during action potential stimuli. β4 shifts the dose–response of both mutant and wild type so that higher Ca2+ is required to recruit BK current, whereas the D369G mutation shifts the dose–response of α and α/β4 channels toward lower Ca2+. Indeed, there is a roughly twofold increase in apparent K1/2 for D369G channels and a twofold decrease in apparent K1/2 for β4-containing wild-type channels (Fig. 7 D). Interestingly, the effect of the D369G mutation is to shift αD369G/β4 channels to a dose–response overlapping αWT channels lacking the β4 subunit. In addition, αD369G channels have a higher maximal current integral at saturating Ca2+ (Fig. 7 D). The relative effects of the D369G mutation and β4 are quantified by comparing relative ratio of current recruitment as a function of the D369G mutation (Fig. 7 E) or as a function of the β4 subunit (Fig. 7 F). The results clearly indicate that the effect of D369G and β4 are most dramatic at low Ca2+ and are Ca2+ independent at Ca2+ >18 µM. For example, there is an approximately four- to sixfold increase in BK current with the D369G mutation (Fig. 7 E) and an approximately three- to fourfold reduction of BK current with β4 subunit (Fig. 7 F) at 3.4 µM Ca2+. At lower Ca2+, the current recruited is too small for estimation of fold changes.
Analysis of the G-V and τa-V relations (with the physiological ionic conditions used in the experiments above) indicates that activation kinetics determine the relative current recruitment during action potential stimuli. For example, at 7.3 µM Ca2+, steady-state open probability is maximal for all channels at the peak action potential voltage of +50 mV (boxed in Fig. 8 A, top). Rather, the relative activation taus at +50 mV (boxed in Fig. 8 A, bottom) correlate well with the current recruitment during the action potential stimulus (Fig. 7 F). Thus, β4-mediated slowing of activation (8.1 ± 1.2 msec) effectively precludes αWT channel opening during the relatively short action potential time window. In contrast, β4 slows αD369G to time constants (2.9 ± 0.4 msec) that allow significant BK channel activation. This is consistent across Ca2+ concentrations, which show high steady-state conductance at +50 mV for either αWT or αD369G channels, with or without β4 (Ca2+ > 0.9 µM; Fig. 8 B). Nevertheless, αD369G, which displayed the fastest gating kinetics, showed the largest action potential–evoked BK currents (Fig. 8 B). αD369G/β4 and αWT channels have intermediate activation rates and current recruitment. Finally, the slowest gating αWT/β4 has the least current recruitment.
DISCUSSION
In the context of the HA allosteric gating model, our analysis suggest that mslo D369G is a gain-of-function mutation affecting two aspects of gating. It favors opening independently of Ca2+ and voltage sensor activation, with an approximate twofold increase of the closed-to-open equilibrium constant (L0). It increases the channel’s Ca2+ sensitivity by an approximate twofold increase of the Ca2+-binding equilibrium constant (K). Given that D369 is located in RCK1, a putative Ca2+-sensing domain (Zeng et al., 2005), it was not surprising to see that the mutation affects Ca2+ binding. The D369G mutation does not greatly alter the allosteric interaction between channel opening and Ca2+ binding (C), nor voltage-dependent gating.
Similar gating effects may be shared by the hslo (D434G) mutation. Changes in G-V slopes were not observed in the mutation (Du et al., 2005; Diez-Sampedro et al., 2006). In addition, the mutation does not alter Mg2+ facilitation of opening (Diez-Sampedro et al., 2006), which is highly dependent on voltage sensor activation (Yang et al., 2007; Horrigan and Ma, 2008). These observations suggest that D434G has little effects on voltage-dependent gating. Negative G-V shift by the mutation in 0 Ca2+ was observed in our study, suggesting that D434G increases channels’ closed-to-open equilibrium constant. Finally, consistent with the possibility that D434G alters Ca2+ binding instead of coupling, shifts of G-V by D434G are greater at intermediate Ca2+ compared with nominal and saturating Ca2+ (Du et al., 2005; Diez-Sampedro et al., 2006).
One difference between studies was that the 0 Ca2+ G-V shift by hslo D434G mutation was not previously observed (Diez-Sampedro et al., 2006). A possible explanation is that the previous study may have overestimated G/Gmax for the wild-type channels, with +210 mV being the maximum voltage step. In our study, the wild-type channel reaches Gmax at around +270 mV, and G/Gmax at +210 mV is estimated to be 0.77 (Fig. 1 G). Consistent with this possibility, V1/2 values for D434G channels are similar between the two studies (∼+150 mV), but our V1/2 estimate for wild-type channels (∼+180 mV) is higher.
Our study observed some differences in β4 effects between the human and mouse mutant channels. Interestingly, although β4 affects wild-type and D369G mslo G-V relations in a similar manner, it only weakly affected mutant hslo G-V relations (consistent with previous observations; Diez-Sampedro et al., 2006). Whereas β4 slows the activation of both hslo D434G and mslo D369G at low Ca2+, at high Ca2+ (41 µM) β4 slows the activation of D434G (threefold), but not mslo D369G. As a consequence, one may expect that β4 reduces recruitment of the D434G mutation more than that of D369G at high Ca2+. These findings suggest that at some Ca2+, β4 may have differing effects on human versus mouse neurons containing the epilepsy mutation.
BK channels have very depolarized G-V relations in the absence of Ca2+ and require micromolar Ca2+ to open at physiological membrane potentials (i.e., neuronal voltages between −100 to +60 mV) (Cui et al., 1997). BK channels are often colocalized with Ca2+ sources such as voltage-dependent Ca2+ channels, ryanodine receptors, and NMDA receptors (Davies et al., 1996; Marrion and Tavalin, 1998; Prakriya and Lingle, 2000; Isaacson and Murphy, 2001; Parsons et al., 2002; Berkefeld et al., 2006; Berkefeld and Fakler, 2008). Using the short time window of action potential–like voltage commands reveals the relatively high Ca2+ concentrations required to activate BK channels during neuronal action potential firing. Little BK current is observed below 2.1 and 3.4 µM Ca2+, with K1/2 of 13.7 and 24.8 µM, respectively, for wild-type BK/α and BK/αβ4 channels. These high μM Ca2+ concentrations suggest that neuronal BK channels are especially suited to respond to high local Ca2+ rises; much greater than global Ca2+ generally attains (Fakler and Adelman, 2008).
Our Ca2+ dose–response curves may also provide some footing for estimation of local Ca2+ that BK channels sense in neurons. Previous studies in DG granule neurons indicate that β4 reduces BK channel activation during the action potential, whereas knockout of β4 allows greater BK channel contribution to action potential repolarization (Brenner, et al., 2005). The Ca2+ dose–response curves (Fig. 7 D) suggest that β4 inhibition most effectively occurs at Ca2+ below 41 µM during action potential–type stimuli. This is somewhat lower than the estimated 40–50 µM of calcium nanodomain that BK channels experience during action potentials of DG neurons (Muller et al., 2007). The discrepancies may be due to the fact that we used constant buffered Ca2+ to activate BK channels in our experiments, whereas neuronal BK channels experience dynamic changes of Ca2+ in response to voltage-dependent Ca2+ channel activation and deactivation during an action potential. Thus, in neurons, BK channels may sense somewhat larger peak calcium increases but over a more transient time course. In addition, the BK channel and cellular environment may be different between neurons and HEK cells due to differences in BK channel phosphorylation state, alternative splicing, or redox status. In other ways, however, experiments performed in HEK cells provide certain advantages. Analyzing isolated macroscopic BK currents in excised patches takes into account both changes in G-V relationship and gating kinetics during action potential–type stimuli, without the requirement for imperfect pharmacological inhibitors or mathematical modeling of action potential currents.
By slowing the BK channel’s activation rate beyond the time scale of action potentials (i.e., >5 msec), our study shows that β4 effectively limits BK channel recruitment at low and moderate Ca2+ (∼3.4–18 µM). In DG neurons from β4 knockout mice, increased BK channel activation sharpens the repolarization phase of the action potentials. The resulting briefer action potential may reduce both activation of voltage-dependent Ca2+ channels during the action potential (Lo et al., 2001), as well as recruitment of Ca2+-activated SK-type channels that act to limit firing frequency; these effects likely contribute to high frequency neuronal firing and epilepsy (Brenner et al., 2005). Opposing b4 effects, D369G facilitates BK channel opening by lowering K1/2 to 6.3 and 15.0 µM for α and α/β4 channels, respectively. The D369G enhancement of Ca2+ affinity appears to reduce the slow-gating β4 brake on BK channel activation in a similar manner as high calcium’s effect on αWT/β4 channels. Increased DG firing in D434G humans may contribute to epilepsy, similar to the mouse β4 knockout (Brenner et al., 2005). However, increased BK channel activity associated with increased neuronal excitability may not be limited to hippocampal DG neurons. A previous study has shown that a maladaptive gain-of-function of BK channels underlies elevated firing of neocortical pyramidal neurons in a picrotoxin-induced spontaneous seizure mouse model (Shruti et al., 2008). It will certainly be interesting to establish a causal relationship between BK channel gain-of-function and epilepsy by generating a tissue-specific knockin mouse model of the D369G mutation.
Acknowledgments
We acknowledge the kind gift from Dr. Jianmin Cui at Washington University for the human α subunit wild-type and D434G mutant cDNAs.
This work was supported by National Institutes of Health grants F32HL082197 (to B. Wang), GM068523 (to B.S. Rothberg), and NS052574 (to R. Brenner).
Edward N. Pugh Jr. served as editor.
Footnotes
Abbreviations used in this paper: BK, large-conductance Ca2+- and voltage-activated K+; DG, dentate gyrus; HA, Horrigan-Aldrich.
References
- Bao L., Rapin A.M., Holmstrand E.C., Cox D.H. 2002. Elimination of the BKCa channel’s high-affinity Ca2+ sensitivity.J. Gen. Physiol. 120:173–189 [DOI] [PMC free article] [PubMed] [Google Scholar]
- Berkefeld H., Fakler B. 2008. Repolarizing responses of BKCa-Cav complexes are distinctly shaped by their Cav subunits.J. Neurosci. 28:8238–8245 [DOI] [PMC free article] [PubMed] [Google Scholar]
- Berkefeld H., Sailer C.A., Bildl W., Rohde V., Thumfart J.O., Eble S., Klugbauer N., Reisinger E., Bischofberger J., Oliver D., et al. 2006. BKCa-Cav channel complexes mediate rapid and localized Ca2+-activated K+ signaling.Science. 314:615–620 [DOI] [PubMed] [Google Scholar]
- Brenner R., Chen Q.H., Vilaythong A., Toney G.M., Noebels J.L., Aldrich R.W. 2005. BK channel beta4 subunit reduces dentate gyrus excitability and protects against temporal lobe seizures.Nat. Neurosci. 8:1752–1759 [DOI] [PubMed] [Google Scholar]
- Cox D.H., Cui J., Aldrich R.W. 1997. Separation of gating properties from permeation and block in mslo large conductance Ca-activated K+ channels.J. Gen. Physiol. 109:633–646 [DOI] [PMC free article] [PubMed] [Google Scholar]
- Cui J., Cox D.H., Aldrich R.W. 1997. Intrinsic voltage dependence and Ca2+ regulation of mslo large conductance Ca-activated K+ channels.J. Gen. Physiol. 109:647–673 [DOI] [PMC free article] [PubMed] [Google Scholar]
- Davies P.J., Ireland D.R., McLachlan E.M. 1996. Sources of Ca2+ for different Ca(2+)-activated K+ conductances in neurones of the rat superior cervical ganglion.J. Physiol. 495:353–366 [DOI] [PMC free article] [PubMed] [Google Scholar]
- Diez-Sampedro A., Silverman W.R., Bautista J.F., Richerson G.B. 2006. Mechanism of increased open probability by a mutation of the BK channel.J. Neurophysiol. 96:1507–1516 [DOI] [PubMed] [Google Scholar]
- Du W., Bautista J.F., Yang H., Diez-Sampedro A., You S.A., Wang L., Kotagal P., Luders H.O., Shi J., Cui J., et al. 2005. Calcium-sensitive potassium channelopathy in human epilepsy and paroxysmal movement disorder.Nat. Genet. 37:733–738 [DOI] [PubMed] [Google Scholar]
- Faber E.S., Sah P. 2003. Calcium-activated potassium channels: multiple contributions to neuronal function.Neuroscientist. 9:181–194 [DOI] [PubMed] [Google Scholar]
- Fakler B., Adelman J.P. 2008. Control of K(Ca) channels by calcium nano/microdomains.Neuron. 59:873–881 [DOI] [PubMed] [Google Scholar]
- Gu N., Vervaeke K., Storm J.F. 2007. BK potassium channels facilitate high-frequency firing and cause early spike frequency adaptation in rat CA1 hippocampal pyramidal cells.J. Physiol. 580:859–882 [DOI] [PMC free article] [PubMed] [Google Scholar]
- Horrigan F.T., Aldrich R.W. 2002. Coupling between voltage sensor activation, Ca2+ binding and channel opening in large conductance (BK) potassium channels.J. Gen. Physiol. 120:267–305 [DOI] [PMC free article] [PubMed] [Google Scholar]
- Horrigan F.T., Ma Z. 2008. Mg2+ enhances voltage sensor/gate coupling in BK channels.J. Gen. Physiol. 131:13–32 [DOI] [PMC free article] [PubMed] [Google Scholar]
- Horrigan F.T., Cui J., Aldrich R.W. 1999. Allosteric voltage gating of potassium channels I: mSlo ionic currents in the absence of Ca2+.J. Gen. Physiol. 114:277–304 [DOI] [PMC free article] [PubMed] [Google Scholar]
- Isaacson J.S., Murphy G.J. 2001. Glutamate-mediated extrasynaptic inhibition: direct coupling of NMDA receptors to Ca(2+)-activated K+ channels.Neuron. 31:1027–1034 [DOI] [PubMed] [Google Scholar]
- Jiang Y., Pico A., Cadene M., Chait B.T., MacKinnon R. 2001. Structure of the RCK domain from the E. coli K+ channel and demonstration of its presence in the human BK channel.Neuron. 29:593–601 [DOI] [PubMed] [Google Scholar]
- Lo Y.K., Wu S.N., Lee C.T., Li H.F., Chiang H.T. 2001. Characterization of action potential waveform-evoked L-type calcium currents in pituitary GH3 cells.Pflugers Arch. 442:547–557 [DOI] [PubMed] [Google Scholar]
- Marrion N.V., Tavalin S.J. 1998. Selective activation of Ca2+-activated K+ channels by co-localized Ca2+ channels in hippocampal neurons.Nature. 395:900–905 [DOI] [PubMed] [Google Scholar]
- Morrow J.P., Zakharov S.I., Liu G., Yang L., Sok A.J., Marx S.O. 2006. Defining the BK channel domains required for beta1-subunit modulation.Proc. Natl. Acad. Sci. USA. 103:5096–5101 [DOI] [PMC free article] [PubMed] [Google Scholar]
- Muller A., Kukley M., Uebachs M., Beck H., Dietrich D. 2007. Nanodomains of single Ca2+ channels contribute to action potential repolarization in cortical neurons.J. Neurosci. 27:483–495 [DOI] [PMC free article] [PubMed] [Google Scholar]
- Parsons R.L., Barstow K.L., Scornik F.S. 2002. Spontaneous miniature hyperpolarizations affect threshold for action potential generation in mudpuppy cardiac neurons.J. Neurophysiol. 88:1119–1127 [DOI] [PubMed] [Google Scholar]
- Prakriya M., Lingle C.J. 2000. Activation of BK channels in rat chromaffin cells requires summation of Ca(2+) influx from multiple Ca(2+) channels.J. Neurophysiol. 84:1123–1135 [DOI] [PubMed] [Google Scholar]
- Qian X., Nimigean C.M., Niu X., Moss B.L., Magleby K.L. 2002. Slo1 tail domains, but not the Ca2+ bowl, are required for the β1 subunit to increase the apparent Ca2+ sensitivity of BK channels.J. Gen. Physiol. 120:829–843 [DOI] [PMC free article] [PubMed] [Google Scholar]
- Shruti S., Clem R.L., Barth A.L. 2008. A seizure-induced gain-of-function in BK channels is associated with elevated firing activity in neocortical pyramidal neurons.Neurobiol. Dis. 30:323–330 [DOI] [PMC free article] [PubMed] [Google Scholar]
- Wallner M., Meera P., Toro L. 1996. Determinant for β-subunit regulation in high-conductance voltage-activated and Ca21-sensitive K1 channels: an additional transmembrane region at the N terminus.Proc. Natl. Acad. Sci. USA. 93:14922–14927 [DOI] [PMC free article] [PubMed] [Google Scholar]
- Wang B., Brenner R. 2006. An S6 mutation in BK channels reveals β1 subunit effects on intrinsic and voltage-dependent gating.J. Gen. Physiol. 128:731–744 [DOI] [PMC free article] [PubMed] [Google Scholar]
- Wang B., Rothberg B.S., Brenner R. 2006. Mechanism of β4 subunit modulation of BK channels.J. Gen. Physiol. 127:449–465 [DOI] [PMC free article] [PubMed] [Google Scholar]
- Yang H., Hu L., Shi J., Delaloye K., Horrigan F.T., Cui J. 2007. Mg2+ mediates interaction between the voltage sensor and cytosolic domain to activate BK channels.Proc. Natl. Acad. Sci. USA. 104:18270–18275 [DOI] [PMC free article] [PubMed] [Google Scholar]
- Zeng X.H., Xia X.M., Lingle C.J. 2005. Divalent cation sensitivity of BK channel activation supports the existence of three distinct binding sites.J. Gen. Physiol. 125:273–286 [DOI] [PMC free article] [PubMed] [Google Scholar]


