

Abstract
We used tomographic reconstructions of frozen-hydrated triad junctions to determine the structure of the macromolecular complex associated with calcium release from the sarcoplasmic reticulum (SR), during excitation-contraction coupling. Using a rapid motif search algorithm with a reference motif of the ryanodine receptor (RyR) provided by single-particle cryo-electron microscopy, forty-nine receptors were located in five tomograms. Following co-alignment of the receptors and division into quadrants centered on the 4-fold symmetry axis, the receptors were classified using multivariate statistics. Global and class averages reveal that the SR membrane in the vicinity of the receptor is highly curved, creating an open vestibule with a gap of 4 nm between the receptor pore and the calsequestrin layer in the SR lumen. The in-plane densities in the calsequestrin layer have paracrystalline order, consistent with the packing of calsequestrin dimers in the three-dimensional crystal structure. Faint densities (“tethers”) extend to the calsequestrin layer from densities in the SR membrane located 15 nm from the symmetry axis of the RyR. In a class average of RyRs with proximal transverse tubules (TT), a cytoplasmic density is observed near the receptor that could represent the most consistent location of tethers observed in tomograms between the SR and TT membranes.
Introduction
Cryo-electron tomography is an emerging technology that is capable of answering questions about cellular structure at nanometer resolutions unattainable by other means (Sali et al., 2003; Bonetta, 2005; Frank et al., 2002). If the cell or tissue is frozen properly and the images recorded optimally, the tomogram represents an accurate 3-D snapshot of all the subcellular components in a nearly native state, with the resolution limited only by the total electron dose that the specimen accumulates. However, the unavoidable tradeoff with radiation-induced specimen damage inevitably results in low signal-to-noise ratio (SNR) and loss of resolution. Likewise, practical limitations to the tilting of specimens in the electron microscope result in further, directionally dependent degradation in tomogram quality.
The limitations to interpretability of tomograms can be overcome to some extent by employing strategies that take advantage of prior knowledge about cellular components. Thus, while each representation of a particular cytoskeletal element or enzyme complex is imperfect, it might retain enough information for reliable correlation with an appropriate reference template or motif (“template matching”). The resulting information about particle location and orientation can be used to generate a “macromolecular atlas” of cells (Boehm et al., 2000; Frangakis et al., 2002; Ortiz et al., 2006), and to guide averaging of large multimeric structures, such as nuclear pores (Beck et al., 2004) and dynein motors (Nicastro et al, 2005).
In the current study, we apply the strategy of template matching to tomographic reconstructions of triad junctions in membrane fractions isolated from skeletal muscle and preserved in frozen-hydrated state by plunge-freezing, previously characterized by Wagenknecht et al. (2002). The objective is to locate and characterize subvolumes within triad junctions that correspond to the functionally defined couplon, i.e. the organized multi-protein complex responsible for release of calcium ions from the sarcoplasmic reticulum (SR) following electrical stimulation at the apposed transverse tubule (TT) membrane (Franzini-Armstrong et al., 1999). The template to be matched is the RyR, the central protein component of the calcium release complex. The RyR in mammalian skeletal muscle is a transmembrane homotetramer of a 565 kDa polypeptide with a large cytoplasmic region or assembly, sometimes referred to as the “foot”, extending about 10 nm above the surface of the sarcoplasmic reticulum (reviewed by Zalk et al., 2007). The cytoplasmic assembly is square-shaped when viewed along its symmetry axis, roughly 28 nm on a side, with the central transmembrane domain containing the calcium pore that extending into and through the SR membrane at the 4-fold symmetry axis. The high-resolution structure of the RyR has been determined by single-particle averaging of isolated, detergent-solubilized proteins (Radermacher et al., 1994; Samso et al., 2005; Serysheva et al., 2005).
Previously this laboratory published a template matching algorithm RAMOS, RApid MOtif Search (Rath, et al., 2003), a fast 3D search program implemented in SPIDER (Frank et al. 1996). RAMOS uses a locally normalized cross-correlation function (Lewis, 1995), calculated according to the method of Roseman (2003). Rath et al. (2003) used RAMOS to map known ribosomal proteins into a 7.8Å-resolution structure of an E. coli ribosome using as templates the electron density maps of the proteins derived from atomic coordinates. In the same paper, the authors tried but failed to locate RyR in tomograms of frozen-hydrated triad junctions using a motif derived from single-particle reconstruction. However, successful mapping of RyR was achieved using a RyR-containing subvolume from the tomogram itself as template. The failure of the ideal RyR to function as a template suggests that it needs to be modified to better match its representations in the tomograms (see below).
In the current study we have applied the RAMOS algorithm to the specific task of determining the substructure of isolated frozen-hydrated triad junctions in the vicinity of the ryanodine receptor. The template was a RyR density map obtained by single-particle cryo-electron microscopy, modified to account for the presence of the SR membrane and for the effects of phase contrast transfer and missing information (due to data collection geometry) in the tomograms. Refinements to alignment procedures were introduced to account for molecular crowding in regions of SR membranes where the receptors occur in closely packed arrays. Finally, since the neighborhood around each side of the square-shaped receptor might differ (e.g., in terms of the presence of neighboring receptors or other partner proteins), the subvolume around each RyR was divided into quadrants centered on the 4-fold axis of the receptor. These quadrant subvolumes were then subjected to principal component analysis and K-means classification. Three types of class averages were generated that included the central RyR and adjacent densities for (i) single receptors, (ii) receptors with close neighbors, and (iii) receptors with a TT membrane nearby. The result of this analysis is a preliminary map of the SR components of the couplon that provides new insights into the structure and organization of the SR membrane, the calsequestrin layer in the SR lumen, and partner proteins in the immediate vicinity of the RyR.
Methods
Tomographic reconstruction of triad junctions
Isolation and characterization of frozen hydrated triad junctions from rabbit skeletal muscle are described in Wagenknecht et al. (2002). Five independent tomograms were reconstructed from tilt-series images collected on a JEOL 4000FX operated at 200 KV and 10μm underfocus, corresponding to a first zero in the phase contrast transfer function at 5nm. Images were collected over a tilt range of -60° to +60° in 1° increments on a thermoelectrically cooled (-34.5°C) TK1024AF2 CCD array with 1024 × 1024 pixels with a 24-μm pixel size and a CH250 camera head unit Photometrics, Tucson, AZ) controlled by the TVIPS imaging system (Tietz Video and Image processing Systems GmbH, Gauting, Germany) as described in Rath et al. (1997). Micrographs were binned to 512 × 512 pixels with a final pixel size of 1 nm. The thickness of the ice layers containing the membrane suspensions was typically 250 nm, so the best resolution expected in the tomograms is in the range 6-7 nm (Crowther et al., 1970). Marker alignment (using colloidal gold particles in the membrane suspension as described in Wagenknecht et al., 2002) and tomographic reconstruction using a modified back-projection algorithm were done with the SPIDER image processing program (Penczek et al., 1995).
General computation and visualization
In addition to alignment and tomographic reconstruction steps, most subsequent computational procedures, including template matching by cross-correlation, Fourier shell correlations, correspondence analysis, and principal component analysis were done in SPIDER and visualized in ImageJ (http://www.nih.imagej.gov) and AMIRA (http://www.tgs.com). PYMOL (DeLano, W.L. The PyMOL Molecular Graphics System (2002) DeLano Scientific, Palo Alto, CA, USA. http://www.pymol.org) was used to visualize the crystal structures of rabbit calsequestrin d1a8y (Wang et al. 1998). K-means classification of coordinate files were done with the open source program R (http://www.r-project.org/).
Creation of phantom volumes from RyR template
Phantom volumes were created in SPIDER for studies aimed at optimizing conditions for detecting and aligning ryanodine receptors within tomograms. These phantoms consisted of a number of ryanodine receptors dispersed at different angular orientations in slab volumes typically of 1024 × 64 × 256 voxels, and reconstructed by weighted back-projection with random Gaussian noise added to the projections such that the SNR of the projections were between 1 and 10. The RyR structure used for the phantoms was the same as that used for the template in the subsequent motif search, a 3-nm-resolution density map for RyR1 obtained from single-particle cryo-electron microscopy (Wagenknecht et al., 1997).
RAMOS and modifications
The procedure used for rapid motif search in large volumes, RAMOS (Rath et al., 2003), is implemented using SPIDER. It employs the locally normalized cross-correlation function (CCF) (Lewis, 1995) as described by Roseman (2003) in a parallelized SPIDER routine. RAMOS performs the search by calculating the CCF of the motif with the larger volume for each orientation of the motif. Performance benchmarks for the algorithm were previously published in Rath et al. (2003). The procedure is parallelized via a subscribe-and-publish method that allows for the total number of CCFs to be distributed among any number of available processors (http://www.wadsworth.org/spider_doc/spider/pubsub/pubsub.html).
In the current study, motif searching was accomplished by performing the searches in three-stage approach. An initial coarse search, with 10° angular sampling and volumes low-pass filtered to 8 nm, generated a large list of cross-correlation peaks (>105). This list was ranked according to correlation value and the top quartile was purged of false positives and redundancies by K-means cluster analysis (described below). This culled list of correlation peaks (∼20) was used to window motif-size subvolumes from the larger tomograms and a final alignment was performed using a gradient-ascent method (described below) employing 1° angular sampling and volumes low-pass filtered to 5 nm. In cases where RyRs overlapped a fourth exclusion stage (described below) was used.
During the coarse search, the number of large CCFs calculated was reduced by using uniform angular sampling (described in next section). The number of computations was also reduced by using a spherically symmetric mask to calculate the local variance. Detection sensitivity of RyRs during the coarse search in experimental tomograms was found to be enhanced, and false positives dramatically reduced, by modifying the RyR template with the addition of a planar slab of uniform density approximating a lipid bilayer, thus better mimicking the in situ environment of the receptor in the SR membrane.
During the subsequent fine alignment step (described below) CCFs and local variances were calculated using a RyR-shaped mask and, thus, did not include the added bilayer density. In addition, it was found that accuracy of the refined alignment was significantly improved by modulating the motif with a Fourier filter that accounted for both the phase contrast transfer function of the microscope and the missing Fourier information in the tomogram caused by incomplete angular sampling (Boehm et al., 2000, Frangakis et al., 2002).
Uniform sampling of the unit sphere
Complete angular sampling in template-matching protocols requires 2π rotation about ψ, π rotation about θ, and 2π rotation about φ, where ψ, θ, φ are the three mutually orthogonal Euler angles. These angles correspond to, respectively, the rotation about the four-fold axis, the angle between the four-fold axis and electron beam, and the in-plane rotation about the electron-beam axis with the tilt axis defined by φ = 90°. If these ranges are naively sampled in equal increments, the orientation space is over-sampled at the poles where θ = 0 or π. The source of this over-sampling comes from the surface being described by rotating a unit vector about θ and φ. Complete rotation of a unit vector about θ and φ describes a unit sphere. Each area element, ΔA, on this sphere is equal to sinθ•Δθ•Δφ. In order that ΔA remain constant, Δφ must vary as . Setting Δφ = Δθ/sinθ for 0>θ< π and Δφ = 2 π for θ=(0,π) results in uniform sampling of the unit sphere and a 2/π reduction in the number of cross-correlation computations needed. In the case of the RyR, further reduction in orientation sampling was achieved by aligning the four-fold symmetry axis of the ryanodine receptor with the electron beam axis, allowing ψ to be fully sampled by a π/2 as opposed to a 2π rotation.
K-means analysis of the output from coarse angular sampling search
The output of the RAMOS program is a list of coordinates (x,y,z) containing maxima in the locally normalized CCF for each motif orientation (ψ, θ, φ) used. As such, the list contained thousands of redundancies after the coarse angular sampling search. In addition to redundancies due to actual RyR particles found for different motif orientations, the list also contains numerous false positives arising from matching of the motif with random densities in the noisy tomograms. In the case of the RyR, false positives can be easily identified visually because of the distinctive shape of the receptor. Also, actual receptors tended to generate maxima for numerous orientations of the motif, while false positives occurred over only a few orientations at any one location. However, the initial ranked list of ∼10,000 correlation coefficients was far too large for manual classification.
Initially this large list of coordinates was culled of redundancies by near-neighbor exclusion of coordinates within a radius of D/2 pixels from the coordinates with the highest CCF. However, the results were found to be overly dependent on the choice of D, giving very different results when D was changed by a few pixels. An alternative procedure was developed involving K-means cluster analysis of those coordinates that had the top 25% of correlation values (i.e. typically in the range 0.4-0.6). We found by working with phantoms and tomograms that, by starting with an overestimation of the cluster number (K) and underestimation of D, we could iteratively reduce K until the average distance between cluster centers reached a realistic value of D (25-30 nm). The final output of this procedure is a list of coordinates corresponding to these cluster centers, to which are assigned the orientation parameters and CCF values of the nearest maxima in the coarse angular sampling search.
Fine alignment by gradient ascent
Coarse angular sampling of the large volume and subsequent culling of the output peak list as described above provided an initial list of locations and orientations of probable RyRs with corresponding cross-correlation coefficients. The location and orientation of each receptor was further refined by a gradient ascent cross-correlation procedure using template-sized subvolumes windowed from the larger tomogram. The initial subvolume was centered at the coordinates of the cluster average from the coarse sampling and the template was rotated to the orientation given by nearest maxima of the coarse rotation search. The gradient of the CCF as a function of rotation was then determined for a 1° step size. The template was then rotated in the direction of the maximum gradient and a new subvolume was windowed about the maximum in the CCF at the new orientation. This process was continued until the maximum was found for location and orientation. Subvolumes for which a maximum was not found within a 15° rotation of θ and φ were excluded from the final list and regarded as false positives.
Particle alignment in crowded arrays: Exclusion mapping
In order to map RyRs lying in closely packed groups, which sometimes occurred in the triad junctions, particle alignments were refined using a weighting function designed to avoid steric overlap with neighboring particles. Particles in a crowded field were ranked according to their CCF value. In this rank order a binary version of the unmodified single-particle RyR (inside = 1, outside = 0) was positioned in a secondary volume at the corresponding coordinates of each RyR. As each binary template was added to the secondary volume, the voxel overlap between the new and existing templates was calculated. The new particle was then realigned in the tomographic volume using a weighting function that penalized the CCF by 2% for every voxel of overlap between its template and those of its higher ranked neighbors in the secondary volume. (This weighting function was determined empirically to work well with close-packed RyR in phantoms and in tomograms containing adjacent RyRs which could be easily distinguished.) Using these weighted CCFs, the fine alignment by gradient ascent, as described above, was repeated until a maximum was found.
Multivariate statistical analysis of RyR micro-environments
Subvolumes (64 nm × 64 nm ×64 nm) centered on each RyR (N=49) were aligned to the RyR and divided into quadrants (32 nm × 32 nm × 64 nm). These quadrants (N=196) were rotated about ψ to a common alignment (i.e., by 0°, 90°, 180°, or 270°). Principal component analysis (PCA) and correspondence analysis (CA) were preformed within a subvolume (32 nm × 32 nm × 15 nm) of the quadrants. This subvolume included the RyR density, SR membrane, and adjacent cytoplasmic space, but not the region corresponding to the T-tubule membrane or the SR lumen (Supplemental Figure 1a,b). K-means classification was used to define classes of quadrants. The number of classes was chosen empirically to keep the minimum number of quadrants in each class near 50. The number of eigenvectors used was kept small (2-7) as described in Results.
Results
Characterization of tomograms of frozen-hydrated isolated triad junctions
Five independent tomograms were computed from skeletal muscle membrane fractions containing triad junctions that were suspended in amorphous ice by plunge-freezing at liquid-nitrogen temperature (Wagenknecht et al., 2002). Within these tomographic volumes (typically 500 × 500 × 200 nm3) were numerous well-preserved triad junctions, consisting of a flattened vesicle of transverse tubule (TT) bounded on opposite sides by roughly spherical vesicles of sarcoplasmic reticulum (SR). Despite the low signal-to-noise ratio (SNR) in these tomograms, RyRs in side views (i.e., approximately normal to the 4-fold symmetry axis) were easy to identify in slices through triad junctions or isolated SR terminal cisternae as strong linear densities, approximately 30-nm long and 5-nm wide, positioned about 2-nm above the cytoplasmic surface of the SR (Figure 1). A central stalk-like density could sometimes, but not always, be observed connecting the RyR cytoplasmic domain to the SR surface. Layers of strong density were commonly observed in the SR lumens, running parallel to, and a few nanometers below, regions of the membrane containing receptors. These layers of SR luminal density are considered to represent calsequestrin (Saito et al., 1988; Franzini-Armstrong 1987; Wagenknecht et al., 2002). While the geometry of the intact triad junctions in these fractions is generally consistent with the in situ structure, the distance between SR and TT membranes showed considerable variation (20-nm at closest approach) and a minority of receptors occurred in close proximity to a TT membrane surface. Direct contacts between RyR cytoplasmic domains and proximal TT membranes were not clearly resolved in the tomograms. Instead, faint linear densities, varying from 20 to 40 or more nanometers in length, could be seen bridging the gap between the SR and TT membranes in triad junctions (Figure 1). These SR-TT “tethers” were more visible at the edges of RyR clusters, and many had a beads-on-a-string appearance (Figure 1c,d).
Figure 1.
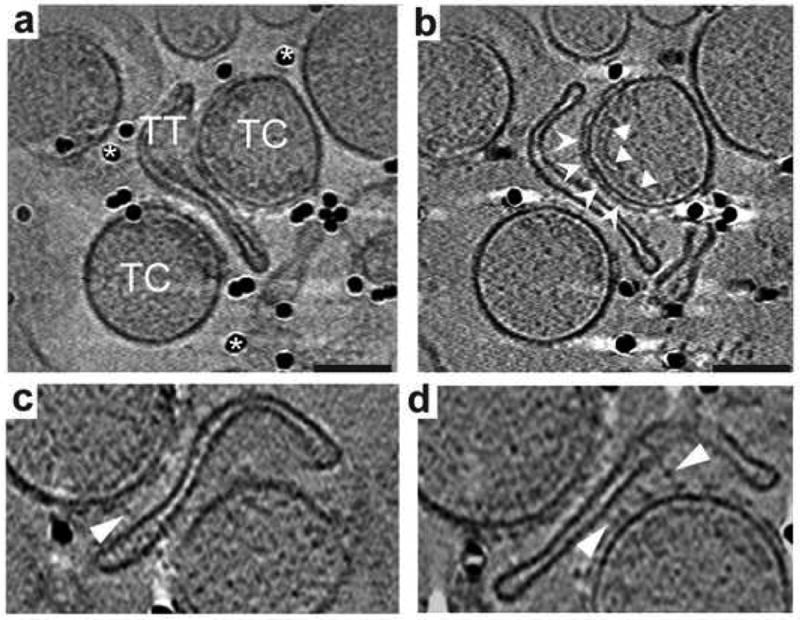
Tomographic reconstructions of frozen hydrated isolated triad junctions. (a) Projection of isolated triad junctions consisting of T-tubules (TT) and terminal cisterna (TC) of the SR with deposited colloidal gold (*) for alignment. (b) Central slab (5 nm thick) of the reconstruction of the triad junction in (a), showing ryanodine receptors on the cytoplasmic surface of the SR membrane (chevrons) and the luminal calsequestrin layers (arrowheads). (c and d) Tether structures visible in 3-nm thick slabs from the same tomogram with beads-on-a-string appearance (arrowheads). Scale bars in (a) and (b) equal 100 nm. Images in (c) and (d) are magnified 1.25X relative to (b).
Template matching of ryanodine receptors in the tomograms
Ryanodine receptors were precisely located in the tomographic volumes by a two-phase search and alignment procedure based on the RAMOS program of Rath et al. (2003). The template or motif was derived from a 3-nm resolution structure of isolated RyR1 provided by single-particle cryo-electron microscopy (Wagenknecht et al., 1997). As described in Methods, this reference structure was modified in several ways to maximize sensitivity and minimize false-positive hits in the noisy tomograms. For the initial coarse search, a slab of constant density was added to the RyR motif to mimic the shape and location of the SR membrane, and this RyR-SR motif was low-pass filtered to 8 nm. For the refined alignment, the mask used for CCF and local variance calculations was constrained to the outline of the RyR. The RyR motif was modified by a Fourier filter that approximated both the contrast transfer function of the microscope and the directional loss of information caused by the missing angular data in the +/- 60° tilt series i.e., the “missing wedge” (see Methods). This corrected motif was subsequently low-pass filtered to 5-nm resolution (Figure 2). For RyRs that were separated from neighboring receptors by at least 35 nm (center-to-center), fine alignment was performed on subvolumes windowed from the tomogram at the maximum value of the CCF, using gradient ascent as described in Methods. However, a different fine alignment strategy was developed for RyRs that clustered into arrays. In arrays, the square cytoplasmic domains, 28-nm on a side, are separated by only 30 nm (center-to-center). This molecular crowding, coupled with the low SNR of the tomograms and contributions from the missing wedge, created strong false maxima in the CCFs for rotations about the axis normal to the membrane plane. Fine alignment of the receptors in these crowded environments was achieved by weighting the CCFs for steric overlap as described in Methods. Simulations with phantom data were done to test the modifications to the motif; ctf correction, missing wedge, and low pass filter radius (data not shown). Refinement steps after the coarse search were developed empirically, based upon the ability of these methods to detect and align a small number of easily identifiable RyRs arranged in a close packed array. Refinements were measured by their ability improve the Fourier shell correlation between half-set averages.
Figure 2.
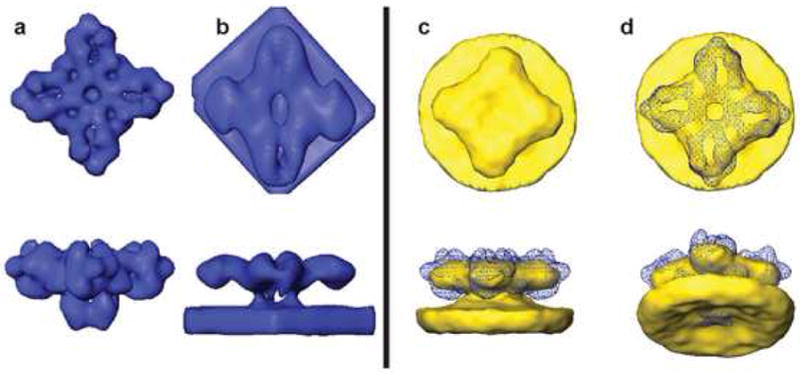
Motif and local average of RyR in the SR membrane. (a) Single-particle structure of RyR used as motif (resolution of 3 nm). (b) Template used for correlation search, modified for phase contrast transfer, geometry of tomographic data collection (missing wedge) and low-pass filtered to 5 nm as described in text. (c and d) Local average of 14 close-packed RyRs within a single tomogram. Blue mesh in (c,d) is a superimposed isodensity surface of the template of (a). In (a, b) surfaces are chosen at a density one standard deviation above the mean. In (c, d) the surface threshold approximates the RyR volume.
Local and global averages of the RyR in the SR membrane
A preliminary RyR average was formed from seven RyRs that were located in a closely packed cluster on a terminal cisternae of SR in one of the tomograms (Figure 2). The cytoplasmic domain of this 4-fold symmetrized local average had a resolution of 7.1 nm based on Fourier shell correlation of half-sets. The local receptor average is unremarkable, with an overall shape consistent with the reference motif at this low resolution and no detail present in the cytoplasmic domain other than an expected central indentation. However, the membrane density displayed a novel and unexpected feature, namely a strong local curvature within a 15 nm radius of the central RyR transmembrane domain, giving rise to a dome or vestibule at the SR lumen entrance of the Ca2+ channel (Figure 2c,d).
Approximately 100 additional RyRs were found by coarse correlation search and visual confirmation in the five tomograms, of which 42 successfully aligned to the template in the refinement step. Of the total of 49 receptors, 22 were found within triad junctions (i.e. there was an adjacent TT membrane) and 27 were found in terminal SR cisternae with no TT membrane (including the 7 receptors from the array used to form the local average in Figure 2). A cross-section through the global average formed from these 49 particles is shown in Figure 3. The resolution of the global average based on Fourier shell correlation between half-sets is lower than that for the local average (8.9 nm vs 7.1 nm), possibly reflecting increased variation among the particles and their orientations relative to the electron beam in the larger data set. It is worth noting that that the membrane curvature below the RyR persists in the global average (Figure 3a). The local radius of curvature below the RyR in the global average is 45 nm, much less than average overall curvature of the SR vesicles on which the receptors were located (> 75 nm.) In addition, the global average contains a distinct layer of density below the SR at the location expected for calsequestrin (Fig. 3 a,d).
Figure 3.
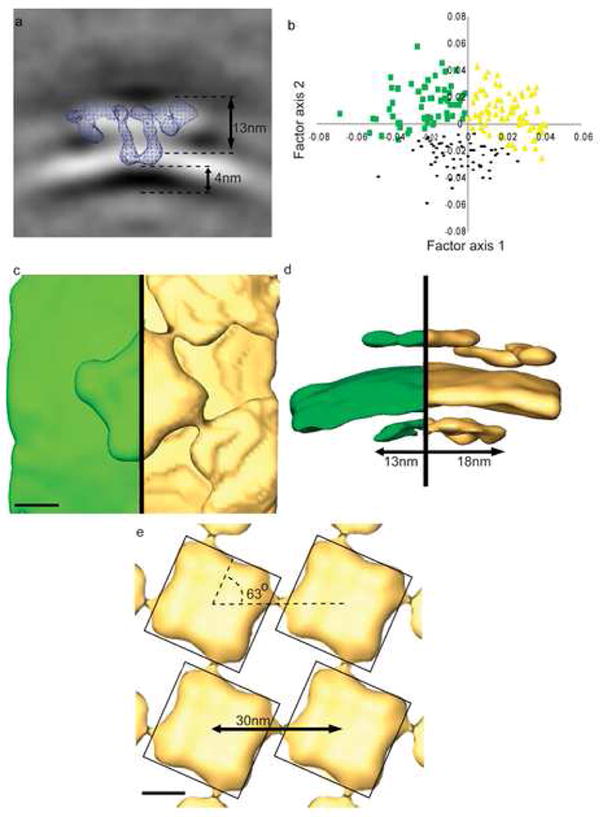
Global average, correspondence analysis, and class averages. (a) Central slice (3 nm thick) through the global average of 49 particles with enforced four-fold symmetry. Blue mesh is a central slice (3 nm thick) of the motif RyR at an isosurface one standard deviation above mean density. (b) Correspondence analysis factor map of RyR pseudo-monomers along eigenvectors 1 and 2. Yellow triangles represent the class of subvolumes in which the RyR has a “Neighbor” (Class N). Green squares represent the class of subvolumes with “Single” RyRs (Class S). Black dots represent the class of subvolumes with generally weak density away from the RyR (not only no neighbor but also no distal SR membrane). (c) Top view of a surface-rendered models of the Class S (Green) and Class N (Yellow) averages of the pseudo-monomers, rotated about the symmetry axis and stitched together to create a recognizable central RyR. (d) Side view of the model in (c). Note that this view is tilted slightly forward to better see the calsequestrin layer and prevent overlap between the central and neighbor RyRs. Models are rendered in (c) at the isosurface necessary to fill the volume of the RyR and in (d) at the isodensity that creates a membrane 6 nm thick. (e) Four-by-four array created by translation of the Class N average in the direction that yields the best match between the corners of the central and neighboring receptors. Models are surfaced rendered as in (c). Scale bars in (c) and (e) equal 10 nm.
Multivariate statistical analysis of RyR microenvironments
The local and global averages of Figures 2 and 3a were four-fold averaged around the central symmetry axis of the RyR, since RyR is known to be a four-fold symmetric homotetramer of a large (565kDa) polypeptide. However, in the native membrane, different sides of the various receptors face different microenvironments. For example, a particle on the edge of an array would have one or more sides adjacent to a neighboring receptor, and one or more sides with no neighbor. Likewise, the SR-TT tethers observed in the tomographic slices seemed to be more common at the borders of RyR arrays. In order to avoid “averaging out” structural details around individual receptors, the volume enclosing the 49 aligned receptors (64 × 64 × 64 nm3), were divided along the 4-fold axis into equivalent quadrants (each containing a “pseudo-monomer”). Classification was performed on the resulting 196 subvolumes, each 32 × 32 × 64 nm3. Correspondence analysis (CA) and principal component analysis (PCA) was performed on a region within the subvolumes, 32 × 32 × 15 nm3, that encompassed the SR membrane and the cytoplasmic space above the membrane. The first 7 eigenvectors of the CA accounted for 26% of the inter-volume variance while the first 5 eigenvectors of the PCA accounted for 25%. The strongest features in eigenvector 1 of CA (6% of inter-volume variance) corresponded to the presence of a strong neighbor density immediately adjacent to the RyR above the SR membrane. This feature corresponded to eigenvector 2 of the PCA, and accounted for 4% of inter-volume variance. Eigenvector 1 of PCA (14% of inter-volume variance) corresponded to relative intensity of densities in quadrant subvolumes distal to the RyR (i.e., extended SR membrane, SR lumen, cytoplasm), while eigenvector 2 (5% of inter-volume variance) of CA corresponded to variations primarily in distal SR density. The Factor 1 vs 2 map for CA is shown in Figure 3b. Higher eigenvectors in CA and PCA corresponded to more complicated combinations of densities in the cytoplasm and SR membrane. K-means analysis was used to classify quadrant subvolumes using eigenvectors from both CA and PCA, in all cases including eigenvectors 1 and 2, and using eigenvectors up to 7 in some analyses. When keeping the number of classes small (K=3), it was found that roughly two-thirds of the quadrant subvolumes were stably classified into one of the three classes, while the other third alternated between classes depending on whether CA or PCA was used. The classification was dominated by eigenvectors 1 and 2 for both CA and PCA; inclusion of smaller eigenvectors altered classification of less than 5% of the quadrant subvolumes.
It is noteworthy that there were no obvious features in the eigenvectors corresponding to elongation effects of the missing wedge, nor was there an obvious correlation between quadrant orientation and class (Supplemental Figure 1d). This may be explained by the fact that the RyR occupyied less than 5% of the voxels in the subvolumes analyzed. Thus, variations due to non-RyR density were more significant than variations due to distortion of the RyR density caused by incomplete angular sampling. In addition, stretching of the RyR due to the missing-wedge effect does not extend into the regions considered as non-RyR density in the following discussion (Supplemental Figure 1a,b).
Class averages of RyR in the SR with and without neighbors
Class averages were generated by simple summation of the quadrant subvolumes in each of the three classes determined by K-means analysis of results from PCA and CA. Only common features in equivalent class averages generated from PCA and CA are discussed below.
One consistently observed class corresponded to quadrant subvolumes with weak peripheral densities, represented by black dots in the factor map of Figure 3b. This class average (not shown) has a strong central RyR and dome-shaped SR membrane like that of the global average (Figure 3a), but no significant densities (in the membrane, lumen or cytoplasm) beyond a radius of ∼20 nm from the center of the RyR.
Top and side views of models corresponding to averages of the other two classes of subvolumes are shown in Figures 3c,d. In these and subsequent models, two or more equivalent quadrants are “stitched” together following in-plane rotation about the symmetry axis to create recognizable square-shaped receptors. The two class averages are labeled Class S (for single receptor) and Class N (for receptor with neighbor).
The presence of a neighboring RyR coincides with a flatter shape of the SR membrane. The local curvature of the SR membrane (extending radially by a distance of ∼15 nm from the RyR symmetry axis) changes from a radius of curvature of 45 nm to 67 nm when a neighbor is present. The long-range curvature in the membrane measures 75 and 110 nm for the Class S and Class N averages, respectively. For the Class S average this curvature has no directional dependency, whereas for the Class N average the radius of curvature changes to that of the Class S average in directions away from the neighbor (data not shown).
The shape and location of the central RyR and its neighbor densities correspond closely to the array geometry observed in 2D arrays formed by RyR in situ (Paolini et al., 2004) and in vitro (Yin and Lai, 2000), i.e. receptors are spaced 30 nm apart (center-to-center), with the sides of the square cytoplasmic domains forming a 63° angle with the line connecting the two centers (Figure 3e).
Calsequestrin layer in the SR lumen
In the global average (Figure 3a) and class averages (Figure 3c,d) there is a strong lateral layer of density in the SR lumen at the location expected for calsequestrin, at a distance of 4 nm from the transmembrane domain of the RyR at the center of the dome or vestibule in the SR membrane. The layer of luminal density is more extensive when the RyR has neighbors, extending 18 nm from the central axis of the RyR in the Class N average and only 13 nm in the Class S average (Figure 3d). In the Class N average there are discrete densities in the luminal layer, spaced on average 6 nm apart and defining contact angles of approximately 120°. The positions of the densities in the layer approximate the arrangement of calsequestrin dimers in the crystal lattice reported by Wang et al. (1998) as indicated in Figure 4a. When RyRs are arranged according to the array geometry in Figure 3e, as shown in Figure 4b, the strongest luminal densities extend from one RyR to directly below the so called “clamp” regions at the corners of the cytoplasmic domains of a neighboring RyR.
Figure 4.
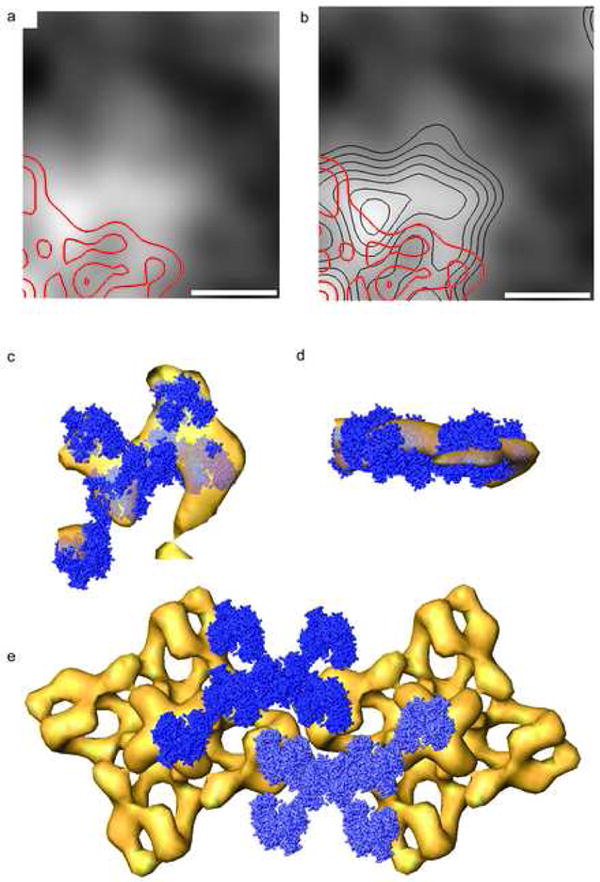
Paracrystalline substructure within the calsequestrin layer in the SR lumen. (a) Projected density map of the calsequestrin layer in the Class N average on with red contours superimposed that correspond to the cytoplasmic region of the single-particle RyR. (b) Same as (a) with black contours superimposed that correspond to maxima in the calsequestrin layer itself. (c,d) Atomic models of calsequestrin (blue) arranged according to the crystal structure of Wang et al. (1998) aligned to an isodensity surface of the calsequestrin layer (yellow), viewed normal (c) and parallel (d) to the calsequestrin plane. (e) Surface rendering of two adjacent RyRs (positioned as in Figure 3e) and their associated calsequestrin layers as defined in (c). The views in (a),(b),(c), and (e) are looking up from the SR lumen. Scale bars equal 10 nm.
Connections of calsequestrin to the SR membrane
The location of calsequestrin layers in the SR lumen in association with RyR clusters and the regular arrangement of calsequestrin densities relative to the receptor itself strongly suggests that the RyR plays a role in organizing calsequestrin. Yet, there are no obvious connections between the RyR and the lateral layer of calsequestrin in the global or class averages. Instead, as noted above, there is a 4 nm wide density-free void between the calsequestrin layer and the transmembrane domain of the receptor. This does not necessarily rule out the existence of direct contact between the RyR and calsequestrin, since such connections might be too faint or variable to be detected in these averages. However, it is worth noting in this regard that there are three significant, non-symmetry related densities in the SR membrane besides the transmembrane domain of the RyR. These densities – which could correspond to other integral membrane proteins known to localize to triad junctions (reviewed by Rossi and Dirksen, 2006) such as triadin (Brandt et al. 1990), junctin (Jones et al., 1995), junctate (Treves et al. 2000), junctophilin (Takeshima et al., 2000), JP45 (Zorzato et al. 2000), and possibly mitsugumin-29 (Takeshima et al., 1998; Weisleder et al., 2006) – occur adjacent to the receptor and at distances of 12 and 15 nm from the central four-fold axis (Figure 5a). Interestingly, in the Class N average the 15-nm distal density occurs in the SR membrane directly below the clamp region of the RyR, and directly above one of the strongest densities in the calsequestrin layer associated with a neighboring RyR. In the Class N average, a faint bridging density can be seen to extend between the SR density and calsequestrin density located beneath the RyR clamp (Figure 5b).
Figure 5.
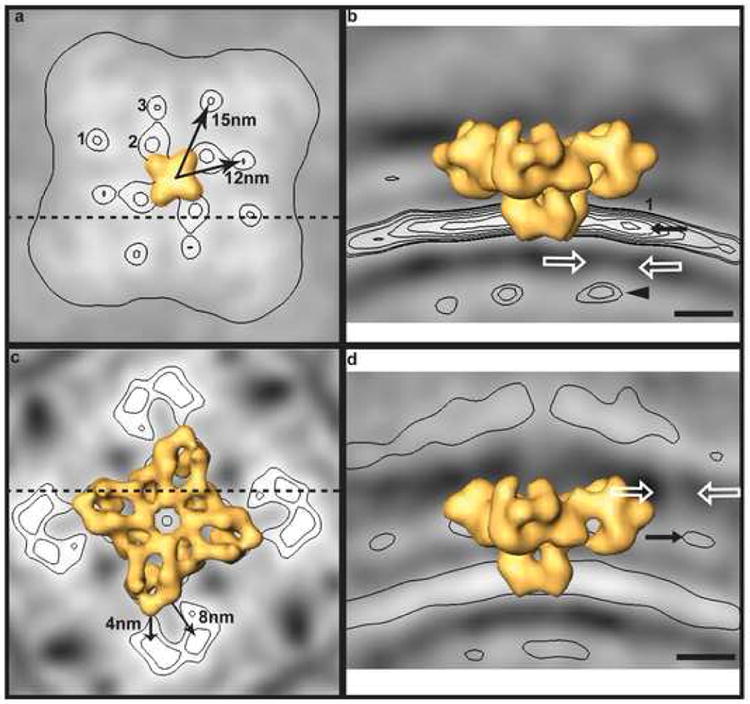
Secondary density maxima in RyR class averages and possible tethers from the SR membrane to calsequestrin and TT membrane. (a) Secondary maxima in the plane of the SR membrane in the Class N average. Membrane-spanning domain of the RyR template is rendered in yellow. (b) Transverse slice through the Class N average (at dashed line in (a)) showing faint density (white arrows) connecting an SR density (black arrow) to calsequestrin (black arrowhead). (c) Cytoplasmic densities in average of the subset of Class S with TT membranes nearby. (d) Transverse slice through the TT subaverage of Class S (at dashed line in (c)) showing faint density (white arrows) connecting the cytoplasmic density (black arrows) to the TT membrane. The planes shown in (a) and (c) correspond to orthogonal slices in the direction of the black arrows in (b) and (d). Scale bars equal 10 nm.
Connection between SR and TT membranes
As mentioned in the beginning of this section, numerous fiber or tether-like structures were observed between the SR and TT membranes in the frozen-hydrated isolated triad junctions (Figure 1). These thin, faint features displayed considerable variability in location and length, generally occurring (or more visible) at the edges of RyR clusters. A second principal component analysis was performed to identify the quadrant subvolumes containing TT membranes, employing a mask 32 × 32 × 8 nm3 that included the region where a TT membrane would be located in a triad junction. By K-means cluster analysis, a class of quadrant subvolumes with TT membranes containing 45 members was generated. Even in this average the density of the TT membrane was not well defined, presumably due to the aforementioned variability in distance from the RyR. Thus, we were unable to identify any density that might correspond to the dihydropyridine receptor. There was, however, a new cytoplasmic density in this average adjacent to the RyR. To eliminate the possibility that the new density might be due to neighboring RyRs, an average was computed of the subset of the 45 quadrant subvolumes with TT membranes and no neighboring RyR. Although there were only 13 such quadrants, the average contains a significant L-shaped density close to the clamp region of the RyR, with faint linear densities extending to the TT surface (Figure 5c,d). Thus, this cytoplasmic density could represent the cytoplasmic domains of proteins such as junctophilin or JP45 that have been reported to connect the SR and TT membranes (Rossi and Dirksen, 2006).
Discussion
The couplon, the calcium release complex within muscle triad junctions, is an excellent example of a large macromolecular assembly whose mechanism of operation is largely unknown. Clearly, the understanding of how this complex is assembled and functions during calcium release would be improved by structural information at the nanometer scale. This particular macromolecular assembly spans two membranes (sarcoplasmic reticulum and transverse tubule) and involves at least two different channel receptors (the ryanodine receptor/calcium release channel and the dihydropyridine receptor/L-type calcium channel), along with a calcium sequestering aggregate-forming protein (calsequestrin) and numerous ancillary proteins (Rossi and Dirksen, 2006) whose functions are regulatory and/or structural (triadin, junction, junctophilin, JP45) Exactly how the arrangement of the different components and the local topology of the membranes might affect the function of the assembly, which is the storage and rapid controlled release of calcium into the cytoplasm to trigger muscle contraction, is unknown at this time. What we provide in this study is the first blueprint, albeit incomplete, for the organization of the RyR, the SR membrane and calsequestrin in isolated triad junctions and the location of major protein densities in and above the SR membrane that may be involved in interactions among the various components.
There are two obvious shortcomings in the current report: absence of information about the molecular identity of novel densities detected, which could be provided in subsequent studies using immunologic and molecular genetic tools; and poor characterization of the interactions between the SR and TT membranes, due to large variations in the spacings between the membranes presumably caused by the membrane isolation procedures. The latter problem is best overcome by switching from membrane isolates to intact frozen-hydrated tissue sections prepared by high-pressure freezing and either cryo-ultramicrotomy (Hsieh et al., 2002, 2006) or cryo-milling with a focused ion beam (Marko et al., 2007).
Partial model for the couplon in skeletal muscle
Based on the results of this analysis of tomographically reconstructed triad junctions, a partial model can be provided for the couplon that has several unexpected and likely functionally relevant features (Figure 6). The presence of the RyR in the SR membrane causes a dramatic increase in local membrane curvature. The resulting vestibule below the RyR could represent a micro-domain of high free Ca2+ concentration between the entrance to the calcium pore and the layer of calcium sequestering protein, calsequestrin, that could be important for physiological calcium release. The pronounced local bending of the SR membrane might result from alignment of phospholipids along the transmembrane domain of the RyR, which is tilted at an angle of about 40° relative to membrane normal (Samso et al., 2005). The bending of a lipid bilayer membrane by an inserted protein with a tilted transmembrane domain has been predicted based on thermodynamics by Dan and Safran (1995). Conversely, the reduction in long-range curvature of the SR membrane observed when RyRs are in close contact suggests that lateral interactions between the cytoplasmic domains of the receptors might contribute to the flattening of the SR membrane observed in triad junctions in muscle. Of course, other physical interactions between the SR and the extended structures apposed to it, the paracrystalline calsequestrin layer and the transverse tubule membrane, might also play a role in flattening the junctional SR membrane. Along these lines, our tomographic analysis suggests that the calsequestrin layer is organized by physical interaction with proteins located in the SR membrane under the clamp region of the RyR, and, likewise, that proteins adjacent to the RyR (in regions on the edge of RyR arrays) bridge the SR and TT membranes. That the latter protein densities, like the SR membrane densities that connect to the calsequestrin, also occur near the clamp region of the RyR, suggests that a common bridging structure might span and interconnect the two membranes and calsequestrin layer in the triad junction. Interestingly, there is evidence that the protein JP45 serves such an extended tethering function (Anderson et al., 2003). However, without evidence from other types of experiments (antibody labeling, genetic manipulation), it is premature to assign a molecular identity to any of the SR densities that we report herein.
Figure 6.
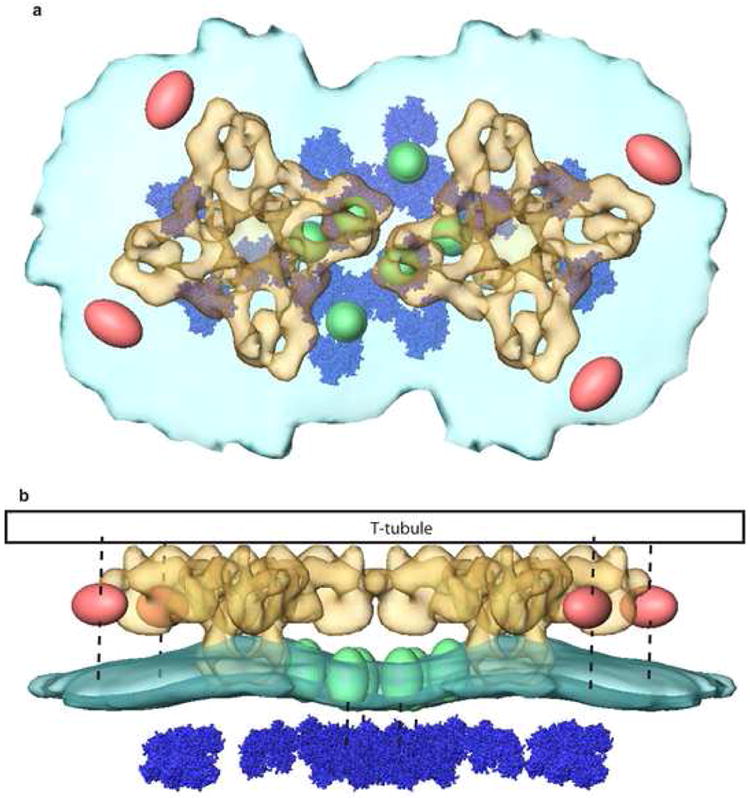
Partial model for the triad junction “couplon” based on cryo-electron tomography. Top: View from above the SR membrane (light blue) showing RyR (yellow), calsequestrin (dark blue), secondary SR membrane densities (green), and cytoplasmic TT-associated densities (pink). Bottom: Side view of the couplon model showing expected location of the TT membrane (black) and tethers (dashed lines) inferred from the class averages in Figure 5.
Bending of the SR membrane by the RyR
It is interesting to speculate on the possible functional significance of the local bending of the SR membrane associated with the RyR. Chou et al. (2001) have theorized that such a protein-induced deformation can provide an attractive force for membrane bound partner proteins, with a longer range than van der Waal's or shielded electrostatic forces. Thus, the inferred membrane bending property of the RyR could provide an essential driving force for the assembly of the entire couplon. Another interesting aspect of the RyR-membrane interaction relates to the transition from open to closed state of the pore, which is thought to involve movement of transmembrane helices in the RyR. If, as postulated above, the tilt of the transmembrane surface of the RyR induces local curvature in the lipid bilayer, changes in functional (open or closed) state of the pore that altered this tilt would affect membrane curvature. It might be, for example, that the observed difference between the local curvature of the SR beneath single pores and pores with adjacent neighbors is that the functional states of the pores are modulated by close proximity between RyRs. There is, in fact, evidence for cooperativity in channel opening that supports this possibility (Marx et al., 1998; Stern et al., 1999)
Ordering of calsequestrin in the SR lumen
Our observation that calsequestrin is anchored to the membrane by tethers connecting to densities in the SR membrane, and not directly to the RyR, is consistent with electron microscopy studies of muscle by Franzini-Armstrong et al. (1987) and previous observations on frozen-hydrated triad junctions from this laboratory (Wagenknecht et al., 2002). There are two possible orthogonal planes of the calsequestrin crystal structure of Wang et al. (1998) that would be consistent with the observed ordering of SR luminal densities below the RyRs. One possibility (shown in Figure 4) orients the multimeric linear strands formed by calsequestrin monomers parallel to the SR membrane. The second possibility orients the multimeric linear strands perpendicular to the SR membrane. While both orientations are consistent with the densities that we observe in the Class N average, orienting the multimeric linear strands parallel to the SR membranes is more consistent with the features seen in individual tomograms and those reported by Saito et al. (1984) and Wagenknecht et al. (2002).
Technical issues related to template matching in tomograms
The detection and alignment of densities in large tomograms with reference densities (motifs or templates) is a daunting, computationally intense process. This study is one of a handful of serious attempts to extract novel information about a particular macromolecular complex from a few noisy tomograms. In addition to the potentially interesting new biology uncovered, the study allowed the development of useful methods for use in template matching. Uniformly sampling the unit sphere reduces the number of large CCFs necessary by a factor of 2/π. The fine alignment by gradient ascent method retains the 1° accuracy of Boehm et al., (2000) yet requires fewer calculations. The ± 5° scan for three euler angles used by Boehm et al., (2000), requires the calculation of 113 (1331) CCFs. The gradient ascent approach requires 33 × Ω CCF calculations, where Ω is the solid angle between the start orientation and the local maxima. For a 5° solid angle our method requires 135 calculations, one-tenth the number required by Boehm et al., (2000).
The native environment of the RyR presented a number of challenges that were not predicted by simulations with phantom data and thus needed to be solved empirically. For example, reduction of false positive “hits” to manageable levels was only possible after a major modification to the template, namely, incorporation of the bilayer density to distinguish the receptor from myriads of similarly sized and shaped features in the noisy tomograms. This modification to the template had the same effect as segmenting the target volume in advance to include only membrane regions. Pinning down precise particle locations was as dependent on classification schemes as on advanced cross-correlation procedures; the importance of peak classification has been noted previously (Boehm et al. 2000; Frangakis et al. 2002; Rath et al, 2003). Our implementation of K-means cluster analysis for this purpose, though relatively simple, appears to be at least as effective as other approaches. In addition to correctly grouping redundancies the K-means cluster analysis also purged false positives. We found that most false positives occurred for relatively few orientations of the template. These spurious peaks were absorbed into nearby clusters whose centers generally defined true positives. Fine alignment (but not particle detection) benefited significantly from modulation of the motif to account for partial information transfer at the microscope and in the reconstruction process. Not having to modulate the template during the initial large-scale particle search inside tomograms saves considerable computation. The approach to deal with alignment problems caused by macromolecular crowding in arrays was derived, in part, from studies with phantoms. Finally, our use of principal component analysis and correspondence analysis to classify the micro-environments around receptors (after dividing them into pseudo-monomers) goes beyond the previous applications of PCA and CA for routine particle classification.
Supplementary Material
Acknowledgments
We would like to thank Dr. Ramon Trujillo for generously providing us with the three-dimensional density of RyR1 used as template for this study, and Dr. Joachim Jaeger for recognizing and helping us match the lattice structure of calsequestrin in our tomographic data. This work was supported by NIH NCRR Grant P41 RR01219 that funds the Wadsworth Center's Resource for Visualization of Biological Complexity (RVBC) as a National Biomedical Technology Resource Center (P.I.: J. Frank), and NIH Grant AR40615 (P.I.: T. Wagenknecht).
Footnotes
Publisher's Disclaimer: This is a PDF file of an unedited manuscript that has been accepted for publication. As a service to our customers we are providing this early version of the manuscript. The manuscript will undergo copyediting, typesetting, and review of the resulting proof before it is published in its final citable form. Please note that during the production process errors may be discovered which could affect the content, and all legal disclaimers that apply to the journal pertain.
References
- Anderson AA, Treves S, Biral D, Betto R, Sandona D, Ronjat M, Zorzato F. The Novel Skeletal Muscle Sarcoplasmic Reticulum JP-45 Protein: Molecular Cloning, Tissue Distribution, Developmental Expression, And Interaction With α1.1 Subunit Of The Voltage-Gated Calcium Channel. J Biol Chem. 2003;278:39987–39992. doi: 10.1074/jbc.M305016200. [DOI] [PubMed] [Google Scholar]
- Beck M, Foerster F, Ecke M, Plitzko J, Melchior F, Gerisch G, Baumeister W, Ohad M. Nuclear pore complex structure and dynamics revealed by cryoelectron tomography. Science. 2004;306:1387–90. doi: 10.1126/science.1104808. [DOI] [PubMed] [Google Scholar]
- Boehm J, Frangakis AS, Hergerl R, Nickell S, Typke D, Baumeister W. Toward detecting and identifying macromolecules in a cellular context: template matching applied to electron tomograms. Proc Natl Acad Sci USA. 2000;97:14245–50. doi: 10.1073/pnas.230282097. [DOI] [PMC free article] [PubMed] [Google Scholar]
- Bonetta L. Zooming in on electron tomography. Nature Methods. 2005;2:139–144. [Google Scholar]
- Brandt NR, Caswell AH, Wen SR, Talvenheimo JA. Molecular interactions of the junctional foot protein and dihydropyridine receptor in skeletal muscle triads. J Membrane Biol. 1990;113:237–251. doi: 10.1007/BF01870075. [DOI] [PubMed] [Google Scholar]
- Chou T, Kim KS, Oster G. Statistical thermodynamics of membrane bending-mediated protein-protein attractions. Biophys J. 2001;80:1075–87. doi: 10.1016/S0006-3495(01)76086-9. [DOI] [PMC free article] [PubMed] [Google Scholar]
- Crowther RA, DeRosier DJ, Klug A. The reconstruction of a three dimensional structure from projections and its application to electron microscopy. Proc Roy Soc Lond A. 1970;317:319–340. doi: 10.1098/rspb.1972.0068. [DOI] [PubMed] [Google Scholar]
- Dan N, Safran SA. Effect of lipid characteristics on the structure of transmembrane proteins. Biophys J. 1998;75:1410–4. doi: 10.1016/S0006-3495(98)74059-7. [DOI] [PMC free article] [PubMed] [Google Scholar]
- Frank J, Radermacher M, Penczek P, Zhu J, Li Y, Ladjadj M, Leith A. SPIDER and WEB: processing and visualization of images in 3D electron microscopy and related fields. J Struct Biol. 1996;116:190–9. doi: 10.1006/jsbi.1996.0030. [DOI] [PubMed] [Google Scholar]
- Frank J, Wagenknecht T, McEwen BF, Marko M, Hsieh C, Mannella CA. Three-dimensional imaging of biological complexity. J Struct Biol. 2002;138:85–91. doi: 10.1016/s1047-8477(02)00019-9. [DOI] [PubMed] [Google Scholar]
- Frankgakis A, Boehm J, Foerster F, Nickell S, Nicastro D, Typke D, Hegerl R, Baumeister W. Identification of macromolecular complexes in cryoelectron tomograms of phantom cells. Proc Natl Acad Sci USA. 2002;99:14153–8. doi: 10.1073/pnas.172520299. [DOI] [PMC free article] [PubMed] [Google Scholar]
- Franzini-Armstrong C, Kenney LJ, Varriano-Marston E. The structure of calsequestrin in triads of vertebrate skeletal muscle: a deep-etch study. J Cell Biol. 1987;105:49–56. doi: 10.1083/jcb.105.1.49. [DOI] [PMC free article] [PubMed] [Google Scholar]
- Franzini-Armstrong C, Protasi F, Ramesh V. Shape, size, and distribution of Ca2+ release units and couplons in skeletal and cardiac muscles. Biophys J. 1999;77:1528–1539. doi: 10.1016/S0006-3495(99)77000-1. [DOI] [PMC free article] [PubMed] [Google Scholar]
- Franzini-Armstrong C, Kenney LJ, Varriano-Marston E. The structure of calsequestrin in triads of vertebrate skeletal muscle: a deep-etch study. J Cell Biol. 1987;105:49–56. doi: 10.1083/jcb.105.1.49. [DOI] [PMC free article] [PubMed] [Google Scholar]
- Hsieh CE, Leith A, Mannella CA, Frank J, Marko M. Towards high-resolution three-dimensional imaging of native mammalian tissue: electron tomography of frozen-hydrated rat liver sections. J Struct Biol. 2006;153:1–13. doi: 10.1016/j.jsb.2005.10.004. [DOI] [PubMed] [Google Scholar]
- Hsieh CE, Marko M, Frank J, Mannella CA. Electron tomographic analysis of frozen-hydrated tissue sections. J Struct Biol. 2002;138:63–73. doi: 10.1016/s1047-8477(02)00034-5. [DOI] [PubMed] [Google Scholar]
- Jones LR, Zhang L, Sanborn K, Jorgensen AO, Sanborn J. Purification, primary structure, and immunological characterization of the 26-kDa calsequestrin binding protein (junctin) from cardiac junctional sarcoplasmic reticulum. J Biol Chem. 1995;270:30787–30796. doi: 10.1074/jbc.270.51.30787. [DOI] [PubMed] [Google Scholar]
- Lewis JP. Fast Template Matching. Vision Interface 120-123 proceedings of the Canadian Image Processing and Pattern Recognition Society; Quebec City, Quebec, Canada. May 15-19, 1995.1995. [Google Scholar]
- Marko M, Hsieh CB, Schalek R, Frank J, Mannella CA. Focused-ion-beam thinning of frozen-hydrated biological specimens for cryo-electron microscopy. Nat Methods. 2007;4:215–7. doi: 10.1038/nmeth1014. [DOI] [PubMed] [Google Scholar]
- Marx SO, Ondrias K, Marks AR. Coupled gating between individual skeletal muscle Ca2+ release channels (ryanodine receptors) Science. 1998;281:818–821. doi: 10.1126/science.281.5378.818. [DOI] [PubMed] [Google Scholar]
- Nicastro D, McIntosh JR, Baumeister W. 3D structure of eukaryotic flagella in a quiescent state revealed by cryo-electron tomography. Proc Natl Acad Sci USA. 2005;102:15889–94. doi: 10.1073/pnas.0508274102. [DOI] [PMC free article] [PubMed] [Google Scholar]
- Ortiz JO, Forster F, Kurner J, Linaroudis A, Baumeister W. Mapping 70S ribosomes in intact cells by cryoelectron tomography and pattern recognition. J Struct Biol. 2006;156:334–41. doi: 10.1016/j.jsb.2006.04.014. [DOI] [PubMed] [Google Scholar]
- Paolini C, Protasi F, Franzini-Armstrong C. The relative position of RyR feet and DHPR tetrads in skeletal muscle. J Molec Biol. 2004;342:145–53. doi: 10.1016/j.jmb.2004.07.035. [DOI] [PubMed] [Google Scholar]
- Penczek P, Marko M, Buttle K, Frank J. Double-tilt electron tomography. Ultramicroscopy. 1995;60:393–410. doi: 10.1016/0304-3991(95)00078-x. [DOI] [PubMed] [Google Scholar]
- Radermacher M, Rao V, Grassucci R, Frank J, Timerman AP, Fleischer S, Wagenknecht T. Cryo-electron microscopy and three-dimensional reconstruction of the calcium release channel/ryanodine receptor from skeletal muscle. J Cell Biol. 1994;127:411–23. doi: 10.1083/jcb.127.2.411. [DOI] [PMC free article] [PubMed] [Google Scholar]
- Rath BK, Marko M, Radermacher M, Frank J. Low-dose automated electron tomography: a recent implementation. J Struct Biol. 1997;120:210–8. doi: 10.1006/jsbi.1997.3924. [DOI] [PubMed] [Google Scholar]
- Rath BK, Hergerl R, Leith A, Shaikh TR, Wagenknecht T, Frank J. Fast 3D motif search of EM density maps using a locally normalized cross-correlation function. J Struct Biol. 2003;144:95–103. doi: 10.1016/j.jsb.2003.09.029. [DOI] [PubMed] [Google Scholar]
- Roseman AM. Particle finding in electron micrographs using a fast local correlation. Ultramicroscopy. 2003;94:225–36. doi: 10.1016/s0304-3991(02)00333-9. [DOI] [PubMed] [Google Scholar]
- Rossi AM, Dirksen RT. Sarcoplasmic reticulum: The dynamic calcium governor of muscle. Muscle & Nerve. 2006;33:715–731. doi: 10.1002/mus.20512. [DOI] [PubMed] [Google Scholar]
- Saito A, Seiler S, Chu A, Fleischer S. Preparation and morphology of sarcoplasmic reticulum terminal cisternae from rabbit skeletal muscle. J Cell Biol. 1984;99:875–85. doi: 10.1083/jcb.99.3.875. [DOI] [PMC free article] [PubMed] [Google Scholar]
- Sali A, Glaeser R, Barnest T, Baumeister W. From words to literature in structural proteomics. Nature. 2003;422:216–25. doi: 10.1038/nature01513. [DOI] [PubMed] [Google Scholar]
- Samso M, Wagenknecht T, Allen PD. Internal structure and visualization of transmembrane domains of the RyR1 calcium release channel by cryo-EM. Nature Struct Molec Biol. 2005;12:539–44. doi: 10.1038/nsmb938. [DOI] [PMC free article] [PubMed] [Google Scholar]
- Serysheva I, Hamilton S, Chiu W, Ludtke S. Structure of Ca2+ release channel at 14 A resolution. J Molec Biol. 2005;345:427–31. doi: 10.1016/j.jmb.2004.10.073. [DOI] [PMC free article] [PubMed] [Google Scholar]
- Stern MD, Song LS, Cheng HP, Sham JSK, Yang HT, Boheler KR, Rios DE. Local control models of cardiac excitation-contraction coupling--a possible role for allosteric interactions between ryanodine receptors. J Gen Physiol. 1999;113:469–489. doi: 10.1085/jgp.113.3.469. [DOI] [PMC free article] [PubMed] [Google Scholar]
- Takeshima H, Komazaki S, Nishi M, Iino M, Kangawa K. Junctophilins: a novel family of junctional membrane complex proteins. Molecular Cell. 2000;6:11–22. doi: 10.1016/s1097-2765(00)00003-4. [DOI] [PubMed] [Google Scholar]
- Takeshima H, Shimuta M, Komazaki S, Ohmi K, Nishi M, Iino M, Miyata A, Kangawa K. Mitsugumin29, a novel synaptophysin family member from the triad junction in skeletal muscle. Biochem J. 1998;331:317–322. doi: 10.1042/bj3310317. [DOI] [PMC free article] [PubMed] [Google Scholar]
- Treves S, Feriotto G, Moccagatta L, Gambari R, Zorzato F. Molecular cloning, expression, functional characterization, chromosomal localization, and gene structure of junctate a novel integral calccium binding protein of sarco(endo)plasmic reticulum membrane. J Biol Chem. 2000;275:39555–39568. doi: 10.1074/jbc.M005473200. [DOI] [PubMed] [Google Scholar]
- Wagenknecht T, Hsieh CE, Rath BK, Fleischer S, Marko M. Electron tomography of frozen-hydrated isolated triad junctions. Biophys J. 2002;83:2491–501. doi: 10.1016/S0006-3495(02)75260-0. [DOI] [PMC free article] [PubMed] [Google Scholar]
- Wagenknecht T, Radermacher M, Grassucci R, Berkowitz J, Xin HB, Fleischer S. Locations of calmodulin and FK506-binding protein on the three-dimensional architecture of the skeletal muscle ryanodine receptor. J Biol Chem. 1997;272:32463–32471. doi: 10.1074/jbc.272.51.32463. [DOI] [PubMed] [Google Scholar]
- Weisleder N, Brotto M, Komazaki S, Pan Z, Zhao XL, Nosek T, Parness J, Takeshima H, Ma JJ. Muscle aging is associated with compromised Ca2+ spark signaling and segregated intracellular Ca2+ release. J Cell Biol. 2006;174:639–645. doi: 10.1083/jcb.200604166. [DOI] [PMC free article] [PubMed] [Google Scholar]
- Wang S, Trumble WR, Liao H, Wesson CR, Dunker AK, Kang CH. Crystal structure of calsequestrin from rabbit skeletal muscle sarcoplasmic reticulum. Nature Struct Biol. 1998;5:476–83. doi: 10.1038/nsb0698-476. [DOI] [PubMed] [Google Scholar]
- Yin CC, Lai FA. Intrinsic lattice formation by the ryanodine receptor calcium-release channel. Nat Cell Biol. 2000;2:669–71. doi: 10.1038/35023625. [DOI] [PubMed] [Google Scholar]
- Zalk R, Lehnart SE, Marks AR. Modulation of the ryanodine receptor and intracellular calcium. Annual Review of Biochemistry. 2007;76:367–385. doi: 10.1146/annurev.biochem.76.053105.094237. [DOI] [PubMed] [Google Scholar]
- Zorzato F, Anderson AA, Ohlendieck K, Froemming G, Guerrini R, Treves S. Identification of a novel 45 kDa protein (JP-45) from rabbit sarcoplasmic-reticulum junctional-face membrane. Biochem J. 2000;351:537–543. [PMC free article] [PubMed] [Google Scholar]
Associated Data
This section collects any data citations, data availability statements, or supplementary materials included in this article.