

Abstract
Setting aside pluripotent cells that give rise to the future body is a central cell fate decision in mammalian development. It requires some blastomeres divide asymmetrically to direct cells to the inside of the embryo. Despite its importance, it is unknown whether the decision to divide symmetrically versus asymmetrically shows any spatial or temporal pattern; whether it is lineage-dependent or occurs at random; or whether it influences the orientation of the embryonic-abembryonic axis. To address these questions, we developed time-lapse microscopy to enable a complete 3D analysis of the origins, fates and divisions of all cells from the 2- to 32-cell blastocyst stage. This showed how in the majority of embryos individual blastomeres give rise to distinct blastocyst regions. Tracking the division orientation of all cells revealed a spatial and temporal relationship between symmetric and asymmetric divisions and how this contributes to the generation of inside and outside cells and so embryo patterning. We found that the blastocyst cavity, defining the abembryonic pole, forms where symmetric divisions predominate. Tracking cell ancestry indicated that the pattern of symmetric/asymmetric divisions of a blastomere can be influenced by its origin in relation to the animal-vegetal axis of the zygote. Thus, it appears that the orientation of the embryonic-abembryonic axis is anticipated by earlier cell division patterns. Together our results suggest that two steps influence allocation of cells to the blastocyst. The first step involving orientation of 2- to 4-cell divisions along the animal-vegetal axis can affect the second step, the establishment of inside and outside cell populations by asymmetric 8-32-cell divisions.
Introduction
In early mouse development, pluripotent cells become set apart in the inside compartment of the embryo. This happens because some cells divide asymmetrically rather than symmetrically in the fourth and fifth rounds of cleavage. These inside cells develop into the inner cell mass (ICM) of the blastocyst. The outside cells progressively lose their pluripotency and differentiate into trophectoderm (TE), an extra-embryonic tissue, by the blastocyst stage. Thus, the regulation of occurrence of symmetric versus asymmetric cell divisions ensures an appropriate number of inside versus outside cells (Fleming, 1987). Despite its importance, it is still unclear whether there is any spatial or temporal pattern to the distribution of symmetric and asymmetric cell divisions. If there is, does such pattern relate to particular lineages of early blastomeres or is it independent of these? It also remains unclear whether differential positioning of cells, inside versus outside, is an essential prerequisite for any first differences to appear between mouse embryo cells. Might some early pattern, meaning a propensity for blastomeres to divide with specific orientations and/or order, exist prior to setting up the inside and outside cell populations? If so, how might this early pattern relate to the series of symmetric and asymmetric cleavage divisions that position cells?
Two distinct models have been put forward to account for early mouse development. One stresses that the mouse embryo is entirely symmetric, does not have an animal-vegetal (AV) axis or show any other pre-patterning and consequently develops as a ball of identical cells dividing with random orientations (Alarcon and Marikawa, 2003; Hiiragi and Solter, 2004; Motosugi et al., 2005). According to this view, the first differences between cells can appear only when inside and outside cell populations are established after the fourth cleavage divisions. This model also concludes that the blastocyst cavity forms at a random site and so the orientation of the embryonic-abembryonic axis does not relate to any earlier developmental event (Motosugi et al., 2005). This view is based on some lineage tracings of 2-cell blastomeres indicating that their allocation to embryonic or abembryonic parts of the blastocyst is often unpredictable and on an idea that the regulative development of embryos argues against any form of pattern (Alarcon and Marikawa, 2003; Motosugi et al., 2005; Chroscicka et al., 2004). A second model proposes that some differences between cells can be detected before cells adopt differential, inside or outside, positions and whether these differences appear early depends on the orientation of cell divisions along the AV axis (Gardner, 1997; Gardner, 2001; Gardner, 2002; Piotrowska et al., 2001; Piotrowska and Zernicka-Goetz, 2001; Piotrowska-Nitsche et al., 2005). The first evidence leading to this view was the finding that the orientation of the first cleavage division along the AV axis tends to be perpendicular to the embryonic-abembryonic axis of the future embryo. Consequently, in most embryos descendents of 2-cell blastomeres contribute more cells to either the embryonic or abembryonic parts of the blastocyst (Gardner, 2001; Piotrowska et al., 2001; Fujimori et al., 2003; Plusa et al., 2005a). Subsequently, it was suggested that this spatial distribution of the progeny of 2-cell blastomeres depends upon separation of the animal and vegetal parts of the zygote by second-cleavage divisions (Piotrowska-Nitsche and Zernicka-Goetz, 2005). This model is further supported by the discovery that the degree of pluripotency differs significantly between blastomeres already at the 4-cell-stage and depends upon whether they inherit predominantly animal, vegetal, or components of both poles of the zygote (Piotrowska-Nitsche et al, 2005). These differences in pluripotency appear to depend on the extent of particular epigenetic modifications that affect development of pluripotency (Torres-Padilla et al., 2007). It is implicit to this second model that the early differences between blastomeres are not determinative, but show plasticity and can be re-programmed if development is perturbed (Zernicka-Goetz, 2006). Thus, existence of such early differences between cells of the mouse embryo is entirely compatible with the regulative nature of development.
If the route taken by each cell to their destinations can be analysed, this should advance our understanding of how the blastocyst develops and provide a direct method of detecting developmental regularities. A recent study using continuous recording of the cell lineage in the mouse embryo has added to our knowledge by documenting the proximity of cells with a shared clonal origin, the degree of asynchrony of rounds of cell divisions and the moment-to-moment movement of nuclei (Kurotaki et al., 2007). The remaining gaps in knowledge concern the relationship of cell lineage to inside and outside positions of cells in the morulae and blastocyst and how this might be affected by different patterns of early cleavage divisions. To address this we have undertaken a complete analysis of all cell origins and fates in relation to orientations of all cell divisions to ask whether cells are allocated at random to the different blastocyst regions (embryonic and abembryonic) and lineages (ICM and TE) or whether there are some regularities, i.e. pattern, to their allocation. Are the orientations of the second-cleavage divisions predictive of how pattern develops in relation to the embryonic-abembryonic axis? Do successive cleavage divisions influence the subsequent allocation of cells to ICM and TE in particular sectors of the blastocyst? Finally, exactly how does the embryonic-abembryonic axis relate to the spatio-temporal sequence of symmetric and asymmetric cell divisions?
To obtain a complete and precise dataset of 3-dimensional (3D) coordinates of all cells, their lineages and the orientation of all their divisions from the 2-cell to the blastocyst, we have developed time-lapse microscopy on multiple focal planes extending over this 3-day period. This non-invasive method showed that in the significant majority of embryos the descendants of individual blastomeres give rise to distinct regions of the blastocyst. The 3D-lineage analysis revealed that there is a spatial and temporal relationship between symmetric and asymmetric divisions and demonstrated the way this contributes to patterning of the embryo and generation of the ICM and TE. Moreover, it indicated that the frequency of symmetric/asymmetric divisions of a blastomere correlates with its origin in relation to the AV axis of the zygote. Finally, it provided evidence that symmetric divisions anticipate the site of blastocyst cavity formation and so the orientation of the embryonic-abembryonic axis.
Materials and Methods
Generation of 4D movies
F1 (C57BL/6xCBA) females were mated with males expressing EGFP-H2B (Hadjantonakis and Papaioannou, 2004). 2-cell embryos were collected in M2 medium and then cultured in KSOM (Piotrowska-Nitsche et al., 2005). Time-lapse imaging was performed using a Zeiss Axiovert microscope, Hamamatsu camera and Kinetic-imaging software. Fluorescence and DIC Z-stacks were collected every 15 min, on 15 different planes for each time point, from 2-cell to blastocyst stage. Obtained PICT files were converted to TIF using VisBio (LOCI, Wisconsin) and ImageJ (NIH, Bethesda).
Analysis of 4D movies
All cells were followed manually using SIMI Biocell software (Schnabel et al., 1997). 3D coordinates of nuclei were saved on average every two to three frames and analysed as described in Results. All cell tracing was carried out blindly, before assigning embryos to sub-groups, and cross-checked by two researchers.
Cell divisions were classified as symmetric or asymmetric for all 8- and 16-cell blastomeres by scoring the position of daughter cells relative to the embryo surface one frame after and one before the next division in both DIC and fluorescence (see also Results). The timing of development was assessed as the period between successive 2nd to 5th cleavages.
To describe the relative position of blastomeres in the 2- to 4-cell cleavage we measured the angle between their apposing planes 15 min after division of the second blastomere using SIMI Biocell. We rotated the 3D representation of the embryo to look laterally at the axis defined by the daughters of the first 2- to 4-cell division and read the angle between this axis and that of the second 2- to 4-cell division (Fig. 4A).
Fig. 4. The influence of the animal-vegetal axis on the generation of different blastocyst patterns.

(A)-(C) Classification of embryos according to sequence and orientation of second cleavage divisions. (A) To measure the angle (α) between the division planes of the 2-cell blastomeres (white lines), 3D representations were rotated to look at the angle (illustrated with the eye). (B) Scheme illustrating the measurement of the distance of cells to the polar body (PB, Methods). (C) Box-plot showing relationship between the four classes and α. The table shows average angles for each class (n=sample size). (D) Table showing the frequency of the different blastocyst patterns in each of the four embryo classes.
We calculated the distance between polar body (PB) and the centre of the two daughter cells during division in pixels using SIMI Biocell (Fig. 4B). Descendants of meridionally dividing blastomeres (M) were positioned equidistantly from the PB. After equatorial/oblique division (E), only one of the two daughter cells touched the PB and the distances between daughters and the PB differed by approximately one cell diameter (≈25-35 pixel).
From the 80 cavitated embryos, we analysed 66. Embryos were excluded because M and E divisions occurred synchronously, or the PB did not stay attached before the 2nd cleavage, or the movie ended before cavitation.
Results
Clonal inheritance of pattern in the blastocyst
To obtain an objective dataset of the 3D coordinates of all cells, the orientation of all their divisions, the lengths of their cell cycles and timing of mitoses from the 2-cell to the blastocyst stage, we developed methods of time-lapse microscopy. To visualise nuclei we used EGFP-H2B transgenic embryos and recorded DIC and fluorescence images as 5μm serial optical sections every 15 min as development progressed (Fig.1 and Supplementary Movies S1-S2). The 3D coordinates of every cell in 66 embryos were traced using SIMI Biocell software, which enabled their detailed analysis throughout this period.
Fig. 1. 4D analysis of early mouse development.

Lineage generated with SIMI Biocell. Merges of 3D representations and DIC images from 2-cell-stage to blastocyst are shown (2-cell-stage descendants are coloured red or blue).
The 8-cell-stage is pivotal in the development of the mouse embryo as asymmetric divisions start from this stage, generating the first inside cells. Thus, our analysis first focused upon evaluating the spatial contribution of the four clonal descendants of each of the 8-cell blastomeres up to the 32-cell blastocyst. To achieve this a coordinate of each 8-cell blastomere clone was assigned by calculating their centres of gravity using ImageJ (Fig. 2A-D). These were mapped with respect to the blastocyst’s embryonic-abembryonic axis. To do this, the 3D positional information obtained from the SIMI Biocell analysis was used to rotate the 3D representations of the blastocysts, so that their embryonic parts faced towards the left, placing the embryonic-abembryonic boundary in direct line of sight. We also calculated the coordinate of the centre point of the embryonic-abembryonic boundary and used this to align a tracing of the cavity. All this ensured that each embryo was identically aligned in 3D space. The orientated 3D representations were then projected onto 2D. This allowed the centre of gravity of each 8-cell-clone to be accurately positioned in the embryonic or the abembryonic part of the embryo, the abembryonic part being the region around the cavity. If the centres of gravity lay upon the projected region occupied by the cavity then they were considered as abembryonic since at least half of the clone is positioned at the cavity or at the border of the cavity (Fig. 2E-H).
Fig. 2. Blastocysts show distinctive clonal patterns.

(A-D) Embryos were analysed using the centres of gravity of the clones made up of the descendants of the 8-cell-stage blastomeres. (A) Merge of DIC and 3D representation of a blastocyst (Colouring as B). (B) Colours used to code for the 2- and 8-cell-stage descendants. MM and EE embryos were colour coded by placing the first dividing cells in the left lineage. M=meridional 2nd cleavage division (M1 and M2 being their daughters); E=equatorial 2nd cleavage division; EA, EV=descendants of 4-cell blastomeres produced by equatorial division. A=animal, V=vegetal. (C) Determining the centre of gravity of each clone. The centroids (white dot) of the tetragons (white dashed lines) defined by the 8-cell-stage descendants were calculated (example shown for the blue clone). The coordinate of the mid-point of the embryonic-abembryonic boundary (red dot) was used to align an illustration of the cavity (white ellipse). (D) Scheme generated using the method described in (C). Each dot represents the centre of gravity of a single 8-cell clone. The ellipse indicates cavity position and the dashed ellipse the outline of the embryo. (E-G) Schemes representing the three different groups of blastocysts. 8-cell clones (upper row) and 2-cell clones (lower row) use the colour code in (B). The frequency of each group is indicated (n=66). (E) “Embryonic/abembryonic“ pattern. Arrowhead marks region #4. (F) ‘Half-half’ pattern. The dashed line indicates the separation of the 2-cell-stage clones. (G) ‘Mixed” pattern. (H) Schematic embryonic/abembryonic pattern. Colour code as shown in (B). Regions derived from one 2-cell-stage blastomere are positioned in the embryonic part (left). One region reaches slightly into the abembryonic part (asterisk). Three regions of the other 2-cell-stage blastomere are positioned in the abembryonic part (right) - one region (“region #4”/“dovetailed region”) is positioned in the embryonic part (#4). The embryonic-abembryonic boundary is indicated by the dashed line. The presence of region #4 might explain the shift of this axis (red arrow; black line).
If there were no pattern to the distribution of 8-cell clones in relation to embryonic-abembryonic axis of the blastocyst, we would expect that in the majority of embryos the clones would be randomly distributed. However, we found that in 61% of all embryos analysed, 8-cell clones showed the same relative arrangement along the embryonic-abembryonic axis (Figs. 2E; S1-S11). In these embryos, the centres of gravity of the four clones originating from one 2-cell blastomere were mainly positioned in the embryonic part of the embryo. Of the four clones originating from the other 2-cell blastomere, three of their centres were positioned in the abembryonic part around the cavity. The fourth was “dovetailed” into the embryonic part or found at the embryonic-abembryonic boundary, but rarely at the cavity. Interestingly, it appeared that the generation of this “dovetailed 1/8 clone” (clone #4; Fig. 2H) is associated with a distinctive pattern of cell division at the 4th and 5th cleavages (see also below). Embryos displaying this uniform arrangement of clones will be referred to as showing “embryonic/abembryonic pattern”. Only in 12% of all 66 embryos, did the four 8-cell clones originating from one 2-cell-stage blastomere have their centres of gravity in a region comprising equivalent amounts of the embryonic and abembryonic parts of the blastocyst (“half-half embryos”; Figs. 2F; S1-S11). The remainign 27% of embryos showed a distribution of 2-cell clones intermediate between the above two categories, which included embryos in which clones were coherent and others in which clones were dispersed (“mixed”; Figs. 2G; S1-S11). When we compared the frequencies of occurrence of these three different groups of embryos to those expected by chance, we found that it was not random (χ2 test; p<0.001). The group showing the “embryonic/abembryonic pattern” significantly predominated1. In this group, each 2-cell blastomere tends to contribute to either the embryonic or abembryonic part of the blastocyst, rather than evenly to both, which shows that these patterns reflect the lineage history of the 8-cell clones.
We next considered whether the generation of blastocysts represented in the three different groups could have been due to a particular positioning of cells before the blastocyst cavity had formed or due to the re-organisation of cells during the process of cavitation. To address this question, we analysed the 3D positioning of 8-cell clones in 32-cell embryos at two stages: just before and immediately following cavitation. This revealed that cavitation in general does not alter the relative spatial arrangement of clones, but clones stretch to “accommodate” the cavity (Figs. S1-S11). If at all, we could observe only a slight displacement of clones as the cavity expands.
The finding of predominance of the “embryonic/abembryonic pattern” indicates that in a significant number of embryos the future cavity will be surrounded predominantly by the descendents of one of the 2-cell blastomeres (Fig. 3). This suggests that the positioning of the blastocyst cavity and, therefore, the orientation of the embryonic-abembryonic axis is biased by earlier developmental events in a significant majority of mouse embryos.
Fig. 3. Model for the generation of blastocyst pattern.

The 32-cell embryo consists of two clones derived from 2-cell blastomeres, which show an arrangement reminiscent of a “baseball”. Based on the arrangement of 2-cell-stage clones there are three different possibilities for the positioning of the blastocyst cavity (white dot). (A) The cavity develops within one clone which leads to “embryonic/abembryonic” pattern. (B) The cavity forms over the border between the 2-cell-stage clones which leads to “half-half” pattern. (C) The cavity forms more randomly with respect to the border of the 2-cell clones generating blastocysts with “mixed” pattern. (D) Scheme illustrating the lineage-dependency of the different patterns. Only the embryonic-abembryonic pattern reflects the lineage history with respect to the 2-cell-stage.
Relationship of the spatial arrangements of clones to the type of second cleavage
As the embryonic/abembryonic pattern was present in a significant majority (61%), but not all embryos, we next wondered whether the frequency with which it develops might depend upon earlier division orientations, which we have previously found to influence developmental outcomes (Piotrowska-Nitsche et al., 2005; Piotrowska-Nitsche and Zernicka-Goetz, 2005; Torres-Padilla et al., 2007). There are four different permutations of second cleavage division depending on their sequence and orientation with respect to the AV axis of the zygote. A meridional division (along the AV axis) of one 2-cell blastomere may be followed by an equatorial one of its sister cell (ME embryos) or this sequence might be reversed (EM embryos). These two division patterns are most common (Gardner, 2002; Piotrowska-Nitsche and Zernicka-Goetz, 2005). Less common are divisions in which both blastomeres divide with the same orientation: either both meridionally (MM) or equatorially (EE). Our previous studies showed that how the embryo divides at the 2- to 4-cell transition significantly affects its subsequent development. Thus, for example, embryos in which animal and vegetal components are separated in both blastomeres (EE embryos) were compromised in their developmental potential in relation to the other groups of embryos. Interestingly, the 4-cell blastomeres of one of the most common groups, ME embryos, were found to differ significantly from each other. Specifically, the blastomere that inherits vegetal components was found to be restricted in its developmental potential and extent of particular epigenetic modifications in relation to other blastomeres (Piotrowska-Nitsche et al., 2005; Torres-Padilla et al., 2007). Therefore we wished to examine whether the pattern of 8-cell clones might develop in relation to the different spatio-temporal pattern of second-cleavage divisions that affect separation of animal and vegetal components of the zygote.
To address this we first wished to establish a quantitative assessment of the orientations of second-cleavage divisions. The recorded images of dividing embryos allowed this by enabling measurement of the angle between division planes and the distances between cells and the second PB, which together facilitated assigning each embryo to one of the four classes (Fig. 4A,B; see Methods). As expected, we found that the two second-cleavage planes in ME and EM embryos lay more orthogonal to each other (α= 64° and 65°) than they did in MM and EE embryos (α = 15° and 28°) (Fig. 4C). Within the group of 66 embryos there were 24 ME (36%), 22 EM (33%), 13 MM (20%) and 7 EE (11%) embryos. Thus, embryos in which the second-cleavages were perpendicular to each other (ME and EM) were most common in agreement with some previous studies (Gardner, 2002; Piotrowska-Nitsche and Zernicka-Goetz, 2005) but not with others (Louvet-Vallee et al., 2005).
When we examined the distribution of the 8-cell clones in blastocysts, we found that the frequency of development of embryonic/abembryonic pattern differed depending on the second-cleavage orientations. It was evident in 71% of ME, 55% of EM, 54% of MM and 57% of EE embryos. Thus, strikingly, ME embryos display a significant tendency to develop the embryonic/abembryonic pattern (χ2 test, p=0.014; Fig. 4D) suggesting that the second-cleavages bisecting the AV axis, could influence development.
Relationships between symmetric and asymmetric divisions in generating inside and outside cells
We next wondered whether the specific spatial distribution of 8-cell clones revealed by the above analysis, indicated any regional differences in the generation of inside and outside cells leading to embryonic/abembryonic pattern. Inner, pluripotent cells are generated together with outer cells through asymmetric/differentiative divisions of some 8- and 16-cell blastomeres, while symmetrically/conservatively dividing cells generate two outside daughters (Johnson and Ziomek, 1981). Thus, to determine whether there is any relationship between these division types, we analysed all divisions asking whether they were symmetric or asymmetric at the 8- to 16-cell- and 16- to 32-cell transitions and measured all cell cycle lengths. To determine the division orientation, we scored the position (inner or outer) of daughter cells both immediately after their mitotic division and also at the end of their cell cycle, to check whether cells had changed their position. We found that in most cases (95.1%, n=1578) they did not and so cells scored as inner contributed to ICM.
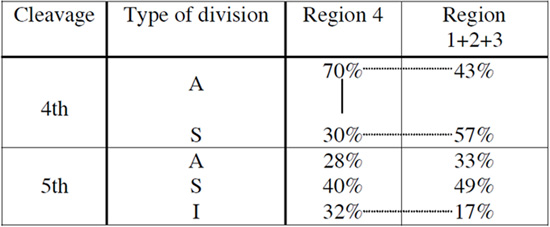
We first chose to examine the broader question of the relationship between these two types of divisions in all embryos taken together. We found that on average the proportion of asymmetric divisions was higher at the 4th cleavage whereas there were more symmetric divisions at the 5th cleavage (student’s t-test to compare frequencies of asymmetric/symmetric within 4th and 5th cleavage, p=0.003 and p<0.001, respectively; Fig. 5A). This indicated a relationship between how a cell divided in the 4th cleavage and how its daughter cells might subsequently divide as expected from the work of Fleming (1987). To explore this further we focused on analysing each division undertaken by individual 8-cell blastomeres.
Fig. 5. Analysis of division orientation.

Analysis of division orientation at the 4th and 5th cleavage divisions. (A) Percentage of asymmetric and symmetric divisions in 4th and 5th cleavage (average ± SEM). (B) Analysis of cell division orientations of the two daughters of an asymmetric (A) or symmetric (S) division in the 4th cleavage round. The possible permutations (shown) differ significantly depending on the orientation of the 4th cleavage (χ2 test, p<0.001). ‘I’ denotes a division where both daughters lie inside the embryo. (C,D) Proportion of asymmetric/symmetric divisions of the 4-cell-stage descendants at 4th and 5th cleavage (average ± SEM) for the four classes. (C) ME and EM embryos, (D) MM and EE embryos. Each pair of columns represents the descendants of one of the 4-cell blastomeres (legend of Fig. 2 for abbreviations).
The two daughters of a symmetric division can subsequently divide either asymmetrically or symmetrically, with equal probability if at random. Thus, the possible division permutations of the daughters of symmetric divisions are: SS (both symmetric), AA (both asymmetric) and AS/SA (one of each, in either sequence). The outside daughter cell of an asymmetric division can also divide either asymmetrically or symmetrically, again with equal probability if at random (the inside daughter divides to generate two inside cells; inner division, I). However, we found that the type of successive division undertaken by an outside cell from the 4th to the 5th cleavage is not taken at random. Our analysis shows that a symmetrically dividing mother-cell most frequently produced daughters one of which undertook an asymmetric and the other, a symmetric division (χ2 test, p<0.001, Fig. 5B). Thus, cells derived from a symmetrically dividing mother have an equal chance to divide symmetrically or asymmetrically. However, when the sequence of division of the daughters is considered, the first dividing daughter was more likely to divide symmetrically and the second asymmetrically (p=0.028, Fig. 5B). Additionally, an asymmetrically dividing mother cell most frequently gave rise to an outside daughter that divided symmetrically (χ2 test p<0.001, Fig. 5B). This suggests that in general, when we consider all embryos together, there is a tendency for a compensatory relationship between symmetric and asymmetric divisions in sequential cell divisions that might be important in regulating the number of inside versus outside cells.
The specific division orientation of a blastomere might be affected either by its age or by whether it divides earlier or later than its neighbours as previously suggested (Garbutt et al., 1987). However, our dataset indicated that there were no significant differences in cell cycle lengths between symmetrically and asymmetrically dividing cells (Table 1). It also showed that blastomeres undertaking earlier or later 4th cleavage divisions had no tendency to divide symmetrically rather than asymmetrically (χ2 test; p=0.89). The same held true for 16-cell blastomeres when they undertook the 5th cleavage round. Thus, it appears that neither age nor division order are likely to be factors determining the kind of division cells undertake. We also measured and analysed cell cycle lengths of inside versus outside cells in the 66 embryos studied. This showed that once positioned, inner cells have a significantly longer cell cycle than outer cells (~54 min longer, students t-test to compare average cell cycle lengths, p<0.001; Table 2).
Table 1. Average cell cycle length of symmetrically and asymmetrically dividing cells shown for each class.
| Class | Division type | Average cell cycle length (x ± SD) / min | Difference of A and S average cell cycle / min | Embryos where A has a longer cell cycle than S |
|---|---|---|---|---|
| ME | asymmetric symmetric |
779 ± 122 762 ± 128 |
17 | 50% |
| EM | asymmetric symmetric |
786 ± 93 778 ± 106 |
8 | 53% |
| MM | asymmetric symmetric |
768 ± 111 761 ± 124 |
7 | 50% |
| EE | asymmetric symmetric |
742 ± 88 725 ± 92 |
17 | 63% |
Student’s t-tests show no significant difference
Table 2. Average cell cycle lengths for outer and inner cells.
| Cell type | Average cell cycle length (x ± SD)/min |
|---|---|
| Outer cell from symmetric division1 | 718 ± 124 |
| Outer cell from asymmetric division2 | 676 ± 107 |
| Inner cell3 | 757 ± 141 |
Student’s t-tests:
- 1 vs 2: p > 0.001
- 1 vs 3: p < 0.001
- 2 vs 3: p < 0.001
Previous reports also suggested that the earlier dividing 2-cell blastomeres make a disproportionate contribution to the ICM (Barlow et al., 1972; Kelly et al., 1978; Graham and Deussen, 1978; Surani and Barton, 1984) and contribute preferentially to the embryonic rather than abembryonic blastocyst region (Piotrowska et al., 2001). We found, however, that each of the 2-cell blastomeres contributed on average an equal number of cells to the ICM at the 32-cell-stage, and the proportion of inside cells generated by the earlier dividing blastomere was insignificantly higher (52% vs. 48% from earlier or later dividing respectively, Student’s t-test, p=0.14; Supplementary Table 1). The TE also comprised equal proportions of cells derived from each of the 2-cell blastomeres (50% from both). Equally, we saw no tendency for the earlier dividing 2-cell blastomere to contribute more cells to the embryonic part of the blastocyst consistent with studies that reported embryonic-abembryonic pattern irrespective of cell division order (Fujimori et al., 2003). The knowledge of cell cycle lengths of all cells also allowed us to ask whether a tendency to divide earlier is inherited by the progeny of an earlier dividing cell. We found no significant differences in cell cycle length between progeny of either 2-cell blastomere (Table 3). The differences in the spatial contributions made by the earlier versus later dividing 2-cell blastomere in previous studies (Barlow et al., 1972; Kelly et al., 1978; Graham and Deussen, 1978; Surani and Barton, 1984; Piotrowska et al., 2001) might be due to labelling and/or repeated manipulation of embryos which influenced the behaviour of cells in ways that did not occur in the non-invasive time-lapse methods of the present approach.
Table 3. Analysis of cell cycle lengths in 3rd to 5th generation. Averages for the whole embryo (all) and for separate 2-cell stage descendants (M or E) are shown.
| Class | Lineage | Generation | Average cell cycle length / min |
|---|---|---|---|
| ME | all | 3rd 4th 5th |
771 ± 64 781 ± 107 745 ± 144 |
| M | 3rd 4th 5th |
773 ± 67 787 ± 119 738 ± 120 |
|
| E | 3rd 4th 5th |
769 ± 61 774 ± 94 752 ± 163 |
|
| EM | all | 3rd 4th 5th |
773 ± 79 787 ± 98 731 ± 118 |
| E | 3rd 4th 5th |
774 ± 71 795 ± 102 727 ± 120 |
|
| M | 3rd 4th 5th |
772 ± 87 780 ± 96 734 ± 116 |
|
| MM | all | 3rd 4th 5th |
750 ± 87 758 ± 109 696 ± 108 |
| M1 | 3rd 4th 5th |
749 ± 85 759 ± 107 694 ± 104 |
|
| M2 | 3rd 4th 5th |
751 ± 89 757 ± 110 699 ± 113 |
|
| EE | all | 3rd 4th 5th |
778 ± 136 707 ± 73 622 ± 68 |
| E1 | 3rd 4th 5th |
755 ± 127 710 ± 55 612 ± 66 |
|
| E2 | 3rd 4th 5th |
801 ± 146 705 ± 89 631 ± 69 |
Finally, we examined whether the proportions of symmetric and asymmetric divisions at the 8-to 16-cell- and 16- to 32-cell transitions taken by descendants of particular 4-cell blastomeres is influenced by whether they are animal, vegetal, or animal/vegetal cells. A multiple comparison test (ANOVA) to compare proportions of division types between blastomeres in ME, EM, EE and MM embryos revealed that there are significant differences between individual blastomeres, specifically of ME embryos (Fig. 5C,D). It appeared that descendants of the vegetal 4-cell blastomere underwent significantly more symmetric than asymmetric divisions in the 5th cleavage (p=0.02) than its sister and cousin cells in this class. This is in agreement with the observation that the majority of ME embryos develop embryonic/abembryonic pattern at the blastocyst stage. The finding that vegetal cells in ME embryos take predominantly symmetric divisions also adds to the body of evidence that these cells differ in a number of ways from other cells of 4-cell embryos (Piotrowska-Nitsche et al., 2005; Torres-Padilla et al., 2007). Moreover, it suggests that mouse embryos cannot be entirely symmetric but show some polarity along their AV axis that influences the pattern of symmetric and asymmetric cell divisions.
Pattern of symmetric and asymmetric divisions anticipate the orientation of the embryonic-abembryonic axis
The positioning of the blastocyst cavity defines the orientation of the embryonic-abembryonic axis. Our analyses of the spatial arrangement of 8-cell clones in the blastocyst revealed that the majority of mouse embryos develop with pattern with respect to the embryonic-abembryonic axis. This raised the possibility that the orientation of this axis could be predicted by a different spatio-temporal sequence of symmetric versus asymmetric divisions at the future embryonic and abembryonic poles. To address this, we followed the generation of the inner and outer cell populations and asked whether two features of the blastocyst, the dovetailed 1/8 clone and the cavity, might form with respect to a particular distribution of asymmetric versus symmetric cell divisions.
Analysis of the spatial allocation of cells within the dovetailed clone showed that it comprised on average 53% embryonic cells (28% ICM, 25% polar TE), 31% boundary cells (16% inner surface, 15% boundary TE) and 15% abembryonic cells (mural TE). In contrast, the contributions made by the other three clones from the same 2-cell blastomere are: 12% embryonic cells (8% ICM, 4% polar TE), 35% boundary cells (24% inner surface, 11% boundary TE) and 53% abembryonic cells. In agreement with this, analysis of the cell division patterns revealed that the dovetailed clone arose after significantly more asymmetric divisions during the 4th cleavage than undertaken by the other three clones derived from the same 2-cell blastomere (Table 4; χ2 to compare frequencies between clones, p=0.038). Furthermore, in the subsequent 5th cleavage, inner divisions were significantly more prevalent in the dovetailed region than in its three sister clones (Table 4, p=0.016). This indicates that specific patterns of symmetric and asymmetric divisions might influence how individual blastomeres contribute to particular blastocyst regions.
Table 4. Comparison of % different division types occurring in the dovetailed clone (clone#4) and its three sister clones in 4th and 5th cleavage.
Significant tendencies within the same clones are indicated with a solid line (p=0.035) and between clone#4 and the others with a dashed line (p=0.038 in 4th cleavage and p=0.016 in 5th)
Finally, when we analysed the patterns of symmetric versus asymmetric cell divisions in relation to positioning of the embryonic and abembryonic poles of the blastocyst, we saw that the cavity was flanked by outer cells that had divided symmetrically at the 5th cleavage. The frequency of symmetric divisions in the abembryonic part of the embryo was significantly higher than on the opposite, embryonic part (Table 5, p<0.001). Interestingly, this was again particularly evident in ME embryos (Table 5, student’s t-test to compare average frequency of A/S in dividing outer cells, p<0.001). Thus, it appears that the positioning of the blastocyst cavity and so the orientation of embryonic-abembryonic axis in the mouse embryo is not random but is anticipated by the pattern of earlier cell divisions.
Table 5. Proportion of mural TE and polar TE originating from symmetric divisions.
| Classes | % of cavity cells originating from a symmetric division | % of polar TE cells originating from a symmetric division | n |
|---|---|---|---|
|
| |||
| ME | 79* | 60* | 24 |
| EM | 74 | 68 | 22 |
| MM | 74 | 68 | 13 |
| EE | 69 | 59 | 7 |
|
| |||
| 75* | 64* | 66 | |
Indicates statistically significant difference (p<0.001)
Discussion
This complete lineage analysis of preimplantation embryos indicates that the development of pattern in the significant majority reflects the way in which cells divide in respect to the AV axis. Moreover, the relative contribution of 8-cell clones to the different parts of the blastocyst appears to reflect the predominance of either symmetric or asymmetric divisions in the 4th and 5th cleavage rounds. Cell ancestry indicates that the pattern of symmetric/asymmetric divisions of a blastomere could be linked to its origins in AV axis. Finally, the spatial and temporal distributions of symmetric and asymmetric divisions show an association with where the embryonic and abembryonic poles of the blastocyst will develop. Taken together with previous data, our results support a hypothesis in which the allocation of cells to the blastocyst is influenced by two interdependent steps. Step One involves the acquisition of differences (e.g. in epigenetic modifications) in response to the way the zygote is partitioned in relation to the AV axis. These can become apparent by the 8-cell-stage when Step Two is initiated to establish a population of inside cells through asymmetric divisions.
Development of Embryonic/Abembryonic Pattern
This non-invasive 3D lineage analysis of all cells, their origins, behaviour, and their final positioning at the blastocyst stage, provides support for cell labelling lineage studies that indicated a non-random allocation of the progeny of 2-cell and 4-cell blastomeres in the majority of mouse embryos (Gardner, 2001; Piotrowska et al., 2001; Fujimori et al., 2003; Piotrowska-Nitsche and Zernicka-Goetz, 2005). The embryonic/abembryonic pattern observed in the current study is one in which the 8-cell clones in 61% of embryos come to occupy distinct regions in relation to the embryonic-abembryonic axis. Four 8-cell clones originating from one 2-cell blastomere are mainly positioned in the embryonic part of the embryo. Of the four clones originating from the other 2-cell blastomere, three are positioned in the abembryonic part and one, “dovetailed clone” crosses more into the embryonic part and as such leads to a tilt between the embryonic-abembryonic boundary and the boundary between 2-cell blastomeres’ descendants. Thus, the tilt is the consequence of predominant asymmetric divisions that position the “dovetailed clone” (Table 4, Fig. 2H). This finding alone could account for why alternative models have been proposed to explain the clonal distribution of cells in the blastocyst. This tilt was interpreted by some authors as evidence of random cell arrangement and mixing (Alarcon and Marikawa, 2003; Chroscicka et al., 2004; Motosugi et al., 2005), and not, as shown here, as an actual part of the embryonic/abembryonic pattern.
Development in Relation to the Animal-Vegetal Axis
The present lineage tracing analysis also gives insight into another question under debate: Is the mouse embryo entirely symmetric or not? The current study suggests that the extent of development of the embryonic/abembryonic pattern depends on how the embryo divides with respect to the AV axis of the zygote. The first zygotic cleavage usually occurs along the AV axis (Plusa et al., 2005a). Only in the second cleavage rounds do equatorial divisions, separating animal and vegetal parts, become significant (Gardner, 2002). Embryonic/abembryonic pattern significantly predominates in embryos in which the animal and vegetal cells are separated by the later second cleavage division (ME embryos). This is consistent with earlier studies indicating that cells inheriting either the animal, vegetal pole or both poles of the zygote have different properties (Piotrowska-Nitsche and Zernicka-Goetz, 2005; Piotrowska-Nitsche et al., 2005; Torres-Padilla et al., 2007). This argues for zygote organisation (pre-pattern) and its AV polarity having influence upon the development of mouse embryos and speaks against the view that mouse embryos are entirely symmetrical without any pre-pattern (Hiiragi and Solter, 2004; Louvet-Vallee et al., 2005). This inconsistency may be because the authors expressing the latter view could not examine the possible influence of AV axis because the marker of this axis (the PB) did not stay attached to the embryos they studied (Hiiragi and Solter, 2004). Without any marker, it is not possible to determine whether AV axial information affects development and the development of differences among blastomeres might be classified as stochastic (Dietrich and Hiiragi, 2007). There is evidence indicating that development of the mouse embryo is influenced by whether cells divide along or perpendicular to the AV axis. Since the patterns of such divisions differ between embryos, it is essential to classify them accordingly to recognise the extent of and possible reasons behind development of blastocyst patterning. Although the embryonic/abembryonic pattern clearly predominates in ME embryos, it is also seen in others. It is possible that this also reflects the way in which the AV axis is partitioned in these embryos as a result of variability in the orientation of cleavage divisions. Taken together, our results suggest that developmental properties are polarised in the zygote. Because cleavage divisions partition the zygote in different ways, embryos differ from each other and so cannot all have a fixed relationship between lineage and fate.
Frequency of Asymmetric versus Symmetric Divisions and the Embryonic-Abembryonic Axis
Examination of the spatial and temporal patterns of symmetric and asymmetric divisions at the 8- to 16-cell- and 16- to 32-cell transitions also allowed us to address another question under current debate; does the embryonic-abembryonic axis become oriented at random or could its orientation be predicted by earlier developmental events? We found that the blastocyst cavity has a significant tendency to develop where symmetric divisions predominate. This might suggest that junctions between inner and outer cells are weaker adjacent to symmetrically dividing cells thus facilitating the cavity formation at that site. One possible explanation for this might be the absence of mid-bodies between inner and outer cells as a consequence of their division history (Plusa et al., 2005b). Interestingly, the formation of the cavity within a region of symmetric divisions was again particularly evident in ME embryos. Thus, it appears that positioning of the cavity, and so the orientation of embryonic-abembryonic axis is influenced by a pattern of earlier cell divisions.
What determines whether divisions are symmetric or asymmetric? One possibility is blastomere age or division order as suggested previously (Garbutt et al., 1987). However, our lineage tracing analysis did not reveal any significant correlation between cell cycle lengths or order of divisions and division orientation. Thus, how cell division orientation is determined remains unclear but the finding that vegetally-derived cells take preferentially symmetric divisions might help in future to shed light on this process.
Does Shape Influence Patterning?
The contemporaneous lineage study of Kurotaki et al (2007) suggests that the orientation of the embryonic-abembryonic axis develops in response to the shape of the zona pellucida. This contrasts with another recent study showing that the embryonic-abembryonic axis of the mouse blastocyst is pre-patterned and develops independently of the zona pellucida (Gardner, 2007). To address this discrepancy we analysed the embryos from our study using the approach of Kurotaki et al. (2007) by measuring the angle between the 2-cell boundary (2CB) and the embryonic-abembryonic axis. We confirm that the 2-cell embryo is oriented along the long axis of the zona in most (85%) cases. However, in only 35% of embryos was the angle between the 2CB and the embryonic-abembryonic axis more than 70°, in contrast to Kurotaki et al. (2007) who found this relationship in 64% of embryos. Thus, in embryos analysed in the present 4D lineage tracing study the zona pellucida does not appear to have a role in patterning.
This is not to say shape cannot influence patterning. It has been previously demonstrated by us and others that the shape of the embryo could influence development (Gray et al., 2004; Plusa et al., 2005a; Gardner and Davies, 2006). Thus, in experimentally elongated embryos, cells tend to divide through their short axis and hence, if indeed embryos were to adopt the shape of an considerably elongated zona, this might affect division orientation. The time-lapse studies we carried out here indicate that blastomeres were not significantly restrained by the zona from compaction up to cavitation; a gap of a few microns separated the cells from the zona. Thus, we cannot account for the response of the embryos to the zona shape in the study of Kurotaki et al. (2007). It should be noted, however, that Kurotaki et al. (2007) did not examine cell division orientations either at the early cleavage stages, with respect to the AV axis and each other, or at the later stages when asymmetric divisions separate inside from outside cells. In the absence of this information, any relationship between lineages and their division patterns and the orientation of the embryonic-abembryonic axis would be difficult to find.
Multiple Ways to Build a Blastocyst: Developmental Safeguards?
Our time-lapse studies indicate that there might be more than one way in which embryos develop into blastocysts. The embryonic/abembryonic pattern is seen in the significant majority of embryos but is not exclusive. This is perhaps unsurprising, given that mouse development is variable in other aspects. On the level of single cells pattern is not invariant, for example, clone#4 does not always arise from the same ‘progenitor/mother’ cell. Thus, as with the assembly of any complex structure, in some cases different construction techniques may be applied such that the end-point can be achieved by following different paths. It will be difficult to test whether patterned embryos have any developmental advantage over non-patterned, because this necessitates assessing the developmental success of different embryo-types in the same mother. However, embryos in which animal and vegetal parts are separated in both 2-cell blastomeres have significantly reduced viability (Pitorowska-Nitsche and Zernicka-Goetz, 2005) suggesting some “developmental routes” might be more favourable than others.
Embryos might take slightly different routes of development depending on how components of the zygote become partitioned through patterns of early cell divisions. Pattern can reflect lineage history in embryos partitioned in particular ways along the AV axis. This raises the possibility of specific components distributed along this axis that can influence development. In embryos undergoing other cleavage patterns, such components might be partitioned in a way that give rise to progeny with more mixed developmental properties. An ability to control differential gene expression in more than one way could reflect regulatory mechanisms in the embryo that ensure its normal development depending on which route it takes earlier on. Such redundant mechanisms are employed in biological systems to safeguard complex processes from environmental perturbations. The ability of the embryo to regulate might then mask the presence of early pattern. Indeed, the very act of experimental manipulation could bring a correction mechanism into play that triggers differential gene expression and forces development in a specific direction.
Even though there appears to be more than one way towards development of blastocyst, there is a considerable weight of evidence pointing to a relationship between how the embryo divides in relation to the AV axis and subsequent developmental processes. The knowledge that blastomeres inheriting different parts of the zygote differ is assisting our understanding. For example, it has permitted the discovery of the earliest epigenetic modification known to date important for cell pluripotency (Torres-Padilla et al., 2007, Hemberger and Dean, 2007). Hence, discovering the rules that govern the development of patterned embryos provides the potential for gaining greater appreciation of developmental mechanisms operating at this early stage of embryogenesis.
Supplementary Material
Acknowledgments
We are grateful to Martin Johnson, David Glover, Chris Graham, Peter Lawrence and Jonathon Pines for comments and to Kat Hadjantonakis and Ginny Papaioannou for the EGFP-H2B transgenic line. The work was supported by the Wellcome Trust Grant to MZG, MB is supported by the MRC UK, the DFG, Germany and a Wellcome Grant to Peter Lawrence to whom we are grateful for supporting MB’s contribution. DEP receives a MRC PhD studentship. MZG is a Wellcome Trust Senior Research Fellow.
Footnotes
This analysis assumes a null hypothesis in which any embryo would have an equal chance of falling into any of these three categories. We specifically chose to do this to exemplify a “worse case scenario”. It could be argued that the null hypothesis would predict each possible arrangement of 8-cell clones as equally likely and for the random (mixed) arrangement to vastly out-number the “patterned” and “half-half” embryos. In such a case the number of “patterned” embryos observed would have even greater significance.
References
- Alarcon VB, Marikawa Y. Deviation of the blastocyst axis from the first cleavage plane does not affect the quality of mouse postimplantation development. Biol Reprod. 2003;69:1208–12. doi: 10.1095/biolreprod.103.018283. [DOI] [PubMed] [Google Scholar]
- Barlow P, Owen DAJ, Graham CF. DNA synthesis in the preimplantation mouse embryo. J. Embryol. Exp. Morphol. 1972;27:431–435. [PubMed] [Google Scholar]
- Chroscicka A, Komorowski S, Maleszewski M. Both blastomeres of the mouse 2-cell embryo contribute to the embryonic portion of the blastocyst. Mol Reprod Dev. 2004;68:308–12. doi: 10.1002/mrd.20081. [DOI] [PubMed] [Google Scholar]
- Dietrich JE, Hiiragi T. Stochastic patterning in the mouse pre-implantation embryo. Development. 2007;134:4219–31. doi: 10.1242/dev.003798. [DOI] [PubMed] [Google Scholar]
- Fleming TP. A quantitative analysis of cell allocation to trophectoderm and inner cell mass in the mouse blastocyst. Dev Biol. 1987;119:520–31. doi: 10.1016/0012-1606(87)90055-8. [DOI] [PubMed] [Google Scholar]
- Fujimori T, Kurotaki Y, Miyazaki J, Nabeshima Y. Analysis of cell lineage in two- and four-cell mouse embryos. Development. 2003;130:5113–22. doi: 10.1242/dev.00725. [DOI] [PubMed] [Google Scholar]
- Garbutt CL, Johnson MH, George MA. When and how does cell division order influence cell allocation to the inner cell mass of the mouse blastocyst? Development. 1987;100:325–32. doi: 10.1242/dev.100.2.325. [DOI] [PubMed] [Google Scholar]
- Gardner RL. The early blastocyst is bilaterally symmetrical and its axis of symmetry is aligned with the animal-vegetal axis of the zygote in the mouse. Development. 1997;124:289–301. doi: 10.1242/dev.124.2.289. [DOI] [PubMed] [Google Scholar]
- Gardner RL. Specification of embryonic axes begins before cleavage in normal mouse development. Development. 2001;128:839–47. doi: 10.1242/dev.128.6.839. [DOI] [PubMed] [Google Scholar]
- Gardner RL. Experimental analysis of second cleavage in the mouse. Hum Reprod. 2002;17:3178–89. doi: 10.1093/humrep/17.12.3178. [DOI] [PubMed] [Google Scholar]
- Gardner RL. The axis of polarity of the mouse blastocyst is specified before blastulation and independently of the zona pellucida. Hum Reprod. 2007;22:798–806. doi: 10.1093/humrep/del424. [DOI] [PubMed] [Google Scholar]
- Gardner RL, Davies TJ. Trophectoderm growth and bilateral symmetry of the blastocyst in the mouse. Hum Reprod. 2006 Jul;17(7):1839–45. doi: 10.1093/humrep/17.7.1839. 2002. [DOI] [PubMed] [Google Scholar]
- Graham CF, Deussen ZA. Features of cell lineage in preimplantation mouse development. J Embryol Exp Morphol. 1978;48:53–72. [PubMed] [Google Scholar]
- Gray D, Plusa B, Piotrowska K, Na J, Tom B, Glover DM, Zernicka-Goetz M. First cleavage of the mouse embryo responds to change in egg shape at fertilization. Curr Biol. 2004;14:397–405. doi: 10.1016/j.cub.2004.02.031. [DOI] [PubMed] [Google Scholar]
- Hadjantonakis AK, Papaioannou VE. Dynamic in vivo imaging and cell tracking using a histone fluorescent protein fusion in mice. BMC Biotechnol. 2004;4:33. doi: 10.1186/1472-6750-4-33. [DOI] [PMC free article] [PubMed] [Google Scholar]
- Hemberger M, Dean W. Epigenetic arbitration of cell fate decisions: tipping the bias. Dev Cell. 2007;12:176–8. doi: 10.1016/j.devcel.2006.12.004. [DOI] [PubMed] [Google Scholar]
- Hiiragi T, Solter D. First cleavage plane of the mouse egg is not predetermined but defined by the topology of the two apposing pronuclei. Nature. 2004;430:360–4. doi: 10.1038/nature02595. [DOI] [PubMed] [Google Scholar]
- Johnson MH, Ziomek CA. The foundation of two distinct cell lineages within the mouse morula. Cell. 1981;24:71–80. doi: 10.1016/0092-8674(81)90502-x. [DOI] [PubMed] [Google Scholar]
- Kelly SJ. Studies of the developmental potential of 4- and 8-cell stage mouse blastomeres. J. Exp. Zool. 1978;200:365–376. doi: 10.1002/jez.1402000307. [DOI] [PubMed] [Google Scholar]
- Kelly SJ, Mulnard JG, Graham CF. Cell division and cell allocation in early mouse development. J Embryol Exp Morphol. 1978;48:37–51. [PubMed] [Google Scholar]
- Kurotaki Y, Hatta K, Nakao K, Nabeshima Y, Fujimori T. Blastocyst axis is specified independently of early cell lineage but aligns with the ZP shape. Science. 2007;316:719–23. doi: 10.1126/science.1138591. [DOI] [PubMed] [Google Scholar]
- Louvet-Vallee S, Vinot S, Maro B. Mitotic spindles and cleavage planes are oriented randomly in the two-cell mouse embryo. Curr Biol. 2005;15:464–9. doi: 10.1016/j.cub.2004.12.078. [DOI] [PubMed] [Google Scholar]
- Motosugi N, Bauer T, Polanski Z, Solter D, Hiiragi T. Polarity of the mouse embryo is established at blastocyst and is not prepatterned. Genes Dev. 2005;19:1081–92. doi: 10.1101/gad.1304805. [DOI] [PMC free article] [PubMed] [Google Scholar]
- Piotrowska K, Wianny F, Pedersen RA, Zernicka-Goetz M. Blastomeres arising from the first cleavage division have distinguishable fates in normal mouse development. Development. 2001;128:3739–48. doi: 10.1242/dev.128.19.3739. [DOI] [PubMed] [Google Scholar]
- Piotrowska K, Zernicka-Goetz M. Role for sperm in spatial patterning of the early mouse embryo. Nature. 2001;409:517–21. doi: 10.1038/35054069. [DOI] [PubMed] [Google Scholar]
- Piotrowska-Nitsche K, Perea-Gomez A, Haraguchi S, Zernicka-Goetz M. Four-cell stage mouse blastomeres have different developmental properties. Development. 2005;132:479–90. doi: 10.1242/dev.01602. [DOI] [PubMed] [Google Scholar]
- Piotrowska-Nitsche K, Zernicka-Goetz M. Spatial arrangement of individual 4-cell stage blastomeres and the order in which they are generated correlate with blastocyst pattern in the mouse embryo. Mech Dev. 2005;122:487–500. doi: 10.1016/j.mod.2004.11.014. [DOI] [PubMed] [Google Scholar]
- Plusa B, Hadjantonakis AK, Gray D, Piotrowska-Nitsche K, Jedrusik A, Papaioannou VE, Glover DM, Zernicka-Goetz M. The first cleavage of the mouse zygote predicts the blastocyst axis. Nature. 2005a;434:391–5. doi: 10.1038/nature03388. [DOI] [PubMed] [Google Scholar]
- Plusa B, Frankenberg S, Chalmers A, Hadjantonakis AK, Moore CA, Papalopulu N, Papaioannou VE, Glover DM, Zernicka-Goetz M. Downregulation of Par3 and aPKC function directs cells towards the ICM in the preimplantation mouse embryo. J Cell Sci. 2005b;118:505–15. doi: 10.1242/jcs.01666. [DOI] [PubMed] [Google Scholar]
- Schnabel R, Hutter H, Moerman D, Schnabel H. Assessing normal embryogenesis in Caenorhabditis elegans using a 4D microscope: variability of development and regional specification. Dev Biol. 1997;184:234–65. doi: 10.1006/dbio.1997.8509. [DOI] [PubMed] [Google Scholar]
- Surani MA, Barton SC. Spatial distribution of blastomeres is dependent on cell division order and interactions in mouse morulae. Dev Biol. 1984;102:335–43. doi: 10.1016/0012-1606(84)90198-2. [DOI] [PubMed] [Google Scholar]
- Torres-Padilla ME, Parfitt DE, Kouzarides T, Zernicka-Goetz M. Histone arginine methylation regulates pluripotency in the early mouse embryo. Nature. 2007;445:214–8. doi: 10.1038/nature05458. [DOI] [PMC free article] [PubMed] [Google Scholar]
- Zernicka-Goetz M. The first cell-fate decisions in the mouse embryo: destiny is a matter of both chance and choice. Curr Opin Genet Dev. 2006;16:406–12. doi: 10.1016/j.gde.2006.06.011. [DOI] [PubMed] [Google Scholar]
Associated Data
This section collects any data citations, data availability statements, or supplementary materials included in this article.