Abstract
We identified regions inside the proximal femur that are most strongly associated with hip fracture. Bone densitometry based on such fracture-critical regions showed improved power in discriminating fracture patients from controls.
Introduction
Hip fractures typically occur in lateral falls, with focal mechanical failure of the sub-volumes of tissue in which the applied stress exceeds the strength. In this study, we describe a new methodology to identify proximal femoral tissue elements with highest association with hip fracture. We hypothesize that bone mineral density (BMD) measured in such sub-volumes discriminates hip fracture risk better than BMD in standard anatomic regions such as the femoral neck and trochanter.
Materials and Methods
We employed inter-subject registration to transform hip QCT images of 37 patients with hip fractures and 38 age-matched controls into a voxel-based statistical atlas. Within voxels, we performed t-tests between the two groups to identify the regions which differed most. We then randomly divided the 75 scans into a training set and a test set. From the training set, we derived a fracture-driven region of interest (ROI) based on association with fracture. In the test set, we measured BMD in this ROI to determine fracture discrimination efficacy using ROC analysis. Additionally, we compared the BMD distribution differences between the 29 patients with neck fractures and the 8 patients with trochanteric fractures.
Results
By evaluating fracture discrimination power based on ROC analysis, the fracture-driven ROI had an AUC (area under curve) of 0.92, while anatomic ROIs (including the entire proximal femur, the femoral neck, trochanter and their cortical and trabecular compartments) had AUC values between 0.78 and 0.87. We also observed that the neck fracture patients had lower BMD (p=0.014) in a small region near the femoral neck and the femoral head, and patients with trochanteric fractures had lower BMD in trochanteric regions such as in the internal calcar septum (p=0.006).
Conclusions
We have identified the sub-volumes of proximal femoral tissue which have the strongest association with hip fracture. The power to predict fracture can be improved, by focusing on BMD measurements in the fracture-critical regions, rather than in standard ROIs.
Keywords: osteoporosis, proximal femur, QCT, image registration, statistical parametric mapping
Introduction
Hip fracture is the most serious clinical outcome associated with osteoporosis in the elderly[7, 23]. In aging, there is a lower rate of bone loss in primary load-bearing regions such as the inferior femoral neck cortex and the principal load bearing trabecular bands. On the other hand, regions that receive much lower load-bearing stimulus, such as the superior aspect of the femoral neck, can undergo substantial bone loss and cortex thinning[22]. Hip fractures often occur in lateral falls[13]. The impact forces during a fall differ greatly from the mechanical loading in daily activities. The atrophied proximal femoral regions, unfortunately, may play critical roles in hip fracture. For example, the compressive yielding in the superior aspect of the femoral neck is expected to initiate fracture in sideway falls[8, 22]. In this sense, the regions of the hip which are most at risk for fall-related structural failure are those which receive the least adaptive protection through mechanical loading in the activities of daily life. Bone mineral density (BMD) measurements such as dual x-ray absorptiometry (DXA)[24] or volumetric quantitative computed tomography (vQCT)[6] evaluate regions of interest that are defined with respect to identifiable anatomic landmarks[2-4, 9, 19]. Regions such as the femoral neck, integrate the superior and inferior cortex, although the former may be more sensitive as a fracture risk estimator[5]. Although manufacturers have subdivided the DXA femoral neck region of interest into superior and inferior halves, the selection of these regions is based on sub-division of an existing ROI rather than on choosing a region which is specifically optimized for fracture risk estimation.
In this study, we have sought to develop and test a technique to identify a proximal femoral region of interest comprising elements of bone tissue with BMD values maximally associated with hip fracture risk. To achieve this, we have retrospectively analyzed a cohort of Chinese women described in two previous publications[9, 18] which contained a group of women imaged with QCT within 48 hours of an osteoporotic hip fracture and a group of locally recruited age-matched controls. To generate the region of interest, we followed a statistical parametric mapping (SPM) approach[14]. We utilized a previously-described inter-subject image registration program[20] to generate a voxel-based statistical atlas comprising all of the scans in the cohort, using one half of the cohort to identify the region and the other half to independently test it. To demonstrate the efficacy of this new region of interest, we compared its discriminatory power to BMD measured in standard anatomic regions quantified by our QCT analysis. Additionally, we also applied our atlas technique to compare patients with neck fractures and trochanteric fractures to identify their differences in bone mineral distribution.
Materials and Methods
Study subjects
Thirty-seven women with fractures of the hip aged 65 or older (weight: 58.7±10.8kg, height: 159.1± 5.05 cm, body mass index 23.1±3.93 kg/m2) were recruited from the emergency room, Department of Traumatology and Orthopedic Surgery, Beijing Ji Shui Tan hospital. In order to minimize changes in BMD and body composition factors due to the fracture, only those subjects whose fractures had occurred within the last 48 hours were accepted into the study. Potential hip fracture subjects were referred to the emergency room CT scanning service and to the study by their orthopaedic surgeons. If the patient was female and over 65 years old, then the radiologist explained the study to the subject and asked the subject if she was willing to participate in the study. If the subject agreed to participate, she was asked to sign the consent form, fill out a questionnaire about the circumstances of fall and other information regarding skeletal and other health conditions. Subjects were included in the study if they had experienced a hip fracture which resulted from a low-energy fall from standing or sitting height, and prior to the fracture, were fully ambulatory, community-dwelling adults. Subjects were excluded from the study if they reported having the following medical conditions: previous fracture, history of metastatic disease, hyper- or hypoparathryroidism, Cushing's syndrome, diabetes or collagenosis. Subjects were excluded from the study if they had undergone treatment with corticosteroids or osteoporosis medications including hormone replacement therapy or bisphosponates. All scanning of fractured subjects was carried out prior to fixation of the fracture. In addition to these subjects, thirty-eight women over 65 years old in good health (weight: 62.2±10.2kg, height: 157.7±5.23 cm, body mass index 25.0±3.70 kg/m2) and with no conditions affecting bone metabolism (established from the same questionnaire) were invited from the surrounding community to participate in the study. The healthy controls contacted the hospital in response to informational briefings held at two local senior community centers. If they fit the inclusion and exclusion criteria of the study, they were invited to participate in the study and upon their arrival at the hospital, provided informed consent. The study was reviewed and approved by the Internal Review Boards of the Beijing Ji Shui Tan hospital and the University of California, San Francisco. Informed Consents were obtained for all study participants.
vQCT acqusitions
All QCT acquisitions utilized a GE CT Pro FII CT scanner (GE Medical Systems, Beijing, China). Subjects were positioned supine on the CT table. An Image Analysis QCT calibration phantom (Image Analysis, Columbia KY, USA) was placed under the subject between the hips. The superior aspect of the helical scan was 5 mm above the acetabulum and the inferior limit 5 mm below the lesser trochanter. Scan parameters were 3 mm section thickness (pitch = 1), 120 kVp, 200 mAs, with an in-plane pixel size of 0.84 mm. The CT images were archived to DICOM CD and forwarded to University of California, San Francisco for analysis.
For control subjects, the left hip was analyzed. For subjects with hip fractures, the software analyzed the contralateral unfractured hip. When a right hip was analyzed, a left-right flipping of the image was performed first.
Hip inter-subject registration
Inter-subject registration allows direct comparison of bone mineral densities at homologous locations from difference scans. Although the methodology has been described previously[20], it can be briefly summarized as follows. An illustration of inter-subject image registration is shown in Fig. 1. The two images to be co-registered are the target image and the source image. After the source scan is registered toward the target scan, it is resampled to create a new image with the same dimensions as the target scan. As shown in Fig. 1, to determine the grayscale value at each voxel of the resampled image, for instance (i, j, k), the transformation derived from the registration is applied to calculate its homologous location, (x, y, z), in the original source scan. The BMD value at (x, y, z) will then be used as the BMD value at (i, j,k) in the resampled image. In this process, the BMD in the resampled image is not alternated from the BMD in the original source image, unless the calculated (x, y, z) are non-integers (in this case we used tri-linear interpolation to derive the BMD value at (x, y, z)). Once the BMD value at (i, j,k) in the resampled image is obtained, it can be compared with the BMD at (i, j,k) in the target scan. This provides us an approach to compare the BMD values of two scans at the homologous locations, such as the tip of the lesser trochanter, as shown in this illustration.
Fig. 1.
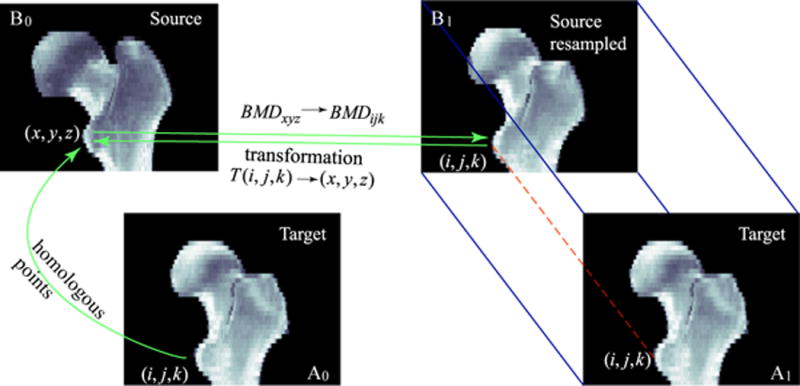
Registration establishes geometric correspondence between homologous locations in the target (A0) and the source (B0) scans. The registered image (B1) is a resampled image of the source image (B0). It has the same dimensions as the target image A1 (A1 is duplicated from A0 for illustration clarity). For each voxel in B1, the grayscale BMD value is taken from the corresponding location (determined by results from registration) in the original source image B0. Notice that during the resampling, in the resampled image, the BMD value is not changed from the corresponding BMD value in the original source image, unless the mapping points to a location in the source image that has non-integer coordinates. For such a case, tri-linear interpolation is applied to calculate the BMD value.
In this study, one scan was randomly selected to serve as the reference (target) scan (for this particular study, it was one scan from the control group). All other scans, from fracture patients and controls, were registered to this reference. The registration, as described in Ref. [20], was divided into two steps: rigid and non-rigid registration.
Rigid registration
We applied a rigid registration technique that we previously developed[21] to automatically align hip QCT scans. The rigid transformation includes 3 translations and 3 rotations. The algorithm is based on maximizing normalized mutual information[27], using simplex optimization under a multi-resolution scheme[21].
Non-rigid registration
We adapted a non-rigid registration technique originally developed for registering volumetric brain MRI images at the Montreal Neurological Institute[10-12]. This automatic non-rigid registration algorithm estimates local rigid transformations to achieve global non-rigid registration. The adapted non-rigid registration algorithm and validation for hip QCT images were previously described in Ref. [20].
Voxel-by-voxel statistical comparison between fracture patients and controls, and between patients with neck fractures and trochanteric fractures
After all the scans were registered toward the reference scan, the scans of fracture and control subjects were compared in the common hip space. For each voxel, we performed a two-sample Student's t-test to obtain a t-statistic quantifying bone mineral density differences between fracture patients and controls (or between patients with neck fractures and trochanteric fractures). A higher t-statistic indicates a more detectable difference between the two groups at that voxel. Combining the results of the statistical tests across all voxels resulted in a 3D t-statistic map.
Hip fracture discrimination based on the fracture-driven ROI, and comparison against anatomic ROIs
To test our hypothesis that fracture-critical regions can be used to improve hip fracture risk prediction, we randomly partitioned the 75 scans (38 controls and 37 fractures) into two sets, one for deriving the fracture-driven ROI (the training set) and the other for performing independent fracture discrimination testing (the test set). The random partitioning was performed in a stratified way so that the training set had 19 controls and 19 fractures, and the remainder formed the test set.
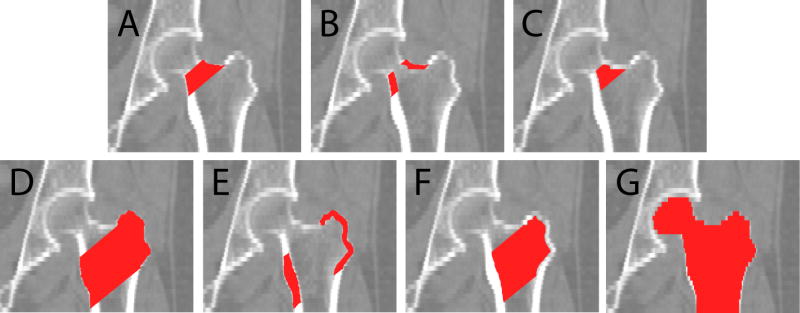
After the voxel-by-voxel t-tests for scans from the training set, for each voxel, we checked the statistical significance of BMD difference between the fracture patients and controls based on p-values. Due to the large amount of tests performed (one t-test for each voxel), we used false discovery rate (FDR) to provide correction for multiple comparisons [20]. FDR analysis controls the proportion of false positives among the declared positives, i.e., voxels showing statistical significance from t-tests. In our case this proportion was set to be no more than 5%. Since FDR analysis showed statistical significance for almost all voxels inside the bone, to limit the number of voxels, we applied a t-statistic threshold of 3.0 in order to select approximately ten percent of voxels inside the proximal femur. Any voxels that had t-statistics above the threshold were selected to define the fracture-driven region of interest, which we refer to as the F-ROI. When applying the F-ROI to the scans from the test set, the F-ROI was mapped directly to the transformed test scans since they were all in the same common hip space. For scans in the test set, the average BMD in each subject's F-ROI was calculated, and was used to try to discriminate fracture patients from controls. To evaluate the discriminatory power of the F-ROI, we carried out empirical receiver operating characteristic (ROC) analysis. We also compared the discriminatory efficacy of the F-ROI against several other commonly used anatomic ROIs, including the entire proximal femur, the femoral neck and the trochanter and their cortical and trabecular compartments, as illustrated in Fig. 2. The neck and trochanter ROIs were defined as described in [19]. The entire proximal femur ROI, instead, was the manually drawn contour of the proximal femur. We calculated the BMDs in those anatomic ROIs (after all the images were registered to the common hip space), and used them for fracture discrimination as we did using the F-ROI.
Fig. 2.
Anatomic regions of interest. (A)-(C) are the neck integral, neck cortical and neck trabecular ROIs, respectively. (D)-(F) are the trochanter integral, cortical and trabecular ROIs, respectively. (G) is referred to as the “entire femur” in this paper.
Results
BMD differences between fracture patients and controls
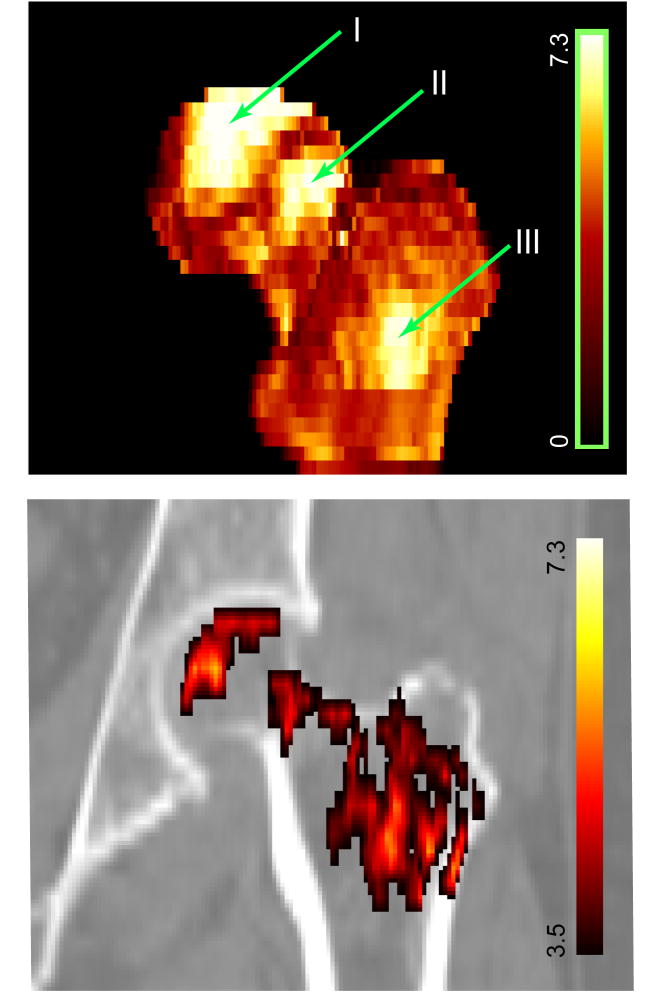
The regional variation of bone mineral differences between the fracture patients and the controls, as represented by the t-statistic map, is shown in Fig. 3. The bone mineral differences were not uniformly distributed, instead, the main differences were primarily localized in three sub-regions, as marked by I, II and III, inside the femoral head, the femoral neck and the trochanter, respectively. Fig. 3 also shows a coronal section of the t-statistic map.
Fig. 3.
Top: t-statistic map illustrates regional bone mineral differences between 37 fracture patients and 38 controls. This is a 3D surface rendering. Bottom: One coronal section of the t-statistic map overlayed on the QCT image, where voxels with low t-statistics (lower than 3.5) are not displayed in order to focus more on the regions with higher t-values.
Hip fracture discrimination based on BMD of the fracture-driven region of interest
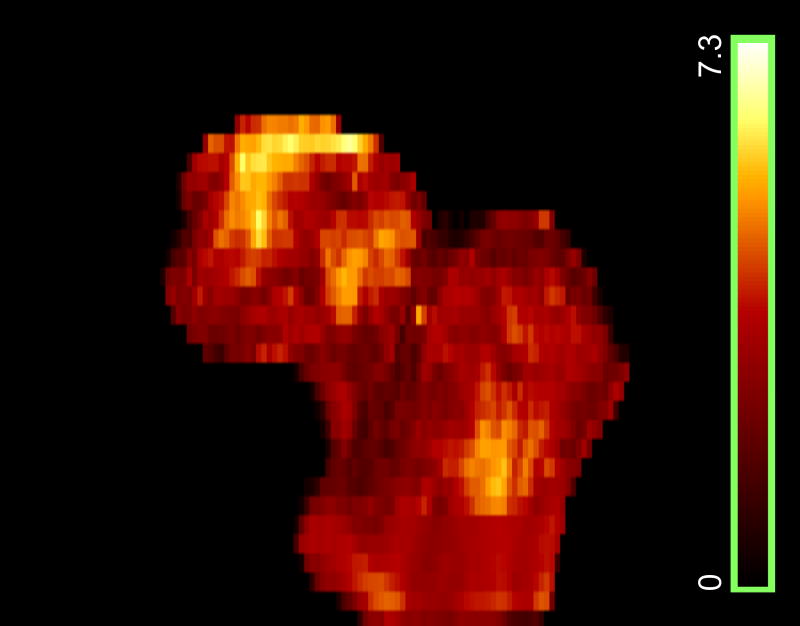
Based on the scans from the training set, we derived the t-statistic map, as shown in Fig. 4. It differs, as expected, from the t-statistic map shown in Fig. 3, since only half of the total 75 subjects were used to form the training set. Based on the p-values of the t-tests, the FDR analysis with a q-value of 0.05 showed that almost all voxels inside the proximal femur had statistically significant BMD differences between the fracture patients and the controls (not shown). We then selected the sub-regions from the t-statistic map with t-values over a threshold of 3.0 to form the F-ROI. Fig. 5 shows one coronal section of such sub-regions overlayed on the QCT image. The BMD in such sub-regions was used to discriminate hip fracture for the scans from the test set.
Fig. 4.
t-statistic map (3D surface rendering) derived with scans from the training set (19 fracture patients and 19 controls).
Fig. 5.
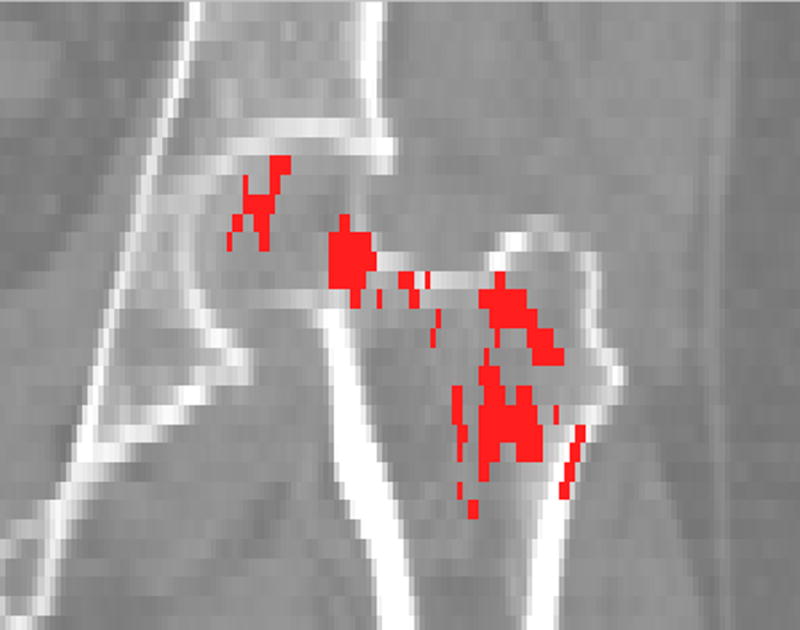
Fracture-driven region of interest (F-ROI), derived from the training set scans, overlaid on the QCT scan (a coronal section).
To evaluate fracture discriminatory power using BMD in the F-ROI, we carried out ROC analysis, and compared the performance against conventional methods based on BMDs measured in anatomic ROIs. As examples, two ROC curves are shown in Fig. 6. We calculated the AUC (area under curve) for each ROI, as tabulated in Table 1. The AUC for the F-ROI, 0.92, was higher than for any of the AUC values of the anatomic ROIs, which ranged between 0.78 and 0.87. We also calculated the specificities at the fixed sensitivity of 95% (i.e., the rate that the fracture patients were not detected by the test was 5%). The F-ROI showed a higher specificity at this fixed sensitivity than anatomic ROIs, with statistical significance observed for ROIs including the integral, trabecular neck ROIs, the integral, cortical trochanter ROIs, and the entire proximal femur.
Fig. 6.
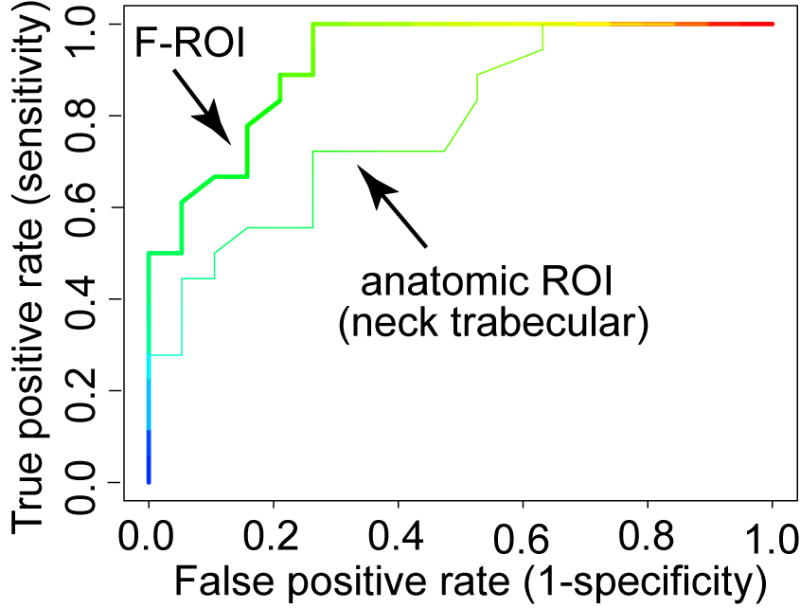
ROC curves. A ROC curve shows the true positive rate (sensitivity) versus false positive rate (1-specificity) over a range of cut-off values. The area under each curve, i.e., the AUC value, provides a measure of diagnostic accuracy when using the particular ROI for fracture prediction purposes. In this figure, for clarity, only the two most extreme ROC curves are shown.
Table 1.
Comparing the F-ROI with anatomic ROIs in hip fracture discrimination based on BMD measurements. Anatomic ROIs included the integral (intgl), cortical (cort) and trabecular (trab) compartments of the femoral neck (neck) and the trochanter (troc). The entire proximal femur (including femoral head, femoral neck and trochanter) was also evaluated. The AUC value and its standard error for each ROC curve is shown in the middle row. For each ROC curve, the specificity at the fixed sensitivity of 95% was calculated and compared with that of the F-ROI. A mark * indicates the difference was statistically significant.
| neck intgl | neck cort | neck trab | troc intgl | troc cort | troc trab | entire femur | F-ROI | |
|---|---|---|---|---|---|---|---|---|
| AUC
(±standard error) |
0.871
(±0.059) |
0.849
(±0.062) |
0.782
(±0.075) |
0.849
(±0.062) |
0.820
(±0.069) |
0.849
(±0.062) |
0.868
(±0.060) |
0.921
(±0.042) |
| specificity at 95% sensitivity
(p-value: compare with F-ROI) |
0.311*
(0.013) |
0.421
(0.077) |
0.368*
(0.023) |
0.316*
(0.013) |
0.263*
(0.008) |
0.626
(0.480) |
0.358*
(0.023) |
0.737
(--) |
Comparing neck fracture and trochanteric fracture
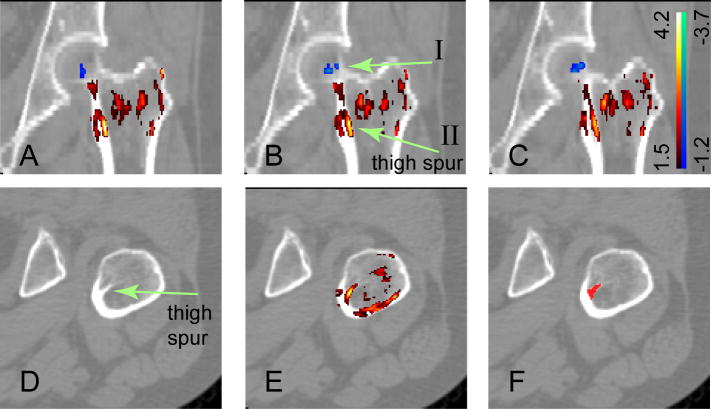
We also compared the QCT scans of the 29 patients with neck fractures against the 8 patients with trochanteric fractures. As shown in Table 2, the patients with trochanteric fractures had lower average femoral neck BMD and trochanter BMD. However, neither of these two BMD differences was statistically significant (with p-values of 0.661 and 0.649, respectively). We then performed SPM comparisons between the two types of fractures. In Fig. 7 (A), (B), (C), three consecutive coronal sections are shown with the t-statistic map overlaid on the CT images. The positive t-statistics (in warm red-yellow colors) indicate regions where the BMDs are higher for neck fracture patients, while the negative t-values (in cold bluish colors) indicate regions where the BMDs are lower for neck fracture patients. Fig. 7 shows that for most of the regions, the patients with trochanteric fractures had lower BMDs. However, in the small bluish region near the femoral neck and the femoral head (pointed at by arrow I in Fig. 7B), the patients with neck fractures had lower BMDs. We calculated the BMD in this blue region. The results in Table 2 show that, the patients with neck fractures had lower BMD in this region of interest compared to patients with trochanteric fractures (p-value = 0.014). In Fig. 7, most parts of the trochanter show positive t-statistics (warm yellowish colors), such as in the bright yellowish region (as pointed at by arrow II), which corresponds to the internal calcar septum (“thigh spur”)[1]. To better illustrate this structure, one of the QCT sections in the axial view is shown in Fig. 7 (D). In Fig. 7 (E), the t-statistic map is further overlaid. We segmented the internal calcar septum, as shown in (F), and calculated the BMDs in this region for the patients. As shown in Table 2, the patients with trochanteric fractures had lower internal calcar septum BMD compared to patients with neck fractures (p = 0.006).
Table 2.
Comparing BMD differences between 29 patients with neck fractures and 8 patients with trochanteric fractures. For patients with trochanteric fractures, the average BMDs in the femoral neck and the trochanter were both lower. However, neither differed significantly (with p-values of 0.661 and 0.649, respectively). From the SPM-based comparison, we selected two sub-regions, one near the femoral neck and the femoral head (ROI I, as indicated by arrow I in Fig. 7B), and the other in the internal calcar septum (ROI II, as indicated by arrow II in Fig. 7B). The average BMDs in these two regions were calculated, and the differences between the two fracture types were statistically significant (with p-values of 0.014 and 0.006, respectively).
| average BMD (g/cm3)
(neck fracture) |
average BMD (g/cm3)
(troch. fracture) |
p-value | |
|---|---|---|---|
| neck | 0.196 | 0.183 | 0.661 |
| trochanter | 0.170 | 0.156 | 0.649 |
|
| |||
| ROI I (a region near the neck/head) | 0.072 | 0.101 | 0.014 |
| ROI II (internal calcar septum) | 0.516 | 0.409 | 0.006 |
Fig. 7.
Bone mineral differences between patients with neck fractures and trochanteric fractures (this figure is best viewed in color). The upper panel shows three consecutive coronal QCT sections overlaid by the corresponding t-statistic map. The t-statistics ranged from -3.7 to 4.2. For clarity, voxels with t-statistics close to zero (-1.2 to 1.5) are not shown. In the small bluish regions (indicated by arrow I), the patients with neck fractures had lower BMD values. In the red-yellow regions, the patients with trochanteric fractures had lower BMD values. In particular, the bright yellowish region, as indicated by arrow II in (B), corresponds to the internal calcar septum, or “thigh spur”. To better illustrate the thigh spur structure, one section in the axial view is shown in the bottom panel. (D) is the QCT image. (E) has the t-statistic map overlaid. (F) highlights the segmented thigh spur.
Computer execution time
For our image analysis, we used a Dell workstation with a Pentium 4 processor, 2.4 Ghz CPU and 1.5Gb RAM. For image registration, the average CPU time for registering a hip pair was 2.3 minutes for rigid registration, and 14.9 minutes for non-rigid registration. The time used for atlas analysis to identify the fracture-critical regions and to apply them for hip fracture discrimination was approximately one hour.
Discussion
We have applied inter-subject image registration and statistical atlas analysis to identify regions of tissue comprised of clusters of voxels that are individually associated with hip fracture. The results support the idea that the regions of tissue at high risk of fracture correspond to those regions that are less stimulated mechanically during normal load bearing. This can be seen, for example, in the femoral neck region in Fig. 3, where the voxels with high t-statistics are mainly concentrated in the superior aspect of the neck, a region which is relatively unstimulated by routine mechanical loading[22]. By splitting our cohort into two independent sets, a training set and a test set, we have also showed that BMD measurement based on the fracture-driven regions tended to show higher power to discriminate hip fracture. By focusing bone densitometric measurement in such fracture- driven regions, our methods may lead to a higher standard in clinical fracture risk prediction and drug efficacy monitoring.
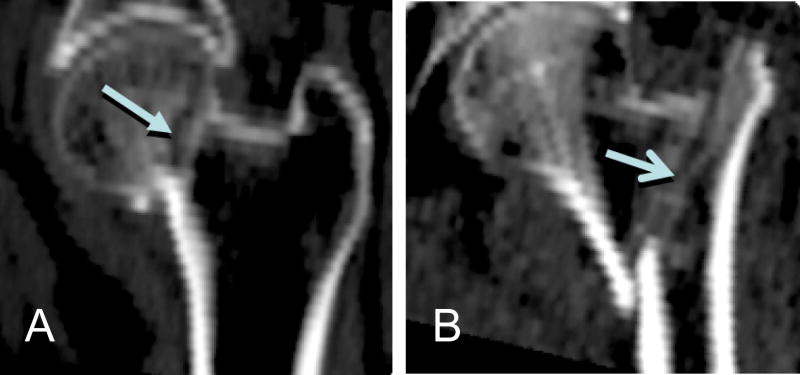
In our voxel-based models, the highest t-statistics are localized mainly in three sub-regions inside the femoral head, the femoral neck, and the trochanter. The femoral neck and the trochanter are the locations of the two typical hip fracture types, i.e., neck fracture and trochanteric fracture. Fig. 8 shows sample QCT images of fractured hips. Qualitatively, the spatial distribution of t-statistics showed distinct clustering at clinically-observed femoral neck and trochanteric fracture sites. Interestingly, the femoral head, although not a fracture site, appears to show patterns that associate with hip fracture risk. In our earlier application of the SPM analysis method to study proximal femoral bone loss associated with long-duration spaceflight[20], it was observed that the accelerated bone loss also occurred in the femoral head. These observations may indicate the value of including a femoral head region in QCT densitometry analysis. Currently the femoral head is often ignored in densitometry analysis [2-4, 9, 19] since the femoral head is difficult to be segmented due to the narrow spacing between the femoral head and the acetabulum[15].
Fig. 8.
Sample QCT images (coronal sections) from patients with hip fractures. (A): neck fracture. (B): trochanteric fracture. Arrows point to the fracture sites.
The results of our study also support the idea that the spatial distribution of tissue at high risk for fracture may vary as a function of fracture type. When we carried out a statistical analysis to delineate voxels differing between subjects with trochanteric and femoral neck fractures, we observed that BMD measured in the cluster of voxels in ROI I (Fig. 7B) near the femoral neck was significantly lower in subjects with femoral neck fractures, where ROI I corresponds roughly to the clinical neck fracture site as shown in Fig. 8A. BMD measured in the trochanteric cluster of voxels, particularly in ROI II (Fig. 7B), was lower in the subjects with trochanteric fractures. Such trochanteric voxels also correspond roughly to the clinical trochanteric fracture site as shown in Fig. 8B. While this finding should be interpreted with caution due to small sample size (n=8 subjects with trochanteric fractures), it does provide support for the overall biologic plausibility of our approach.
For this fracture study, the voxel selection criteria for the fracture-driven region of interest (F-ROI) differed from the spaceflight study[20] in that FDR analysis could not be employed. In this study, almost all voxels inside the proximal femur showed statistical significance in BMD difference between the fracture patients and the controls. In order to limit the number of voxels, we applied a t-statistic threshold of 3.0 to select approximately ten percent of voxels inside the proximal femur. We also tested different t-statistic thresholds to select more voxels (t=2.0, 2.5) and less voxels (t=3.5, 4.0) to define the F-ROI, and no improvement of fracture prediction was observed. We are currently developing a more sophisticated method based on a permutation cluster test[28] to optimize the threshold determination and to take into account other factors such as voxel cluster size.
Our inter-subject registration approach provides information which may enhance that provided by finite element modeling (FEM) [17]. FEM utilizes the bone mineral density distribution from the CT scan to estimate the bone material properties. In conjunction with approximations of the applied load, the FEM technique estimates the whole bone strength and the spatial distribution of stress and strain. Our methodology may be used to statistically analyze the images generated by the FEM process. For example, this technique may be applied to an FEM analysis of a pharmacologic intervention, thus shedding light on how the treatment affects the spatial distributions of stress and strain.
In this study, we selected hip fracture to develop and test our methods. Hip fracture accounts for 14% of the total incident fractures, and 72% of the total cost [7]. Our technique is easily applicable to vertebrae and to other skeletal sites (such as forearm and tibia). And we expect similar results can be observed, i.e., the regional BMD correlation to bone fracture is not uniformly distributed inside the vertebrae and other skeletal sites. Our techniques can also be generalized to other imaging modalities, such as magnetic resonance imaging (MRI).
The fundamental limitation of this overall approach is that registration inevitably introduces errors due to mis-registration and data interpolation during image transformation. Such registration errors can result in the loss of structural detail. Despite this, our image registration approach produces images of sufficient quality to three-dimensionally compare bone images from different subjects. Image registration, particularly non-rigid registration, has been a rapidly developing technique in medical image processing. With higher imaging resolution and optimized registration techniques, the effect of registration induced errors is likely to diminish.
Although currently osteoporosis diagnosis and treatment decisions are largely based on bone mineral density, and we expect our technique described in this paper to improve such decisions, it is worth pointing out that BMD alone can not satisfactorily identify subjects at high risk of fracture [25, 26]. In 2008, the World Health Organization (WHO) introduced a new fracture risk assessment tool, the FRAX [16], which integrates other clinical risk factors such as age, gender, prior/parental fracture history, smoking status and alcohol use, etc.. Such clinical risk factors should be taken into account when our technique described in this paper is used clinically in order to achieve the best fracture risk diagnosis.
In summary, we have identified regions inside the proximal femur that show the strongest association with hip fracture, and have demonstrated that bone mineral density measurement based on such regions can improve the power to discriminate between hip fracture and control subjects. Our voxel-based SPM analysis has also illustrated differences in BMD distribution between patients with neck fracture as opposed to trochanteric fracture. We will continue to study these fracture-critical regions and their ability to predict hip fracture in a prospective manner, and to characterize fracture-related features associated with ethnic, gender, age differences, as well as to characterize changes due to disease, pharmacologic interventions, and exercises. Our methods may also be used in conjunction with some functional measurements, such as bone turnover markers, to understand the possible correlation between such functional measurements and the 3D bone mineralization behavior.
Acknowledgments
This study was supported by NASA Grant NNJ04HF78G and NIH grant NIH-R42-AR45713.
Footnotes
Publisher's Disclaimer: This is a PDF file of an unedited manuscript that has been accepted for publication. As a service to our customers we are providing this early version of the manuscript. The manuscript will undergo copyediting, typesetting, and review of the resulting proof before it is published in its final citable form. Please note that during the production process errors may be discovered which could affect the content, and all legal disclaimers that apply to the journal pertain.
References
- 1.Adam F, Hammer DS, Pape D, Kohn D. The internal calcar septum (femoral thigh spur) in computed tomography and conventional radiography. Skeletal Radiology. 2001;30:77–83. doi: 10.1007/s002560000308. [DOI] [PubMed] [Google Scholar]
- 2.Black DM, Bilezikian JP, Ensrud KE, Greenspan SL, Palermo L, Hue T, Lang TF, McGowan JA, Rosen CJ. One year of alendronate after one year of parathyroid hormone (1-84) for osteoporosis. N Engl J Med. 2005;353:555–65. doi: 10.1056/NEJMoa050336. [DOI] [PubMed] [Google Scholar]
- 3.Black DM, Delmas PD, Eastell R, Reid IR, Boonen S, Cauley JA, Cosman F, Lakatos P, Leung PC, Man Z, Mautalen C, Mesenbrink P, Hu HL, Caminis J, Tong K, Rosario-Jansen T, Krasnow J, Hue TF, Sellmeyer D, Eriksen EF, Cummings SR. Once-yearly zoledronic acid for treatment of postmenopausal osteoporosis. N Engl J Med. 2007;356:1809–1822. doi: 10.1056/NEJMoa067312. [DOI] [PubMed] [Google Scholar]
- 4.Black DM, Greenspan SL, Ensrud KE, Palermo L, McGowan JA, Lang TF, Garnero P, Bouxsein ML, Bilezikian JP, Rosen CJ. The effects of parathyroid hormone and alendronate alone or in combination in postmenopausal osteoporosis. N Engl J Med. 2003;349:1207–15. doi: 10.1056/NEJMoa031975. [DOI] [PubMed] [Google Scholar]
- 5.Boehm HF, Eckstein F, Wunderer C, Kuhn V, Lochmueller EM, Schreiber K, Mueller D, Rummeny EJ, Link TM. Improved performance of hip DXA using a novel region of interest in the upper part of the femoral neck: in vitro study using bone strength as a standard of reference. J Clin Densitom. 2005;8:488–94. doi: 10.1385/jcd:8:4:488. [DOI] [PubMed] [Google Scholar]
- 6.Brenner D, Hall E. Current concepts - Computed tomography - An increasing source of radiation exposure. N Engl J Med. 2007;357:2277–2284. doi: 10.1056/NEJMra072149. [DOI] [PubMed] [Google Scholar]
- 7.Burge R, Dawson-Hughes B, Solomon DH, Wong JB, King A, Tosteson A. Incidence and economic burden of osteoporosis-related fractures in the United States, 2005-2025. J Bone Miner Res. 2007;22:465–75. doi: 10.1359/jbmr.061113. [DOI] [PubMed] [Google Scholar]
- 8.Carpenter RD, Beaupre GS, Lang TF, Orwoll ES, Carter DR. New QCT analysis approach shows the importance of fall orientation on femoral neck strength. Journal of Bone and Mineral Research. 2005;20:1533–1542. doi: 10.1359/JBMR.050510. [DOI] [PubMed] [Google Scholar]
- 9.Cheng X, Li J, Lu Y, Keyak J, Lang T. Proximal femoral density and geometry measurements by quantitative computed tomography: Association with hip fracture. Bone. 2007;40:169–174. doi: 10.1016/j.bone.2006.06.018. [DOI] [PubMed] [Google Scholar]
- 10.Collins DL, Evans AC. Animal: Validation and applications of nonlinear registration-based segmentation. International Journal of Pattern Recognition and Artificial Intelligence. 1997;11:1271–1294. [Google Scholar]
- 11.Collins DL, Holmes CJ, Peters TM, Evans AC. Automatic 3-D model-based neuroanatomical segmentation. Human Brain Mapping. 1995;3:190–208. [Google Scholar]
- 12.Collins DL, Neelin P, Peters TM, Evans AC. Automatic 3D Intersubject Registration of Mr Volumetric Data in Standardized Talairach Space. Journal of Computer Assisted Tomography. 1994;18:192–205. [PubMed] [Google Scholar]
- 13.Cummings SR, Nevitt MC, Browner WS, Stone K, Fox KM, Ensrud KE, Cauley J, Black D, Vogt TM. Risk factors for hip fracture in white women. Study of Osteoporotic Fractures Research Group. N Engl J Med. 1995;332:767–73. doi: 10.1056/NEJM199503233321202. [DOI] [PubMed] [Google Scholar]
- 14.Friston K, Ashburner J, Kiebel S, Nichols T, Penny W. Statistical Parametric Mapping: The Analysis of Functional Brain Images. Elsevier Science & Technology Books; 2006. [Google Scholar]
- 15.Kang Y, Engelke K, Kalender WA. A new accurate and precise 3-D segmentation method for skeletal structures in volumetric CT data. IEEE Transactions on Medical Imaging. 2003;22:586–598. doi: 10.1109/TMI.2003.812265. [DOI] [PubMed] [Google Scholar]
- 16.Kanis J. Technical Report. WHO Collaborating Centre; University of Sheffield, UK: 2008. Assessment of osteoporosis at the primary health care level. [Google Scholar]
- 17.Keyak JH, Rossi SA, Jones KA, Skinner HB. Prediction of femoral fracture load using automated finite element modeling. J Biomech. 1998;31:125–33. doi: 10.1016/s0021-9290(97)00123-1. [DOI] [PubMed] [Google Scholar]
- 18.Lang T, Koyarna A, Li C, Li J, Lu Y, Saeed I, Gazze E, Keyak J, Harris T, Cheng X. Pelvic body composition measurements by quantitative computed tomography: Association with recent hip fracture. Bone. 2008;42:798–805. doi: 10.1016/j.bone.2007.12.002. [DOI] [PubMed] [Google Scholar]
- 19.Lang TF, Keyak JH, Heitz MW, Augat P, Lu Y, Mathur A, Genant HK. Volumetric quantitative computed tomography of the proximal femur: precision and relation to bone strength. Bone. 1997;21:101–8. doi: 10.1016/s8756-3282(97)00072-0. [DOI] [PubMed] [Google Scholar]
- 20.Li W, Kezele I, Collins L, Zijdenbos A, Keyak J, Kornak J, Koyama A, Saeed I, LeBlanc A, Harris T, Lu Y, Lang T. Voxel based modeling and quantification of the proximal femur using inter-subject registration of quantitative CT images. Bone. 2007;41:888–895. doi: 10.1016/j.bone.2007.07.006. [DOI] [PMC free article] [PubMed] [Google Scholar]
- 21.Li WJ, Sode M, Saeed I, Lang T. Automated registration of hip and spine for longitudinal QCT studies: Integration with 3D densitometric and structural analysis. Bone. 2006;38:273–279. doi: 10.1016/j.bone.2005.08.014. [DOI] [PMC free article] [PubMed] [Google Scholar]
- 22.Mayhew PM, Thomas CD, Clement JG, Loveridge N, Beck TJ, Bonfield W, Burgoyne CJ, Reeve J. Relation between age, femoral neck cortical stability, and hip fracture risk. Lancet. 2005;366:129–135. doi: 10.1016/S0140-6736(05)66870-5. [DOI] [PubMed] [Google Scholar]
- 23.Orsini LS, Rousculp MD, Long SR, Wang S. Health care utilization and expenditures in the United States: a study of osteoporosis-related fractures. Osteoporos Int. 2005;16:359–71. doi: 10.1007/s00198-004-1694-2. [DOI] [PubMed] [Google Scholar]
- 24.Robbins J, Aragaki A, Kooperberg C, Watts N, Wactawski-Wende J, Jackson R, LeBoff M, Lewis C, Chen Z, Stefanick M, Cauley J. Factors associated with 5-year risk of hip fracture in postmenopausal women. JAMA. 2007;298:2389–2398. doi: 10.1001/jama.298.20.2389. [DOI] [PubMed] [Google Scholar]
- 25.Siris ES, Brenneman SK, Miller PD, Barrett-Connor E, Chen YT, Sherwood LM, Abbott TA. Predictive value of low BMD for 1-year fracture outcomes is similar for postmenopausal women ages 50-64 and 65 and older: Results from the National Osteoporosis Risk Assessment (NORA) Journal of Bone and Mineral Research. 2004;19:1215–1220. doi: 10.1359/JBMR.040508. [DOI] [PubMed] [Google Scholar]
- 26.Siris ES, Miller PD, Barrett-Connor E, Faulkner KG, Wehren LE, Abbott TA, Berger ML, Santora AC, Sherwood LM. Identification and fracture outcomes of undiagnosed low bone mineral density in postmenopausal women - Results from the National Osteoporosis Risk Assessment. Jama-Journal of the American Medical Association. 2001;286:2815–2822. doi: 10.1001/jama.286.22.2815. [DOI] [PubMed] [Google Scholar]
- 27.Studholme C, Hill DLG, Hawkes DJ. An overlap invariant entropy measure of 3D medical image alignment. Pattern Recognition. 1999;32:71–86. [Google Scholar]
- 28.Zhao Q, Li W, Li CL, Kornak J, Lang T, Lu Y, Fang J. Determination of Longitudinal Changes in Images: Optimum Suprathreshold Selection in a Permutation Cluster Test. unpublished. [Google Scholar]


