Abstract
An automatic, simple, and image intensity standardization-based strategy for correcting background inhomogeneity in MR images is presented in this paper. Image intensities are first transformed to a standard intensity gray scale by a standardization process. Different tissue sample regions are then obtained from the standardized image by simply thresholding based on fixed intensity intervals. For each tissue region, a polynomial is fitted to the estimated discrete background intensity variation. Finally, a combined polynomial is determined and used for correcting the intensity inhomogeneity in the whole image. The above procedure is repeated on the corrected image iteratively until the size of the extracted tissue regions does not change significantly in two successive iterations. Intensity scale standardization is effected to make sure that the corrected image is not biased by the fitting strategy. The method has been tested on a number of simulated and clinical MR images. These tests and a comparison with the method of non-parametric non-uniform intensity normalization (N3) indicate that the method is effective in background intensity inhomogeneity correction and may have a slight edge over the N3 method.
Keywords: MRI, field inhomogeneity, standardization, image filtering, image segmentation
1. INTRODUCTION
Background image intensity variations caused by imperfections in imaging devices pose major challenges for further processing, segmentation, and analysis of acquired images. In magnetic resonance imaging (MRI), such effects originating from imperfections in the radio frequency field and from the human body are well known [1]. A variety of techniques have been developed over the past 15 years to address this problem [2-13]. While many of these methods have provided an effective solution in MRI, there is room for improvement in the sense of developing a general method that fulfills the following requirements: (R1) no need for user help especially on a per-scene basis; (R2) no need for accurate prior segmentation of objects in the image; (R3) no need for prior knowledge of intensity distribution.
Early methods for intensity inhomogeneity estimation and correction used phantoms to empirically measure the inhomogeneity [6]. Wells et al. [8] proposed an expectation maximization (EM)-based algorithm consisting of interleaved voxel classification and inhomogeneity correction steps. Guillemaud and Brady [9] introduced a modified EM algorithm that replaced the distribution of the class other, which included all tissues not explicitly modeled, by a uniform probability density function. The correction was claimed to be more robust and to overcome some limitations of Wells′ original method. Similar to these works [8], [9], Leemput et al. [10] proposed a model-based method that also employed an iterative EM strategy that interleaved voxel classification with estimation of class distribution and inhomogeneity parameters. However, they used a priori information from a digital brain atlas to initialize the expected location and parameters of tissue classes, and claimed yielding more objective and reproducible results. Sled et al. [11] described a non-parametric non-uniform intensity normalization (N3) method. The method is independent of MRI pulse sequences and is claimed to be insensitive to pathological data that may otherwise violate model assumptions. An iterative approach was employed to estimate both the multiplicative inhomogeneity and the distribution of the true tissue intensities. Styner et al. [12] developed a correction method called PABIC based on a simplified method of the imaging process, a parametric model of tissue class statistics, and a polynomial model of the inhomogeneity field. Likar et al. [13] described a model-based correction method that made the assumption that an image corrupted by intensity inhomogeneity contains more information than the corresponding uncorrupted image. The image degradation process was described by a linear model consisting of a multiplicative and an additive component which were modeled by a combination of smoothly varying basis functions.
It is clear that some object information is vital in order to estimate (and, therefore, to correct) the background variation component of the intensities in the image. This, however, we argue, need not come in the form of explicit object segmentation or by way of prior tissue intensity distribution. To liberate a solution to inhomogeneity correction from the vagaries of image segmentation will be a good idea, since the latter itself is a difficult problem which has defied a solution fulfilling (R1) – (R3) up till now. What is needed is sample (not necessarily complete) object regions constituting the same object material (tissue in medical imaging). In this paper, we present a significant body of evidence that a solution fulfilling (R1)–(R3) is indeed feasible through the use of intensity standardization techniques, introduced in [14], [15].
A major problem in MR images is the non-standardness of the MR image intensity gray scale, which implies the lack of a tissue-specific numeric intensity meaning, even within the same MRI protocol, for the same body region, for images obtained on the same scanner, and for the same patient. The intensity standardization method described in [14] offers a simple way of transforming the MR images nonlinearly so that there is a significant gain in similarity of the resulting images. We have demonstrated that this technique is very useful in segmentation and tissue characterization [16], and that the same segmentation methods perform better after standardization than before [17]. The purpose of this work is to demonstrate how standardization can be employed to reduce background inhomogeneity in MR images. Our method, described in Section 2, consists of first standardizing the MR images to the standard intensity scale, then obtaining different tissue sample regions from simply thresholding by using fixed intensity intervals, and then estimating and correcting for intensity variations based on the thresholded regions, which constitute the sample regions mentioned earlier but not complete or accurate segmentations. The process is iteratively repeated on the resulting images. We demonstrate in Section 3 both qualitatively and quantitatively the effectiveness of the method in correcting even severe inhomogeneities coming from surface coils. Our concluding remarks are stated in Section 4. An early version of this paper was presented at the SPIE Medical Imaging 2006 conference whose proceedings contained an abbreviated version of this paper [18].
2. THE STANDARDIZATION-BASED METHOD
2.1 Preamble
We refer to a volume image as a scene and represent it by a pair C = (C, f), where C, called the scene domain, is a rectangular array of cuboidal volume elements, usually referred to as voxels, and f is the scene intensity function which assigns to every voxel c ∈ C an integer called the intensity of c in C in a range [L, H ]. We will use the following notations throughout.
| C: | a given scene corrupted by background variation (such as the one produced by an imaging device). |
| Cbt = (C, fbt): | a scene representing the true background variation component in C. |
| Cu = (C, fu): | C without the background variation component Cbt. |
| Cc = (C, fc): | the scene resulting from applying a correction algorithm α to C to suppress background variation in C. |
| Cbe = (C, fbe): | a scene representing the background variation component in C estimated by a correction algorithm α. |
| |C|: | the number of voxels in C. |
| SPR | the set of all scenes acquired as per a given MRI protocol P and for a given body region R. |
We make the following assumptions in designing our method.
| (A1): | fbt is sufficiently slow varying such that there exist homogeneous regions in the foreground of C that represent the same object material. |
| (A2): | C with its background variation results from a known invertible operation Τ between Cu and Cbt. |
(A1) reflects the core spirit of our approach. It says that, even in the presence of background inhomogeneity, if contiguous homogeneous regions can be found in the foreground, then they must represent regions containing the same object material. Such sample homogeneous regions are enough for our method to estimate and correct for the background variation component. The background variation introduced by MRI scanners is generally considered to be due to a multiplicative phenomenon. Along with the background variation, any MRI scene C embodies several other artifacts including blur, statistical noise, and acquisition-to-acquisition scene intensity gray scale variation [14]. The exact nature of these component artifacts and variations and how they interact among themselves and with Cbt are not known, and there do not seem to have been any attempts to study these interactions. (A2) reflects the fact that, in the absence of such knowledge, we rely on Cbe to correct for background variation, but in the process, expect not to significantly amplify the effects due to other artifacts. The influence of the effect of the validity/violation of (A2) on the output of a correction algorithm α cannot be ascertained theoretically at the present state of knowledge, but can be assessed through properly designed evaluation strategies. If α can achieve better homogeneity of scene intensity within the same object region without amplifying other artifacts, that is what matters. We shall come back to the issue of other artifacts vis-a-vis background variation in Section 4.
2.2 Key ideas and outline of the method
The procedure for correcting background variation, which we name SBC (for Standardization-Based Correction), consists of the following steps. The method has no parameters to be specified by the user on a scene-by-scene basis. It is an iterative procedure, which proceeds until the change found in two successive iterations is sufficiently small to consider the method to have converged.
| Procedure | SBC |
| Input: | A scene C. |
| Output: | Corrected scene Cc. |
| begin | |
| S0. | set Cc= C; |
| S1. | standardize Cc to the standard intensity gray scale for the particular imaging Protocol P and body region R under consideration and output scene Cs; |
| S2. | determine tissue regions CB1, CB2, …, CBm by using fixed threshold intervals on Cs that are specific to P and R; |
| S3. | if CBi s determined in the previous iteration are insignificantly (< 0:1%) different from the current CBi s, stop; |
| S4. | else, estimate background variation in Cs as a scene Cbe, compute corrected scene Cc, and go to S1; |
| end |
In the next section, the individual steps in the above procedure are described in detail.
2.3 Description of Steps in SBC
S1: Standardizing MRI scene intensities
As demonstrated in [14], MRI scenes in SPR do not have scene intensity gray scales that can be considered to be nearly the same, even for scenes obtained on the same scanner, for the same subject. The method described in [14], and enhanced in [15], offers a way of transforming the scenes in SPR so that there is a significant gain in the similarity of the resulting scenes in terms of their intensity-wise tissue characterizability. This is achieved in two steps – a training step that is executed only once for a given P and R, and a transformation step that is executed for each given scene in SPR. In the training step, certain landmarks of a standard histogram are estimated from a given subset of SPR. In the transformation step, the actual intensity transformation from the intensity scale of the input scene to the standard scale is computed by mapping the landmarks determined from the histogram of the given scene to those of the standard scale. The standardization process is illustrated in Figure 1 wherein histograms of the white matter (WM) region in a set of 10 PD-weighted MRI scenes are shown before and after standardization. The effect of intensity standardization is readily seen by comparing Figures 1(a) and (c), and 1(b) and (d). We use the method of [15] to produce the standardized scene Cs corresponding to given scene C to be corrected.
Fig. 1.
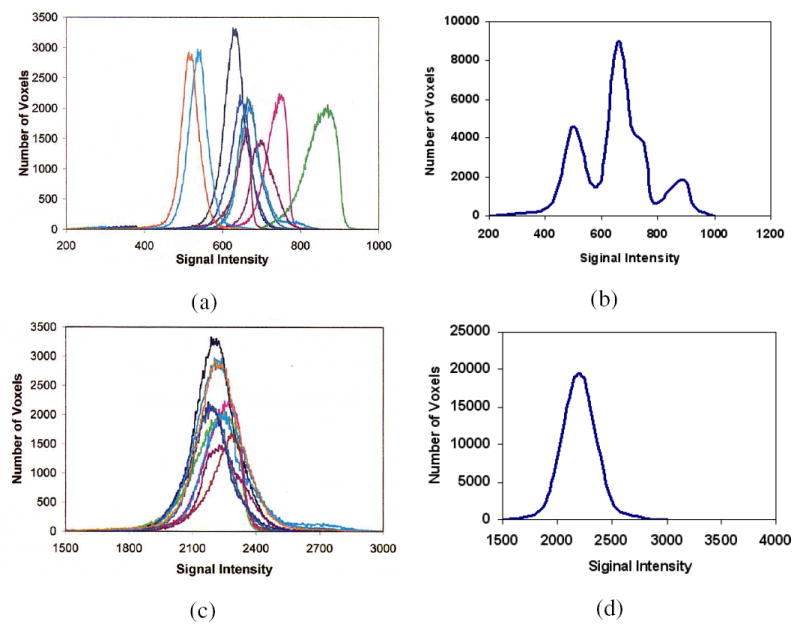
(a) Histograms of WM regions in 10 original PD-weighted MRI scenes. (b) A histogram obtained by combining the 10 histograms of (a) which represents WM intensity distribution in PD scenes. (c) Histograms of WM regions in the 10 corresponding standardized scenes. (d) Similar to (b) but obtained from the 10 histograms in (c).
S2: Determining object regions
After MRI scene intensity standardization, the scene intensity intervals for different tissues for the specific P and R are determined and fixed once for all, and used throughout the subsequent background inhomogeneity correction steps for all scenes in SPR. Figure 2(a) shows a slice of a given standardized scene Cs, which is a simulated PD-weighted MRI scene of the head [19], and Figures 2(b) and (c) show the gray matter (GM) and WM regions obtained by thresholding via fixed intensity intervals. The largest connected component of each thresholded result is extracted, and produced as a binary scene CB. This binary scene gives us the sample object region (although not with a perfect segmentation by any means) containing roughly the same object material for each object/tissue. Let CB1, CB2, …, CBm be m binary scenes produced in this manner for m object/tissue regions in Cs.
Fig. 2.
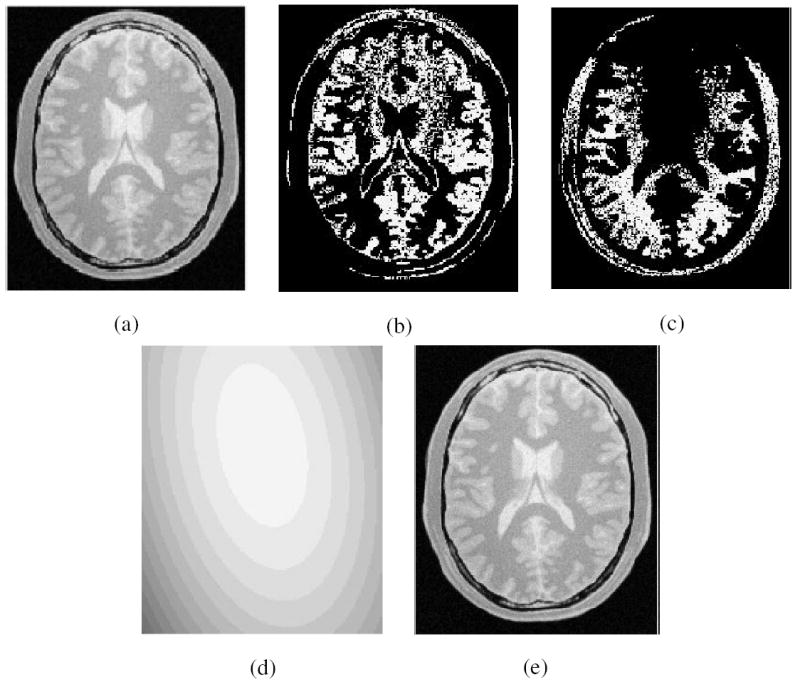
(a) One slice of the original PD-weighted MRI. (b) GM region and (c) WM region resulting from thresholding this slice with fixed intensity intervals; (d) corresponding slice of Cbe; (e) corresponding slice of corrected scene Cc.
S3: Stopping criterion
The basic premise of this method is that, as correction is effected, the object region represented in each CBi will change gradually. When this change is insignificant (< 0:1%), the iterative procedure stops. From our numerous experiments, we have observed that the iterative procedure stops within 20 iterations. The variations of CBi and Cc with iteration within SBC are illustrated in Figure 3 for the scene example used in Figure 2. The effect of inhomogeneity correction with iteration is shown via intensity histogram of the foreground only of the corrected scene in Figure 3(d), where the overlap between the intensity distributions of GM and WM caused by background variations is reduced gradually with increasing number of iterations.
Fig. 3.
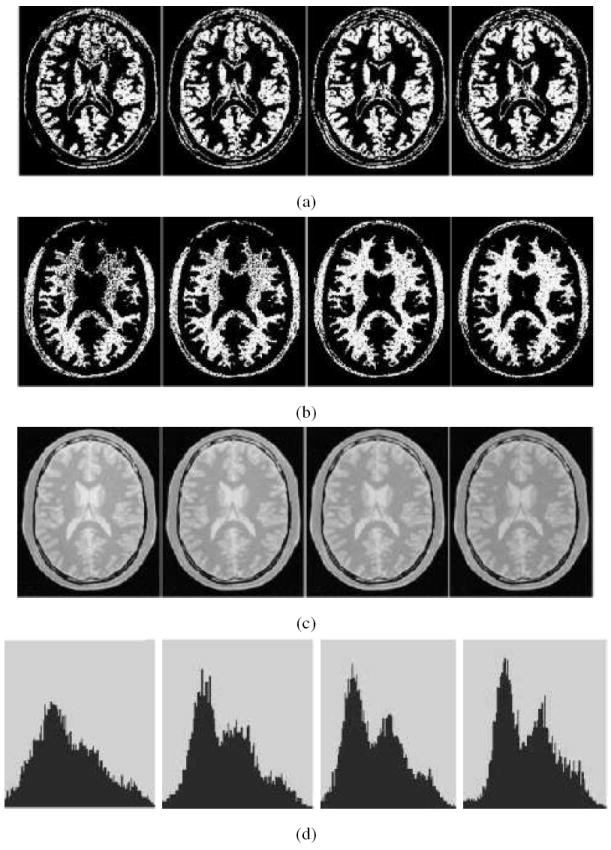
The improvement in Cc observed with increasing number of iterations (left to right: 3,5,10, and 20) illustrated through the examples of Fig.2. (a), (b) thresholded scenes corresponding to GM and WM threshold intervals. (c) Cc. (d) The intensity histogram of Cc. The improved definition of the two modes corresponding to WM (larger mode) and GM with iteration is clear. For clarity of display, the histograms shown do not include the background.
S4: Estimation of inhomogeneity map
In this step, the background variation is estimated first and then corrected. We treat every tissue region from Step S2 as an independent entity with its own local, best fit polynomial to the background variation component. We then combine these independent polynomials into a single unified function and use it for correcting inhomogeneities in the whole scene. We explain our implementation below in detail.
For any tissue region CBi, 1 ≤ i ≤ m, let Oi be the set of all 1-valued voxels in CBi, and μi be the mean intensity within Oi. Without loss of generality, let |O1| ≥ |O2| ≥ ⋯ ≥ |Om|. The background variation in each CBi is then estimated as a discrete function βdi : Oi → [0, ∞) defined as follows. For any c ∈ Oi,
| (1) |
where Τ is the operation (mentioned in assumption (A2)) between Cu and Cbt that yields C. We denote this operation by C = Cu Τ Cbt, which equivalently means, for any c ∈ C, f(c) = fu(c) Τ fbt(c). In MRI, Τ is usually considered to be multiplication. A 2nd order polynomial βi is then estimated from the discrete function βdi by using a least-squares-error fit.
As per assumption (A1), the background variation in a scene is slow varying. However, the inhomogeneity functions βi, 1 ≤ i ≤ m, are separately estimated for different homogeneous regions (corresponding to different tissues/objects) in an independent manner. Consequently, the continuity between the inhomogeneity map βi estimated over Oi and βj over Oj, j ≠ i, cannot be guaranteed, as illustrated in Figure 4. This discontinuity is caused by the fact that the expected intensity μi for region Oi is corrupted independent of Ojs, 1 ≤ j ≤ m, and i ≠ j. At this stage, it is impossible to determine the bias in the mean intensity μi in the context of global inhomogeneity. The situation is exacerbated by the presence of intensity non-standardness itself. Since MRI intensities do not have absolute tissue-specific meaning, it becomes impossible to make assumptions about the relative shifts (biases) among the estimated βis. This points out the arbitrariness that exists in determining the overall level of the correcting function. This also clarifies as to how inhomogeneity correction itself can introduce non-standardness [20]. Our approach to fit an overall correcting function to estimated maps βi is as follows, and also illustrated in Figure 4.
Fig. 4.
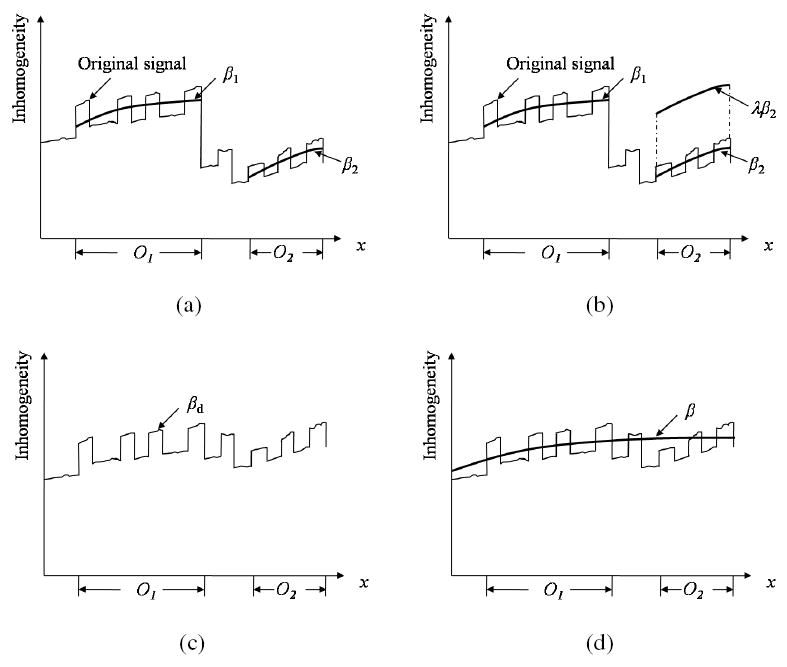
Illustration of the possibility of existence of discontinuity between inhomogeneity maps estimated independently from different tissue regions Oi and Oj, and how to combine them into a single unified inhomogeneity map. For the convenience of presentation, the scene is considered to be 1D in this illustration, and only two objects are considered. (a) Original discrete inhomogeneities are estimated independently from different tissue regions, and two smooth inhomogeneity maps β1 and β2 are fitted for two objects O1 and O2 in an independent manner. (b) β2 is shifted by a weight factor λ so that the difference between β1 and λβ2 is minimized. (c) A new discrete inhomogeneity map βd is estimated by combining β1 and λβ2. (d) A single smooth unified inhomogeneity map β is fitted to βd.
At first we combine the inhomogeneity maps β1 and β2 over the largest and the second largest regions O1 and O2, respectively, as follows:
Find a weight factor λ to minimize . Essentially, this step computes the bias λ to be applied to β2 so that the difference between β1 and λβ2 is minimized;
-
Combine the two inhomogeneity maps β1 and λβ2 to obtain a new discrete inhomogeneity map βd: C → [0, ∞) such that, for any c ∈ C,
(2) where δ (c, Oi) is the minimum distance between c and a voxel in Oi.
Determine a 2nd degree polynomial β that constitutes a least-squares-error fit to βd.
After merging O1 and O2 as above, we now have m−1 distinct regions O1∪O2, O3, O4, ⋯, Om and m − 1 inhomogeneity maps β, β3,β4, ⋯, βm. The above steps are then repeated until we have only one region O1 ∪ O2 ∪ O3 ∪ ⋯ ∪ Om and a single unified inhomogeneity map β. This unified inhomogeneity map β is represented as a scene Cbe = (C, fbe), where fbe = β.
Since Τ is invertible, Cu = CΤ−1Cbt, and therefore, by (A2),
| (3) |
In MRI, Τ is generally considered to be a multiplication operation, and therefore, Τ−1 becomes division. In general, if Τ is known and invertible, (i.e., Τ−1 is known), then from Equation 3, we can determine Cc. In Figures 2(d) and (e), we display Cbe and Cc for the running example after the first iteration.
After scene correction, we go to the standardization step and repeat the procedure. We note that, the parameters of the standardizing transform are determined by training only once and then fixed for a given P and R (and so also the threshold intervals). The standardization step (actually the transformation step) S1 in each iteration uses these same parameters for effecting standardization. Therefore our strategy of using fixed threshold intervals in the standardized scene is perfectly legitimate. Since inhomogeneity correction methods introduce some non-standardness of their own [20], as described above, in each iteration of SBC, the standardization step S1 becomes necessary.
3. RESULTS AND EVALUATION
In Section 3.1, to demonstrate qualitatively how effective SBC is in correcting background variation, we present a set of examples showing scenes before and after applying the SBC correction procedure. We present the results of a quantitative evaluation procedure in Section 3.2 based on twelve simulated MRI scenes obtained from the BrainWeb database [19] and on 10 PD- and 10 T2-weighted clinical MRI scenes with Multiple Sclerosis (MS) lesions obtained from our own database. Information about the scene data sets used in our evaluation is listed in Table 1. We compare the SBC method with the N3 method [11]. The main reasons for selecting N3 for comparison are: (i) it seems to be commonly used, (ii) it comes closest to SBC in its spirit of not requiring any user input or a priori information, and (iii) following the results of the comparative study among six algorithms for correcting intensity inhomogeneity reported by Arnold et al. [21], the N3 method generally outperformed other methods. Briefly, the basic idea of the N3 method is to find a smooth, slowly varying, multiplicative field that maximizes the frequency content of the probability density function of the logarithm of scene intensities. It is an iterative process in which, in addition to the intensity inhomogeneity, the non-parametric model of the scene intensities is also derived directly from the data. The implementation of the N3 method available at ftp://ftp.bic.mni.mcgill.ca/pub/mni_n3 is utilized in our comparison. In our experiments, the parameters of the N3 method were set to the default values.
TABLE 1.
Information about scene data utilized in evaluation.
| Data Set | Body region | Number of scenes | Scene domain | Voxel size (mm3) |
|---|---|---|---|---|
| D1 | Head-Coronal | 1 | 128 × 128 × 56 | 1.0 × 1.0 × 3.0 |
| D2 | Head-Transverse | 1 | 181 × 217 × 181 | 1.0 × 1.0 × 1.0 |
| D3 | Abdomen | 1 | 256 × 256 × 21 | 1.56 × 1.56 × 6.0 |
| D4 | Hips | 1 | 256 × 256 × 15 | 1.56 × 1.56 × 7.5 |
| D5 | Foot | 1 | 256 × 256 × 60 | 0.55 × 0.55 × 1.7 |
| D6 | Simulated Brain MRI | 12 | 181 × 217 × 60 | 1.0 × 1.0 × 3.0 |
| D7 | Clinical Brain MRI | 10 T2 + 10 PD | 256 × 256 × 60 | 0.86 × 0.86 × 3.0 |
3.1 Qualitative
In Figure 5, we present five examples constituting data sets D1-D5 of Table 1 involving different P and R. One slice from the original scene, and the same slice of the corrected scene produced by N3 and SBC methods are shown for each data set. In all displays, the same gray level window settings were used. The corresponding intensity histograms (for the whole 3D scene) are displayed under each scene. These figures give a qualitative indication of the effectiveness of SBC in suppressing background variation. In all examples, SBC worked automatically requiring no specific setting or adjustment of parameters, and so did N3. Since SBC has no parameters whose values are to be adjusted or ascertained for different situations by user interaction or by using priors, this automatic mode became feasible on scenes listed in Table 1 and on a variety of others. From the histograms displayed, SBC seems to have performed better than N3 in all cases yielding a better definition of the modes in the histogram.
Fig. 5.
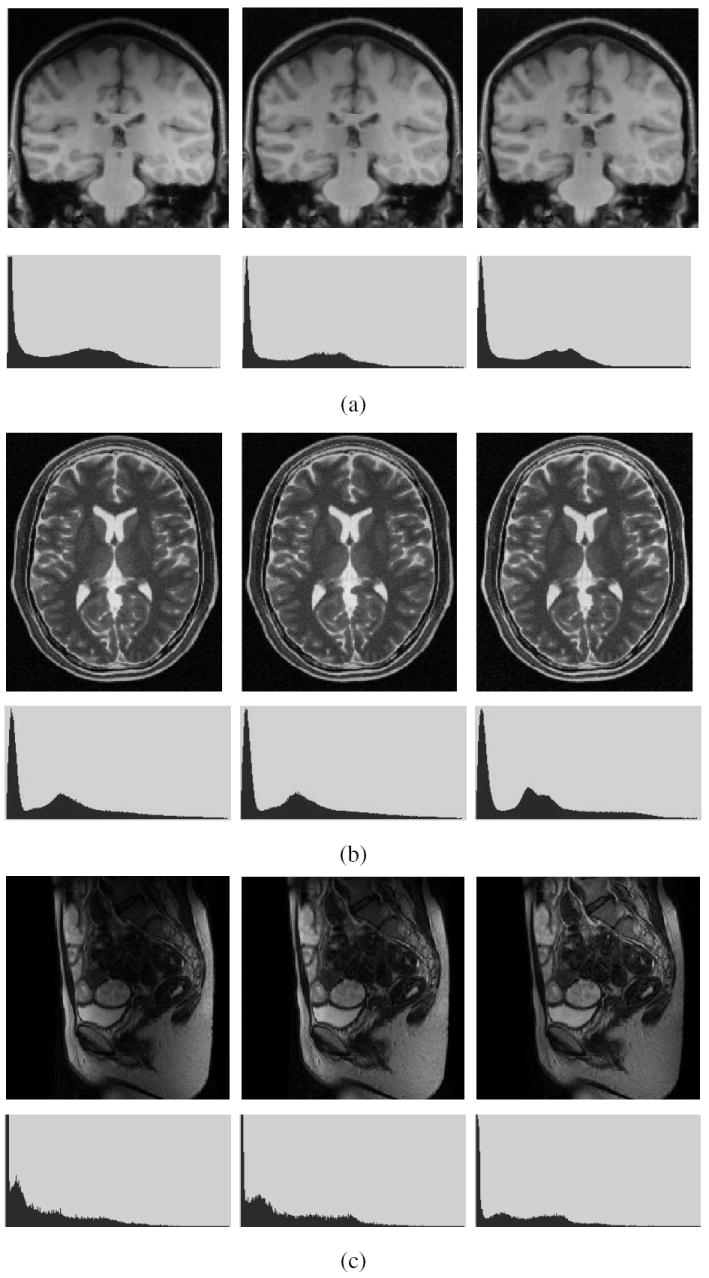
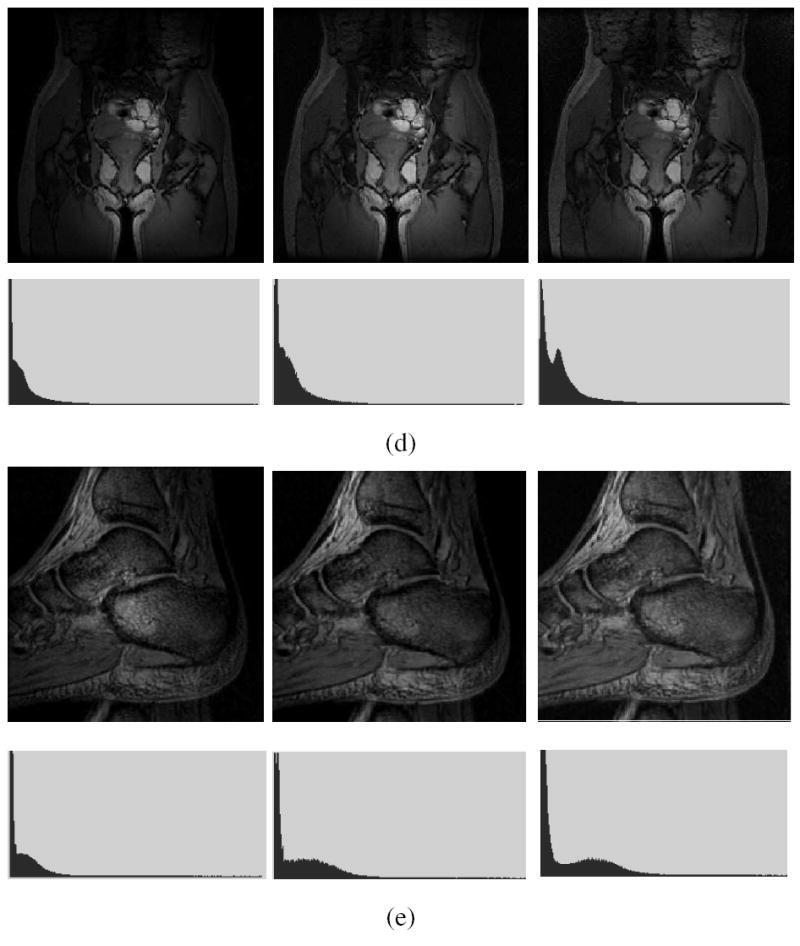
A slice of MRI scenes of different body regions acquired by using different MRI protocols is shown on the left in (a) to (e). The corresponding slices of the scenes after inhomogeneity correction by using the N3 (middle) and SBC procedures (right). For each of (a)-(e), the corresponding intensity histogram (of the whole 3D scene) is shown under each scene. The data sets in (a)-(e) correspond to D1-D5 in Table 1.
3.2 Quantitative
We assess the performance of the correction methods by comparing the percent coefficients of variations (cυ) of intensity within individual tissue regions in the original and corrected scenes. After the scene is segmented, cυ(K) of tissue class K is computed as
| (4) |
where σ(K) and μ(K) are the standard deviation and mean intensity of class K, respectively. The quantity cυ, which represents the normalized standard deviation in a given tissue class, is invariant to uniform multiplicative intensity transformation.
(1) Simulated Data
Twelve (four T1, four T2, and four PD-weighted) MRI scenes from the BrainWeb database were used [19] (D6 in Table 1). All scenes had 3% noise. Six scenes each with 20% and 40% inhomogeneity were used, three of each were normal and three with MS lesions. Table 2 lists the results. The corrected scenes indicate that both N3 and SBC can effectively minimize the intensity variations within GM and WM. Generally, the cυ values of all corrected scenes for 40% inhomogeneity are similar to the cυ of the scenes for 20% inhomogeneity for both methods. One slice of a T2-weighted MRI scene with MS lesions before and after applying the N3 and SBC methods and the corresponding (3D) intensity histograms are shown in Figure 6. Generally the cυ values for SBC seem to be as good as those for N3. Since multiple data sets with multiple anatomies are not available in this database under each protocol, we cannot conduct a statistical comparison.
TABLE 2.
Percent coefficient of variation cυ of tissue intensities in segmented GM and WM regions for twelve simulated MRI scenes before correction, and after correction by N3 and SBC methods.
| cυ(GM) | cυ(WM) | |||||||
|---|---|---|---|---|---|---|---|---|
| Date Set | Protocol | Inhomogeneity | Original | N3 | SBC | Original | N3 | SBC |
| D6 (normal) | T1 | 20% | 11.0 | 9.9 | 9.9 | 6.7 | 5.1 | 5.1 |
| 40% | 13.5 | 10.0 | 9.9 | 9.2 | 5.2 | 5.2 | ||
| T2 | 20% | 18.4 | 18.0 | 17.9 | 12.0 | 11.8 | 11.7 | |
| 40% | 20.3 | 20.0 | 17.9 | 13.3 | 13.0 | 11.8 | ||
| PD | 20% | 6.3 | 4.6 | 4.5 | 5.5 | 4.7 | 4.7 | |
| 40% | 9.7 | 4.6 | 4.5 | 7.5 | 4.6 | 4.6 | ||
| D6 (lesions) | T1 | 20% | 11.2 | 10.1 | 10.1 | 6.9 | 5.3 | 5.3 |
| 40% | 13.7 | 10.2 | 10.1 | 9.3 | 5.3 | 5.4 | ||
| T2 | 20% | 10.9 | 10.0 | 9.8 | 8.7 | 8.3 | 8.1 | |
| 40% | 13.7 | 10.1 | 9.8 | 10.6 | 8.2 | 8.2 | ||
| PD | 20% | 5.8 | 3.9 | 3.8 | 5.3 | 4.4 | 4.3 | |
| 40% | 9.4 | 4.0 | 3.9 | 7.4 | 4.3 | 4.3 | ||
Fig. 6.
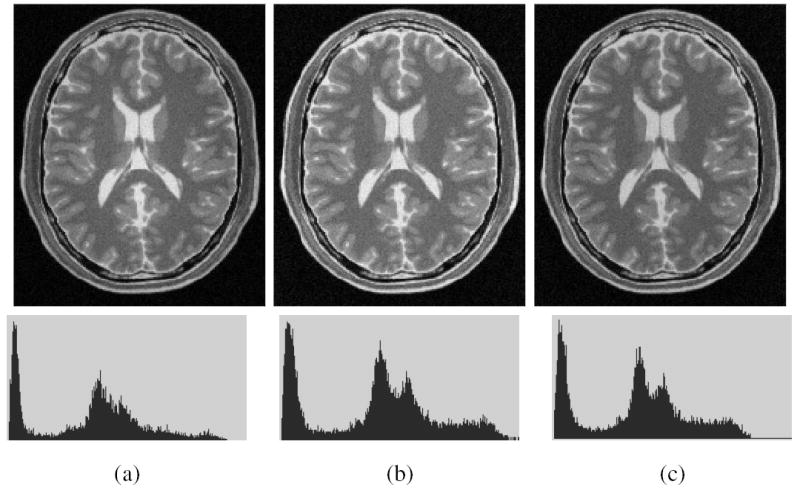
(a) A slice of a simulated T2-weighted MRI scene with MS lesions and with 40% inhomogeneity. The corresponding slice of the scene corrected by using (b) N3 method, and (c) SBC method. The scene intensity histograms are shown in the second row.
(2) Clinical Data
Clinical MRI scene data (D7 in Table 1) used in our evaluation experiments came from 10 different MS patients and each had T2- and PD-weighted scenes. These data sets were randomly selected from our database, and were acquired on the same GE Signa 1.5T scanner with a FOV of 22 cm, and TR of 2500 ms and TE of 18 ms/90 ms. Again the tissues considered were GM and WM. Figure 7 shows one slice of one PD-weighted scene and its corrected scenes created by using the N3 and SBC methods. The GM and WM regions were obtained by using the fuzzy connectedness-based segmentation method [22] implemented in 3DVIEWNIX [23], and by correcting the results when necessary under the guidance of an expert. Table 3 lists the mean and standard deviation (in parenthesis) of cυ values for both T2- and PD-weighted scenes, and for GM and WM regions. We observe that, for both tissue regions and for both protocols, the two methods achieve smaller cυ values than before correction. Further, the cυ values for the SBC method are smaller than those for the N3 method, and this difference has been found to be statistically significant under a paired t-test for each protocol at a level of p < 0:001.
Fig. 7.
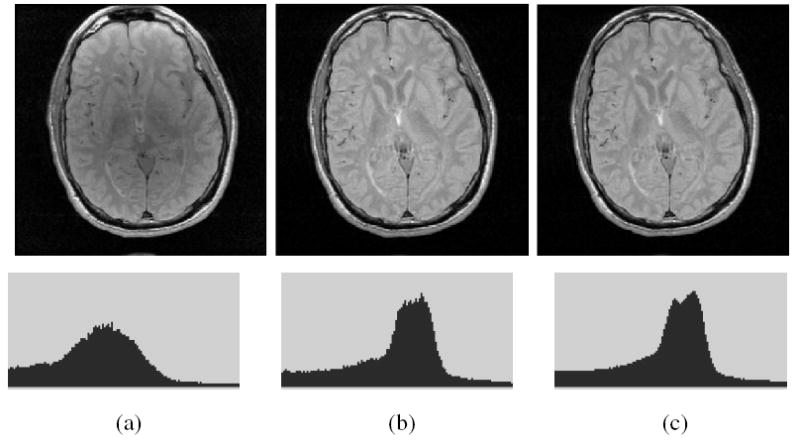
(a) A slice of a MRI PD scene of the head of a patient with Multiple Sclerosis. The corresponding slice of the corrected scene output by (b) N3, and (c) SBC methods, and the respective histograms (bottom).
TABLE 3.
The mean and standard deviation (in parenthesis) of percent coefficient of variation of tissue intensities in segmented GM and WM regions for 10 clinical T2- and PD-weighted MRI scenes of MS patients before correction, and after applying the N3 and SBC correction methods.
| Protocol | cυ(GM) | cυ(WM) | ||||
|---|---|---|---|---|---|---|
| Original | N3 | SBC | Original | N3 | SBC | |
| T2 | 16.7(1.61) | 14.9(1.18) | 14.7(1.23) | 12.9(1.12) | 11.5(1.07) | 11.2(0.98) |
| PD | 7.1(0.32) | 5.9(0.20) | 5.6(0.19) | 7.8(0.72) | 6.6(0.62) | 6.2(0.51) |
3.3 Implementation
The SBC method has been implemented within the 3DVIEWNIX software system [23] which is available at http://www.mipg.upenn.edu. In its current implementation, the SBC procedure requires 50 seconds for a typical MRI scene of size 256 × 256 × 60 for running 20 iterations on a 1.7GHZ Pentium IV PC under RedHat 9.0. For the same scene, the N3 method takes about 65 seconds on the same platform.
4. CONCLUDING REMARKS
Background variation in MRI scenes due to imperfections in imaging devices is a problem commonly encountered in image analysis in many areas. Although many solutions have been proposed in the past, they all had varying degrees of dependency on the particular protocol, body region, application domain, and the type of variation. In an attempt to liberate this dependency, we have devised a method based on MRI intensity standardization. The method has no parameters whose values are to be determined or to be provided by the user on a per scene basis. Our qualitative and quantitative evaluation experiments indicate that its performance and behavior match our intuitive expectation. Its performance seems, at the least, to be comparable to that of the state-of-the-art N3 method, and our experiments indicate a slight edge for the proposed SBC method over N3. The N3 method assumes that the bias field is normally distributed, which may not be true for some clinical MRI data. In addition, the N3 method treats all voxels alike for inhomogeneity estimation. This is somewhat unnatural, since it is obvious that the WM voxels in a brain MRI scene, which have a narrow intensity histogram, are much more suited for inhomogeneity estimation than, for instance, the tissues surrounding the brain or ventricular CSF [10]. Other advantages of SBC are its simplicity, intuitive nature, and standardization of the scene as a byproduct of the method.
As related to assumption (A2), some comments are in order. There are basically the following three types of operations commonly done on MRI scenes before further carrying out other image processing and analysis operations on them: correction of background variation, filtering to suppress noise [24], and intensity scale standardization. There is perhaps some interaction among the effects of these operations, which, to our knowledge, has not been studied. To what extent the order in which these operations are carried out influences the results is also unknown. Given the importance of these operations, it is worthwhile to study the above issues. We have done some preliminary work along these lines [20], [24].
Acknowledgments
The research reported here is supported by a DHHS Grant NS 37172.
Biographies
Author YING ZHUGE was born in JianDe, P.R. China, in 1971. He received his Ph.D. in Computer Science from Institute of Automation, Chinese Academy of Sciences, China, in 1999. Since 2000, he has been with Medical Image Processing Group, Department of Radiology at the University of Pennsylvania, where he is Research Associate. His research interests focus on pattern recognition and medical image processing.
Author JAYARAM K. UDUPA received his Ph.D. in Computer Science from the Indian Institute of Science in 1976. Since 1981, he has been with Medical Image Processing Group, Department of Radiology at the University of Pennsylvania, where he is the Chief of the Medical Imaging Section and Professor of Radiological Sciences. His research interests focus on biomedical image and signal processing, pattern recognition, biomedical computer graphics, 3D imaging, visualization and their biomedical applications.
Author JIAMIN LIU was born in TongChuan, P. R. China, in 1975. She received her Ph.D. in Bioengineering from the University of Pennsylvania in 2006. Since 2007, she has been with the Diagnostic Radiology Department, National Institutes of Health Clinical Center, where she is a Staff Scientist. Her research interests focus on signal processing and medical image processing.
Author PUNAM K. SAHA received his Ph.D. from the Indian Statistical Institute in 1997. He has served as an assistant professor at the Department of Radiology in the University of Pennsylvania. Since 2006, he has joined the Department of Electrical & Computer Engineering and Radiology of the University of Iowa as an associate professor. His research interests include biomedical image processing and applications.
Footnotes
Publisher's Disclaimer: This is a PDF file of an unedited manuscript that has been accepted for publication. As a service to our customers we are providing this early version of the manuscript. The manuscript will undergo copyediting, typesetting, and review of the resulting proof before it is published in its final citable form. Please note that during the production process errors may be discovered which could affect the content, and all legal disclaimers that apply to the journal pertain.
References
- 1.Axel L, Costantini J, Listerud J. Intensity corrections in surface-coil MR imaging. American Journal of Roentgenology. 1987;148:418–420. doi: 10.2214/ajr.148.2.418. [DOI] [PubMed] [Google Scholar]
- 2.Haselgrove J, Prammer M. An Algorithm for compensation of surface-coil images for sensitivity of the surface coil. Magnetic Resonance Imaging. 1986;4:469–472. [Google Scholar]
- 3.Vannier MW, Speidel CM, Rickman DL. Magnetic resonance imaging multispectral tissue classification. News in Physiological Sciences. 1988;3:148–154. [Google Scholar]
- 4.Meyer CR, Bland PH, Pipe J. Retrospective correction of intensity inhomogeneities in MRI. IEEE Transactions on Medical Imaging. 1995;14:36–41. doi: 10.1109/42.370400. [DOI] [PubMed] [Google Scholar]
- 5.Dawant BM, Zjidenbos AP, Margolin RA. Correction of intensity variations in MR images for computer-aided tissue classification. IEEE Transactions on Medical Imaging. 1993;12:770–781. doi: 10.1109/42.251128. [DOI] [PubMed] [Google Scholar]
- 6.Tincher M, Meyer CR, Gupta G, Williams DM. Polynomial modelling and reduction of RF body coil spatial inhomogeneity in MRI. IEEE Transactions on Medical Imaging. 1993;12:361–365. doi: 10.1109/42.232267. [DOI] [PubMed] [Google Scholar]
- 7.Lai S, Fang M. A new variational shape-from-orientation approach to correcting intensity inhomogeneities in MR images. Medical Image Analysis. 1999;3:409–424. doi: 10.1016/s1361-8415(99)80033-4. [DOI] [PubMed] [Google Scholar]
- 8.Wells WM, Grimson EL, Kikinis R, Jolesz FA. Adaptive segmentation of MRI data. IEEE Transactions on Medical Imaging. 1996;15:429–442. doi: 10.1109/42.511747. [DOI] [PubMed] [Google Scholar]
- 9.Guillemaud R, Brady M. Estimating the bias field of MR images. IEEE Transactions on Medical Imaging. 1997;16:238–251. doi: 10.1109/42.585758. [DOI] [PubMed] [Google Scholar]
- 10.Van Leemput K, Maes F, Vandermeulen D, Suetens P. Automated model-based bias field correction of MR images of the brain. IEEE Transactions on Medical Imaging. 1999;18:885–896. doi: 10.1109/42.811268. [DOI] [PubMed] [Google Scholar]
- 11.Sled JG, Zijdenbos AP, Evans AC. A nonparametric method for automatic correction of intensity nonuniformity in MRI data. IEEE Transactions on Medical Imaging. 1998;17:87–97. doi: 10.1109/42.668698. [DOI] [PubMed] [Google Scholar]
- 12.Styner M, Brechbuhler C, Szekely G, Gerig G. Parametric estimate of intensity inhomogeneities applied to MRI. IEEE Transactions on Medical Imaging. 2000;19:153–165. doi: 10.1109/42.845174. [DOI] [PubMed] [Google Scholar]
- 13.Likar B, Viergever MA, Pernus F. Retrospective correction of MR intensity inhomogeneity by information minimization. IEEE Transactions on Medical Imaging. 2001;20:1398–1410. doi: 10.1109/42.974934. [DOI] [PubMed] [Google Scholar]
- 14.Nyul LG, Udupa JK. On standardizing the MR image intensity scale. Magnetic Resonance in Medicine. 1999;42:1072–1081. doi: 10.1002/(sici)1522-2594(199912)42:6<1072::aid-mrm11>3.0.co;2-m. [DOI] [PubMed] [Google Scholar]
- 15.Nyul LG, Udupa JK, Zhang X. New variants of a method of MRI scale standardization. IEEE Transactions on Medical Imaging. 2000;19:143–150. doi: 10.1109/42.836373. [DOI] [PubMed] [Google Scholar]
- 16.Ge Y, Udupa JK, Nyul LG, Wei L, Grossman RI. Numerical tissue characterization in MS via standardization of the MR image intensity scale. Journal of Magnetic Resonance Imaging. 2000;12:715–721. doi: 10.1002/1522-2586(200011)12:5<715::aid-jmri8>3.0.co;2-d. [DOI] [PubMed] [Google Scholar]
- 17.Zhuge Y, Liu J, Udupa JK. Membership-based multiprotocol MR brain image segmentation. SPIE Medical Imaging Proc. 2003;5032:1572–1579. [Google Scholar]
- 18.Zhuge Y, Udupa JK, Liu J, Saha PK. An Intensity Standardization-Based Method for Image Inhomogeneity Correction in MRI. SPIE Medical Imaging Proc. 2006;6143:658–668. [Google Scholar]
- 19.Collins DL, Zijdenbos AP, Kollokian V, Sled JG, Kabani NJ, Holmes CJ, et al. Design and construction of a realistic digital brain phantom. IEEE Transactions on Medical Imaging. 1998;17:463–468. doi: 10.1109/42.712135. [DOI] [PubMed] [Google Scholar]
- 20.Madabhushi A, Udupa JK. The interplay between intensity standardization and inhomogeneity correction in MR image processing. IEEE Transactions on Medical Imaging. 2005;24:561–576. doi: 10.1109/TMI.2004.843256. [DOI] [PubMed] [Google Scholar]
- 21.Arnold JB, Liow JS, Schaper KA, Stern JJ, Sled JG, Shattuck DW, et al. Qualitative and quantitative evaluation of six algorithms for correcting intensity nonuniformity effect. Neuroimage. 2001;13:931–943. doi: 10.1006/nimg.2001.0756. [DOI] [PubMed] [Google Scholar]
- 22.Saha PK, Udupa JK, Odhner D. Scale-based fuzzy connected image segmentation: theory, algorithms, and validation. Computer Vision and Image Understanding. 2000;77:145–174. [Google Scholar]
- 23.Udupa JK, Odhner d, Samarasekera S, Goncalves RJ, Iyer K, Venugopal K, et al. 3DVIEWNIX: An open, transportable, multidimensional multimodality, multiparametric imaging software system. SPIE Medical Imaging Proc. 1994;2164:58–73. [Google Scholar]
- 24.Montillo A, Udupa JK, Axel L, Metaxas DN. Integrated approach for the removal of intensity inhomogeneity and thermal noise in SPAMM-MRI using scale-based fuzzy connectedness and multiple nonlinear adaptive filters. SPIE Medical Imaging Proc. 2003;5032:1025–1036. [Google Scholar]


