Abstract
In search for physiological pathways affecting alternative splicing through its kinetic coupling with transcription, we found that membrane depolarization of neuronal cells triggers the skipping of exon 18 from the neural cell adhesion molecule (NCAM) mRNA, independently of the calcium/calmodulin protein kinase IV pathway. We show that this exon responds to RNA polymerase II elongation, because its inclusion is increased by a slow polymerase II mutant. Depolarization affects the chromatin template in a specific way, by causing H3K9 hyper-acetylation restricted to an internal region of the NCAM gene surrounding the alternative exon. This intragenic histone hyper-acetylation is not paralleled by acetylation at the promoter, is associated with chromatin relaxation, and is linked to H3K36 tri-methylation. The effects on acetylation and splicing fully revert when the depolarizing conditions are withdrawn and can be both duplicated and potentiated by the histone deacetylase inhibitor trichostatin A. Our results are consistent with a mechanism involving the kinetic coupling of splicing and transcription in response to depolarization through intragenic epigenetic changes on a gene that is relevant for the differentiation and function of neuronal cells.
Keywords: histone acetylation, neuronal excitation, transcription, mRNA processing
Over the past decade, it has become increasingly clear that all eukaryotic mRNA processing steps (capping, splicing, and 3′ end formation) are coupled to transcription (1–3). We and others have studied the mechanisms by which transcription can affect alternative splicing, leading to the proposal of 2 different but not exclusive models (4): the recruitment model, by which different factors associated with the transcription complex regulate splicing choices (5–7); and the kinetic model, whereby the rate of RNA polymerase II (pol II) elongation influences splice site selection (8–12). Most of this mechanistic work was performed by experiments involving either promoter swapping or mutant RNA polymerases (5, 11, 13). Both approaches allow a fine control of transcription properties but are unlikely to reflect physiological conditions in which endogenous alternative splicing is regulated in response to environmental cues.
The chromatin structure is likely to play a relevant role in the effects of transcription on alternative splicing, a subject that has received recent attention (14). It has been shown that histone modifications can influence the recruitment of splicing factors to transcription foci (15). Furthermore, the chromatin remodeling complex SWI/SNF has been reported to modulate alternative splicing by taking part in a complex that causes RNA pol II to stall near alternative exons (16). Epigenetic marks such as histone post-translational modifications are possible ways of regulating template properties and transcription quality that, in turn, could influence alternative splicing. Suggestively, induction of a more restrictive intragenic chromatin conformation decreases pol II elongation without affecting initiation (17).
The nervous system is a suitable physiological context in which to look at possible alternative splicing events regulated by chromatin structure. Neurons exhibit an unusually large number of functionally relevant alternative splicing events (18, 19). A well characterized stimulus that regulates alternative splicing is the depolarization of neural cells with high extracellular potassium concentration, a treatment that triggers calcium signaling through the opening of voltage-dependent channels (20–23). A pathway involving activation of calcium/calmodulin-dependent kinase IV (CaMKIV) and recruitment of transacting factors to specific RNA elements (i.e., CaMKIV-responsive RNA element) has been well described (22–24). Conversely, the transcriptional regulation involved in neuron differentiation, maturation, and functionality is largely dependent of chromatin modifications (25, 26), and in particular, of histone acetylation (27–31). However, we are aware of no study of how neuron activity may influence alternative splicing through transcriptional modulation.
We decided to undertake such a study using exon 18 (E18) of the Neural Cell Adhesion Molecule (ncam) gene as a model. The alternative splicing of this exon originates 2 isoforms (NCAM140 and NCAM180) (32, 33). NCAM140 is most abundant in neuronal precursors, whereas NCAM180 increases gradually during neuronal differentiation (34). Both isoforms are integral membrane proteins and the differential portion corresponds to the cytosolic region. While NCAM140 is uniformly distributed throughout the plasma membrane and is more efficient in promoting neurite outgrowth and is important for synapse maturation, NCAM180 is preferentially found at cell-to-cell contacts and is thought to contribute to organize stable synapses in the mature neuron through the interaction of its cytosolic domain with spectrin (35–39). Interestingly, studies in mammalian hippocampus and in Aplysia species suggest that regulation of ncam alternative splicing is involved in long-term plasticity processes (40–42).
We therefore wondered whether NCAM E18 splicing could be modulated by neuronal activity and, should this be the case, if such modulation could be related to the transcriptional quality and the chromatin structure in the ncam gene.
Results and Discussion
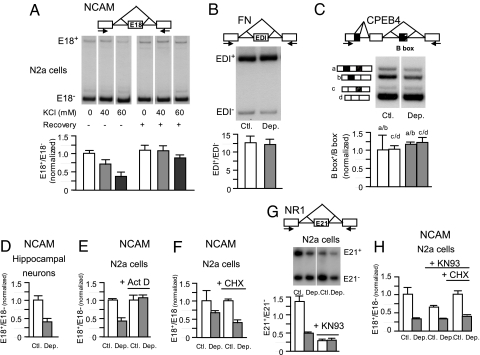
To explore a putative regulation of the alternative splicing of NCAM E18 by means of neural activity, we treated the murine neuroblastoma cell line N2a with increasing concentrations of extracellular KCl, extracted total RNA, and assessed splicing patterns using radioactive semi-quantitative RT-PCR (RT-sqPCR). As shown in Fig. 1A, depolarization of N2a cells with 40 or 60 mM KCl induced E18 skipping, which can be reverted by incubating the cells in the absence of extra K+ (i.e., normal medium recovery) for a further 20 h. The effect on splicing is not caused by osmotic stress of the cells, because incubation with similar concentrations of NaCl does not affect ncam splicing (not shown).
Fig. 1.
Depolarization promotes NCAM E18 skipping in new transcripts independently of protein synthesis and of CaMKIV inhibition. N2a cells were treated with different concentrations (A) or 60 mM KCl (B, C, and E–H) for 16 h. (D) Rat cultured hippocampal neurons were treated with 40 mM KCl for 20 h or left untreated. After these treatments, cells were harvested, total RNA prepared, and alternative splicing for the indicated genes was assessed with specific primers by a 30-cycle radioactive RT-sqPCR (A–C and G) or real-time RT-qPCR (D–F and H) as described in Materials and Methods. In A, half the cells were harvested and the other half were incubated in normal medium for another 20 h (Recovery). Treatments in E–H were performed in the presence or absence of the transcription inhibitor actinomycin D (Act D; 5 μg/mL), the protein inhibitor CHX (5 μg/mL), or the CaMKIV inhibitor KN93 (20 μM) as indicated. (CPEB4, cytoplasmic polyadenylation element binding protein 4; NR1, NMDA receptor 1; Ctl., control; Dep., depolarization.) Bars show means ± SD corresponding to 2 or 3 independent experiments.
As the unusually large size of the E18 (801 nt) lowers the PCR amplification efficiency of the inclusion product, the E18 inclusion/exclusion ratio observed in Fig. 1A does not correspond to the actual ratio, which in these cells is approximately 30% inclusion (43). Nevertheless, radioactive RT-sqPCR faithfully reproduced the ratio differences between treatments, as validated by quantitative real-time PCR analysis [RT-qPCR; supporting information (SI) Fig. S1]. Therefore, radioactive PCR or real-time PCR were used indistinctly in this report.
The effect of depolarization on NCAM E18 seems to be gene-specific, as alternative splicing of the fibronectin (FN) EDI cassette exon (Fig. 1B) and of the 4 isoform of the cytoplasmic polyadenylation element binding protein (Fig. 1C) are not affected by KCl treatment in N2a cells. FN was chosen because its regulation by cis and transacting factors is well studied, and the 4 isoform of the cytoplasmic polyadenylation element binding protein was chosen for being a neuron-specific translational regulator responsive to neurotransmission (44).
To assess if primary-cultured neurons are equally affected by depolarization, we cultured hippocampal neurons from rat embryos for 6 to 7 days and performed a similar treatment. In this case, a 20-h treatment with 40 mM KCl gives the most reproducible results, showing similar results to N2a cells (Fig. 1D).
The depolarization effect is abolished when the generation of new transcripts is inhibited by adding actinomycin D (Act D), indicating that the isoform change is not caused by differential mRNA stability (Fig. 1E). To the contrary, the protein synthesis inhibitor cycloheximide (CHX) did not prevent the skipping of E18 triggered by KCl (Fig. 1F). This indicates that the effect does not require de novo protein synthesis and suggests a direct mechanism that cannot result from changes in the expression of splicing regulators. However, this experiment does not rule out putative changes in the activity of splicing factors caused by covalent modifications. Probably the best characterized of such modifications is the phosphorylation of factors regulating the alternative splicing of the NMDA receptor 1 exon 21 (E21) by CaMKIV. Confirming previous observations (24), the CaMKIV inhibitor KN93 completely abolishes the regulation by depolarization of NMDA receptor E21 alternative splicing by inhibiting basal E21 inclusion (Fig. 1G). To the contrary, KN93 does not inhibit the effect on NCAM E18 in the presence of CHX and does it only partially in its absence (Fig. 1H). These experiments suggest the existence of a mechanism alternative or complementary to the CaMKIV pathway.
Transcription Elongation Modulates E18 Inclusion.
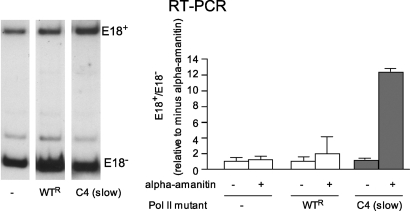
To test if NCAM E18 splicing is affected by the pol II elongation rate, we co-transfected N2a cells with an NCAM splicing reporter mini-gene, harboring exons 17 to 19 and the introns between, and plasmids expressing α-amanitin resistant polymerases: a mutant “slow” pol II (mutant C4) or a WT pol II (11). In this system, endogenous pol II transcription is blocked by α-amanitin and the splicing patterns generated by transcription by the recombinant polymerases can be assessed. In agreement with previous evidence for the EDI exon (11), when transcription is driven by the slow pol II, inclusion of NCAM E18 is increased 6-fold (Fig. 2), indicating that E18 splicing is affected by pol II elongation and that its regulation can be interpreted in light of the kinetic model (4).
Fig. 2.
Transcription by C4 “slow” RNA pol II increases E18 inclusion. An NCAM splicing reporter mini-gene was co-transfected in N2a cells with an empty plasmid (-) or plasmids expressing WT or C4 α-amanitin-resistant RNA pol II large subunits. Cells were treated with α-amanitin to inhibit endogenous polymerase. Splicing patterns were assessed by a 30-cycle radioactive RT-sqPCR. Left and right panels correspond to independent experiments. Bars show means ± SD (n = 2).
Histone Modification Patterns.
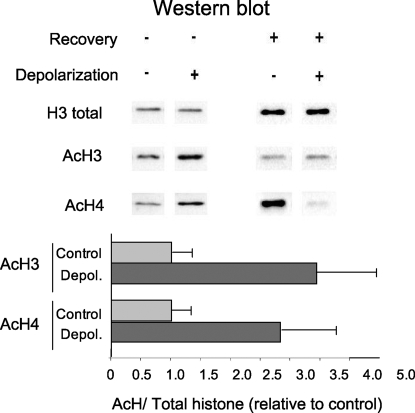
A major signature of transcriptional regulation is histone acetylation. To investigate if NCAM E18 splicing could be modulated in our system by a change in the histone acetylation patterns, we first performed Western blot analysis of H3 and H4 global acetylation in histone extracts from N2a cells treated for 6 to 8 h with 60 mM KCl. The results show an increase in global acetylation of 2.5- and 3.5-fold for histones H4 and H3, respectively (Fig. 3). Paralleling the splicing regulation, this effect is reversed by incubation for a further 20 h in normal medium.
Fig. 3.
Depolarization triggers reversible general histone acetylation. N2a cells were treated for 6 to 8 h with 60 mM KCl (Depol) or left untreated (Control), and Western blot with antibodies for acetyl-histones H3 and H4, and total histone H3, were performed as indicated in Materials and Methods. Quantification of the increase in histone acetylation corresponding to the pooled data of 2 independent experiments is shown (means ± SD; n = 2). After the treatment, some cells were incubated for 20 more hours in normal medium (Recovery).
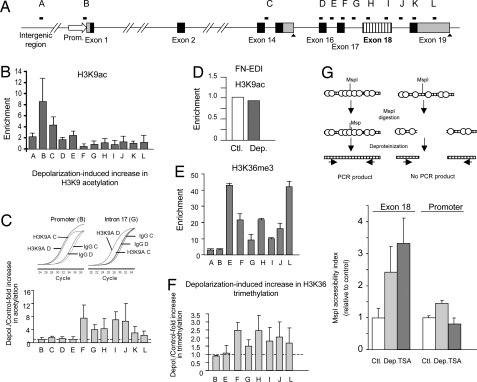
The global change in histone acetylation reflects an average of different local changes occurring all throughout the genome. To get a picture of how the ncam locus is affected, we performed native chromatin immunoprecipitation (nChIP) (52) with antibodies recognizing acetylated histones, using primers distributed along the gene to evaluate enrichments by quantitative PCR (Fig. 4A). The patterns of H3 lysine 9 (H3K9ac; Fig. 4B) and H4 (Fig. S2A) acetylation in untreated cells are comparable and characterized by low levels of acetylation toward the 3′ region of the gene, between exons 17 and 19. More impressively, H3K9ac increases specifically in that region in response to depolarization (Fig. 4C), indicating that a localized change in intragenic chromatin structure is triggered by the treatment, which is not paralleled by an acetylation increase at the promoter region.
Fig. 4.
Depolarization triggers local changes in histone modifications and chromatin structure assessed by nChIP. (A) Scheme of the ncam gene showing the distribution of qPCR amplicons. (B) Levels of H3K9 acetylation at the regions indicated in A, corresponding to untreated N2a cells. (C) Increase of H3K9 acetylation in the same regions in response to depolarization with 60 mM KCl for 4 to 6 h. Inset, qPCR amplification curves from control (C) and depolarized (D) samples corresponding to a non-responding region (i.e., promoter) and a region that shows increased acetylation levels after depolarization (i.e., intron 17) (D) Negative control showing no changes in H3K9 acetylation on the FN gene at the EDI alternative exon. Means and SD correspond to 2 or 3 independent experiments. (E) Representative levels of H3K36 tri-methylation at the regions indicated in A, corresponding to untreated N2a cells. (F) Increase of H3K36 tri-methylation in the same regions in response to depolarization with 60 mM KCl for 6 h. Means and SD correspond to 2 independent immunoprecipitations of 1 experiment. (G) Scheme of the MspI accessibility assay used (Upper) and bar graph depicting the changes in chromatin accessibility (Lower). Cells were treated for 5 h with 60 mM KCl (Dep) or 1 μM TSA or left untreated (Ctl). The accessibility index was evaluated (see Materials and Methods) for the NCAM exon 18 region and a promoter region. Results are expressed relative to value obtained in each amplicon for the control cells.
No changes in H3K9ac were detected at other regions of the ncam gene (exons 2 and 5, not shown), nor at the elongation-responsive, but depolarization-unresponsive (Fig. 1B), EDI exon of the FN gene (Fig. 4D). No significant increase in H4 acetylation at any particular region of the ncam locus was detected (Fig. S2B).
We performed additional nChIP studies using antibodies recognizing methylation at different lysines of histone H3. Assessment of H3K9 di- and tri-methylation and H3K27 tri-methylation revealed expected patterns for an active gene: high H3K9 tri-methylation in the upstream regions and low H3K9 di-methylation and H3K27 tri-methylation (both markers of facultative heterochromatin) throughout the entire locus (Fig. S2 C–E). No reproducible changes were detected for these marks along the ncam gene in response to depolarization (not shown). To the contrary, analysis of H3K36 tri-methylation revealed changes with depolarization. As expected for this transcription elongation-associated mark (45), we observed low levels of H3K36 tri-methylation at the promoter and upstream region and increased levels in the transcribed region (Fig. 4E). In response to depolarization, we detected an increase of this marker in the distal regions of the ncam locus (Fig. 4F).
Depolarization Causes Increased Chromatin Accessibility.
The observed nChIP acetylation patterns suggest that the region between exons 17 and 19 is basally embedded in a more compact chromatin conformation than the rest of the gene, which is at least partially relieved by depolarization. To test this hypothesis, we performed an accessibility assay using the restriction endonuclease MspI, an enzyme that cuts naked DNA at CCGG sequences irrespective of the DNA methylation status, but is sensitive to closed chromatin conformations when digesting DNA on intact nuclei (17). Chromatin from depolarized cells showed increased accessibility for MspI digestion at the exon 18 region compared with that from untreated cells (Fig. 4G Left), consistent with an opening of chromatin structure. A similar effect was achieved by digesting nuclei from cells treated with the hyper-acetylating drug trichostatin A (TSA; an inhibitor of histone deacetylases). MspI analysis at the promoter region showed little or no effect in chromatin accessibility for both depolarization and TSA treatments (Fig. 4G Right), consistent with the lack of changes in the acetylation levels and the notion that chromatin associated with the promoter of an active gene is normally relaxed.
Depolarization and Distal/Proximal Pre-mRNA Distribution.
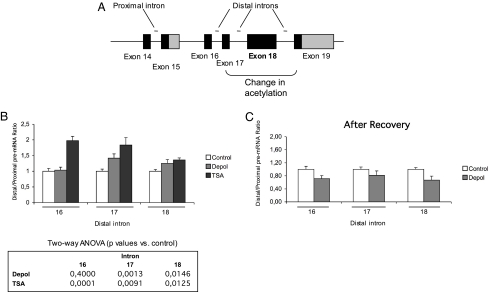
Measuring changes in pol II elongation or processivity on a given gene and under a particular stimulus is a technically difficult task. An indirect way for assessing pol II processivity is to measure the abundance of distal versus proximal pre-mRNAs in a given region, with the assumption that most pre-mRNA is a co-transcriptional intermediate (11). We chose intron 14 as a proximal site and measured the distal/proximal (D/P) pre-mRNA ratio for 3 different distal sites near the area affected by depolarization: introns 16, 17, and 18 (Fig. 5A). As shown in Fig. 5B, depolarization induced moderate but statistically significant increases in intron 17 D/P ratio and intron 18 D/P ratio. No significant effect was detected for intron 16. In agreement with results in Figs. 1A and 3, the recovery of N2a cells in normal medium after the depolarization treatment abolishes the observed increase in D/P ratios (Fig. 5C). These results might be consistent with an increased pol II processivity at the area affected by the acetylation changes. The possibility that the observed changes are caused by differential intron removal rates seems unlikely as no correlation between unspliced/spliced RNA ratio and D/P ratio was found (not shown). Treatment of N2a cells with TSA has similar effects to depolarization on D/P ratios for introns 17 and 18, and an even more pronounced effect on intron 16 D/P ratio. Because intron 16 is located outside the region whose chromatin is affected by depolarization (Fig. 4C), these experiments are coherent with a broader histone acetylation triggered by TSA in comparison with a more localized one caused by depolarization, whose exact mechanism remains to be determined.
Fig. 5.
Depolarization and histone acetylation increase RNA pol II processivity. (A) Scheme showing the proximal and distal amplicons used for qPCR assessment. (B) Increase in D/P pre-mRNA accumulation. Cells were treated for 4 to 6 h with high KCl (Depol) or TSA (3.3 μM). Bars correspond to the normalized means and SEs for the pooled data of 3 (Control and Depol) or 2 different experiments (TSA). The table below shows the results of a 2-way ANOVA used to analyze statistical significance, considering the different treatments as one factor and the different experiments as the other factor (no significant effect of experiment or interaction between the two was found). (C) Depolarization after recovery in normal medium. Cells were treated for 4 h and recovered in normal medium for 20 more hours. Bars correspond to the normalized means and SEs of one experiment in triplicate.
Changes in chromatin structure and histone modifications have been generally associated to promoters and therefore to transcription initiation. The depolarization-induced change seen in the ncam gene seems to be restricted to intragenic regions instead. Our results postulate alternative splicing regulation as an additional step of the mRNA biogenesis coupled to chromatin structure. At the same time, transcription elongation modifies chromatin landscapes by means of different proteins associated with the elongation complex. For example, the yeast histone methyl-transferase Set2, which mediates H3K36 methylation, associates preferentially with the elongating Ser-2-phsophorylated pol II (46, 47). In mammals, the same function is associated with the HYPB/Setd2 enzyme (48). These observations are coincident with the increase in H3K36me3 reported here (Fig. 4E), further supporting the notion that chromatin modifications exert a positive influence on transcription elongation. It is known that, in yeast, the histone deacetylase complex Rpd3S is recruited by this mark and reverts transcription-associated acetylation to repress cryptic initiation (49, 50). However, the increase observed for H3K36me3 correlates in our system with a more accessible chromatin, at least at the times assessed.
Trichostatin A Mimics and Potentiates Depolarization Effect on Splicing.
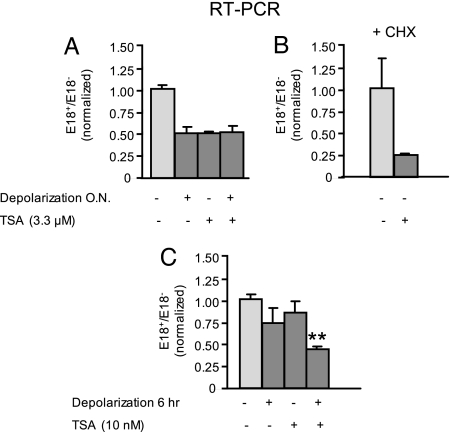
Results in Figs. 4 and 5 suggest that the decrease in NCAM E18 inclusion in response to depolarization is caused by a local opening of chromatin. A derived hypothesis would be that inducing histone acetylation and chromatin opening directly with TSA should mimic the depolarization effect. Accordingly, when N2a cells are treated with TSA, E18 skipping is enhanced like it is with depolarization (Fig. 6A). The effect is maintained in the presence of CHX, indicating that TSA is not acting indirectly (Fig. 6B). Moreover, no additive effect in E18 inclusion is seen when both treatments are applied together, further suggesting that they are acting through the same mechanism and that either one can result in full effect (Fig. 6A, last bar). In this scenario, if both treatments were applied together in suboptimal conditions, there should be a synergistic interaction. To test this, we used a very low TSA concentration and a shorter KCl incubation period. Although neither treatment had a significant effect on its own (Fig. 6C), when they are used in combination, a consistent and significant decrease in E18 inclusion was observed, confirming that they act synergistically (Fig. 6C, last bar). These results are in strong agreement with the model proposed, suggesting that histone acetylation participates directly or facilitates the depolarization-induced regulation of NCAM E18 alternative splicing.
Fig. 6.
TSA treatment mimics and potentiates the depolarization effect on NCAM E18 alternative splicing. (A) N2a cells were treated for 16 h with 60 mM KCl (Depolarization), 3.3 μM TSA, or both, or left untreated (n = 2 for control and n = 3 for depolarization treatment). (B) N2a cells were treated with 3.3 μM TSA or vehicle in the presence of CHX (n = 2). (C) N2a cells were treated for 6 h with 60 mM KCl, 10 nM TSA, or both, or left untreated (n = 3; **Student t test, P < 0.0001 vs. control, P < 0.005 vs. TSA, P < 0.05 vs. depolarization). NCAM E18 splicing patterns were assessed as before (means ± SD).
Mechanistic Implications.
The alternative exon we have studied here shows a clear decrease in inclusion in response to depolarization, both in hippocampal neurons and neuroblastoma cells (Fig. 1 A and D). These changes are not dependent on the CaMKIV pathway (Fig. 1H) and are paralleled by histone marks usually associated with active transcription (Fig. 4). They are also reproduced and potentiated by the use of the HDAC inhibitor TSA (Fig. 6). The possibility that depolarization or TSA treatments would be acting indirectly through changes in the expression of other proteins seems unlikely because both effects persist when translation is inhibited (Figs. 1D and 6B). Considering that processivity and/or elongation rates have a direct effect on NCAM splicing (Fig. 3), one possible mechanism predicted by our experiments is that depolarization is able to affect alternative splicing choices through changes in transcription, in agreement with the kinetic model of transcription-coupled splicing modulation (14).
As mentioned earlier, depolarization can regulate alternative splicing through the recruitment of trans-acting factors to specific RNA sequences (19). The pathways are not mutually exclusive and could easily act in a concerted way. For example, when the availability of permissive or repressive splicing factors is low, the timing of transcription and RNA target sequence exposure could be critical for the splicing outcome. In this situation, local changes in transcription elongation can therefore reinforce splicing choices that are also regulated by trans-acting splicing factors.
Although continuous incubation of cultured cells with high extracellular K+ is not a physiological condition per se, its use allowed us to find a pathway leading to an increase in NCAM140 isoform in response to neuronal excitation. Our results place the kinetic coupling of alternative splicing and transcription in a more physiological context by demonstrating how an external signal modulates this coupling by promoting specific epigenetic changes inside the ncam gene.
Materials and Methods
Cell Culture.
N2a cells were grown in DMEM (Invitrogen) supplemented with 10% FBS. Dissociated cultures of hippocampal pyramidal cells were obtained from 18-d rat embryos as described (51) and cultured for 5 to 7 d before treatment in DMEM supplemented with 0.1% ovalbumin and B27 and N2 supplements (Sigma).
Splicing Evaluation.
RNA preparation, reverse transcription, and radioactive semiquantitative RT-PCR were as previously described (10). For real-time qPCR evaluation of splicing, separate reactions for inclusion and exclusion isoforms were performed for each sample. Primer sequences and PCR conditions are described in SI Text.
Western Blot.
Acid-soluble nuclear proteins were purified and Western blot analysis was performed according to the instructions of the antibody manufacturer. We used primary antibodies for acetyl-H3 and H4 (06–599 and 06–866; Upstate) or total H3 (07–690; Upstate), and secondary HRP-conjugated anti-rabbit IgG antibody (170–6515; Bio-Rad). SuperSignal West Dura Extended Duration Substrate (Pierce) was used to develop the HRP reaction.
Pharmacological Treatments.
Trichostatin A (Sigma) was diluted in ethanol and used at the indicated concentrations. The activity of the drug was assessed by acetyl-histone-specific Western blot. Cycloheximide (Sigma) and actinomycin D (Invitrogen) were used at 5 μg/mL.
Plasmids and Transfection.
Reporter mini-gene of ncam splicing was constructed (see SI Text) from the pBALdef plasmid, which was provided by Benoit Chabot (Sherbrooke, QC, Canada). Co-transfection of mini-gene reporter and mutant polymerases was as previously described (11). Approximately 400,000 to 500,000 N2a cells were transfected with 2 μg of total DNA and 4 μL of Lipofectamine (Invitrogen) for each well of a 6-well plate. α-Amanitin was added 24 h after transfection and cells were harvested 24 h after drug addition.
nChIP.
Mono-nucleosome preparation and nChIP were performed as described (52). Fifteen micrograms of DNA were used as input mono-nucleosomes for immunoprecipitations. Details are described in SI Text. Relative enrichments were calculated dividing bound/unbound antibody by bound/unbound IgG. To compare between treatments, amplicon values within each treatment were normalized to those corresponding for an intragenic amplicon.
D/P Pre-mRNA Evaluation.
Four different RT reactions were performed on nuclear RNA, using primers for intron-exon junctions to enrich cDNA population in products corresponding to Pre-mRNAs. The resulting cDNAs corresponding to introns 14, 16, 17, and 18 were then quantified by qPCR using the same primers and conditions as in the ChIP experiments. All results were expressed as D/P ratios, with intron 14 taken as the proximal region and all other introns as the distal regions.
MspI Accessibility Assay.
We used a modification of the method used by Lorincz et al. (17), as detailed in SI Text. Cleavage was assessed by real-time qPCR, using primer sets for 3 different amplicons: one for exon 18 region (UncutE18; harboring 2 MspI recognition sequences), one for promoter region (UncutProm; harboring 3 MspI recognition sequences), and one for total DNA (TotalDNA; with no MspI recognition sites). Accessibility index was calculated independently for exon 18 and promoter regions as follows: (average uncut/total ratio of samples without MspI)/(average uncut/total ratio of samples with MspI).
Supplementary Material
Acknowledgments.
We thank V. Buggiano for her invaluable help and M. Blaustein, J. Fededa, M. de la Mata, M. Muñoz, E. Petrillo, G. Risso, A. Srebrow, and L. Durrieu for their support and useful discussions. We also thank B. Chabot for plasmids provided, and F. Bollati and A. Cáceres for their technical assistance with hippocampal pyramidal cell cultures. This work was supported by grants from the Fundación Antorchas (A.R.K.), the Agencia Nacional de Promoción de Ciencia y Tecnología of Argentina (A.R.K.), the Universidad de Buenos Aires (A.R.K.), and the European Alternative Splicing Network (EURASNET) (A.R.K.). I.E.S., F.P., and M.A. are recipients of fellowships and A.R.K. is a career investigator from the Consejo Nacional de Investigaciones Científicas y Técnicas of Argentina (CONICET). A.R.K. is an international research scholar of the Howard Hughes Medical Institute.
Footnotes
The authors declare no conflict of interest.
This article is a PNAS Direct Submission.
This article contains supporting information online at www.pnas.org/cgi/content/full/0810666106/DCSupplemental.
References
- 1.Proudfoot NJ, et al. Integrating mRNA processing with transcription. Cell. 2002;108:501–512. doi: 10.1016/s0092-8674(02)00617-7. [DOI] [PubMed] [Google Scholar]
- 2.Neugebauer KM. On the importance of being co-transcriptional. J Cell Sci. 2002;115:3865–3871. doi: 10.1242/jcs.00073. [DOI] [PubMed] [Google Scholar]
- 3.Bentley DL. Rules of engagement: co-transcriptional recruitment of pre-mRNA processing factors. Curr Opin Cell Biol. 2005;17:251–256. doi: 10.1016/j.ceb.2005.04.006. [DOI] [PubMed] [Google Scholar]
- 4.Kornblihtt AR. Promoter usage and alternative splicing. Curr Opin Cell Biol. 2005;17:262–268. doi: 10.1016/j.ceb.2005.04.014. [DOI] [PubMed] [Google Scholar]
- 5.de la Mata M, Kornblihtt AR. RNA polymerase II C-terminal domain mediates regulation of alternative splicing by SRp20. Nat Struct Mol Biol. 2006;13:973–980. doi: 10.1038/nsmb1155. [DOI] [PubMed] [Google Scholar]
- 6.Millhouse S, Manley JL. The C-terminal domain of RNA polymerase II functions as a phosphorylation-dependent splicing activator in a heterologous protein. Mol Cell Biol. 2005;25:533–544. doi: 10.1128/MCB.25.2.533-544.2005. [DOI] [PMC free article] [PubMed] [Google Scholar]
- 7.Monsalve M, et al. Direct coupling of transcription and mRNA processing through the thermogenic coactivator PGC-1. Mol Cell. 2000;6:307–316. doi: 10.1016/s1097-2765(00)00031-9. [DOI] [PubMed] [Google Scholar]
- 8.Roberts GC, et al. Co-transcriptional commitment to alternative splice site selection. Nucleic Acids Res. 1998;26:5568–5572. doi: 10.1093/nar/26.24.5568. [DOI] [PMC free article] [PubMed] [Google Scholar]
- 9.Eperon LP, et al. Effects of RNA secondary structure on alternative splicing of pre-mRNA: is folding limited to a region behind the transcribing RNA polymerase? Cell. 1988;54:393–401. doi: 10.1016/0092-8674(88)90202-4. [DOI] [PubMed] [Google Scholar]
- 10.Kadener S, et al. Antagonistic effects of T-Ag and VP16 reveal a role for RNA pol II elongation on alternative splicing. EMBO J. 2001;20:5759–5768. doi: 10.1093/emboj/20.20.5759. [DOI] [PMC free article] [PubMed] [Google Scholar]
- 11.de la Mata M, et al. A slow RNA polymerase II affects alternative splicing in vivo. Mol Cell. 2003;12:525–532. doi: 10.1016/j.molcel.2003.08.001. [DOI] [PubMed] [Google Scholar]
- 12.Nogués G, et al. Influence of polymerase II processivity on alternative splicing depends on splice site strength. J Biol Chem. 2003;278:52166–52171. doi: 10.1074/jbc.M309156200. [DOI] [PubMed] [Google Scholar]
- 13.Cramer P, et al. Functional association between promoter structure and transcript alternative splicing. Proc Natl Acad Sci USA. 1997;94:11456–11460. doi: 10.1073/pnas.94.21.11456. [DOI] [PMC free article] [PubMed] [Google Scholar]
- 14.Kornblihtt AR. Chromatin, transcript elongation and alternative splicing. Nat Struct Mol Biol. 2006;13:5–7. doi: 10.1038/nsmb0106-5. [DOI] [PubMed] [Google Scholar]
- 15.Sims RJ, III, et al. Recognition of trimethylated histone H3 lysine 4 facilitates the recruitment of transcription postinitiation factors and pre-mRNA splicing. Mol Cell. 2007;28:665–676. doi: 10.1016/j.molcel.2007.11.010. [DOI] [PMC free article] [PubMed] [Google Scholar]
- 16.Batsche E, et al. The human SWI/SNF subunit Brm is a regulator of alternative splicing. Nat Struct Mol Biol. 2006;13:22–29. doi: 10.1038/nsmb1030. [DOI] [PubMed] [Google Scholar]
- 17.Lorincz MC, et al. Intragenic DNA methylation alters chromatin structure and elongation efficiency in mammalian cells. Nat Struct Mol Biol. 2004;11:1068–1075. doi: 10.1038/nsmb840. [DOI] [PubMed] [Google Scholar]
- 18.Ule J, Darnell RB. RNA binding proteins and the regulation of neuronal synaptic plasticity. Curr Opin Neurobiol. 2006;16:102–110. doi: 10.1016/j.conb.2006.01.003. [DOI] [PubMed] [Google Scholar]
- 19.Li Q, et al. Neuronal regulation of alternative pre-mRNA splicing. Nat Rev Neurosci. 2007;8:819–831. doi: 10.1038/nrn2237. [DOI] [PubMed] [Google Scholar]
- 20.Liu SJ, Kaczmarek LK. The expression of two splice variants of the Kv3.1 potassium channel gene is regulated by different signaling pathways. J Neurosci. 1998;18:2881–2890. doi: 10.1523/JNEUROSCI.18-08-02881.1998. [DOI] [PMC free article] [PubMed] [Google Scholar]
- 21.Rozic-Kotliroff G, Zisapel N. Ca2+ -dependent splicing of neurexin IIalpha. Biochem Biophys Res Commun. 2007;352:226–230. doi: 10.1016/j.bbrc.2006.11.008. [DOI] [PubMed] [Google Scholar]
- 22.Xie J, Black DL. A CaMK IV responsive RNA element mediates depolarization-induced alternative splicing of ion channels. Nature. 2001;410:936–939. doi: 10.1038/35073593. [DOI] [PubMed] [Google Scholar]
- 23.An P, Grabowski PJ. Exon silencing by UAGG motifs in response to neuronal excitation. PLoS Biol. 2007;5:e36. doi: 10.1371/journal.pbio.0050036. [DOI] [PMC free article] [PubMed] [Google Scholar]
- 24.Lee JA, et al. Depolarization and CaM kinase IV modulate NMDA receptor splicing through two essential RNA elements. PLoS Biol. 2007;5:e40. doi: 10.1371/journal.pbio.0050040. [DOI] [PMC free article] [PubMed] [Google Scholar]
- 25.Levenson JM, Sweatt JD. Epigenetic mechanisms in memory formation. Nat Rev Neurosci. 2005;6:108–118. doi: 10.1038/nrn1604. [DOI] [PubMed] [Google Scholar]
- 26.Fischer A, et al. Recovery of learning and memory is associated with chromatin remodelling. Nature. 2007;447:178–182. doi: 10.1038/nature05772. [DOI] [PubMed] [Google Scholar]
- 27.Alarcon JM, et al. Chromatin acetylation, memory, and LTP are impaired in CBP+/- mice: a model for the cognitive deficit in Rubinstein-Taybi syndrome and its amelioration. Neuron. 2004;42:947–959. doi: 10.1016/j.neuron.2004.05.021. [DOI] [PubMed] [Google Scholar]
- 28.Guan Z, et al. Integration of long-term-memory-related synaptic plasticity involves bidirectional regulation of gene expression and chromatin structure. Cell. 2002;111:483–493. doi: 10.1016/s0092-8674(02)01074-7. [DOI] [PubMed] [Google Scholar]
- 29.Korzus E, et al. CBP histone acetyltransferase activity is a critical component of memory consolidation. Neuron. 2004;42:961–972. doi: 10.1016/j.neuron.2004.06.002. [DOI] [PMC free article] [PubMed] [Google Scholar]
- 30.Chwang WB, et al. The nuclear kinase mitogen- and stress-activated protein kinase 1 regulates hippocampal chromatin remodeling in memory formation. J Neurosci. 2007;27:12732–12742. doi: 10.1523/JNEUROSCI.2522-07.2007. [DOI] [PMC free article] [PubMed] [Google Scholar]
- 31.Levenson JM, et al. Regulation of histone acetylation during memory formation in the hippocampus. J Biol Chem. 2004;279:40545–40559. doi: 10.1074/jbc.M402229200. [DOI] [PubMed] [Google Scholar]
- 32.Cunningham BA, et al. Neural cell adhesion molecule: structure, immunoglobulin-like domains, cell surface modulation, and alternative RNA splicing. Science. 1987;236:799–806. doi: 10.1126/science.3576199. [DOI] [PubMed] [Google Scholar]
- 33.Pollerberg GE, et al. Differentiation state-dependent surface mobilities of two forms of the neural cell adhesion molecule. Nature. 1986;324:462–465. doi: 10.1038/324462a0. [DOI] [PubMed] [Google Scholar]
- 34.Pollerberg EG, et al. Selective expression of the 180-kD component of the neural cell adhesion molecule N-CAM during development. J Cell Biol. 1985;101:1921–1929. doi: 10.1083/jcb.101.5.1921. [DOI] [PMC free article] [PubMed] [Google Scholar]
- 35.Buttner B, et al. Cytoplasmic domain of NCAM 180 reduces NCAM-mediated neurite outgrowth. J Neurosci Res. 2004;75:854–860. doi: 10.1002/jnr.20049. [DOI] [PubMed] [Google Scholar]
- 36.Persohn E, Schachner M. Immunohistological localization of the neural adhesion molecules L1 and N-CAM in the developing hippocampus of the mouse. J Neurocytol. 1990;19:807–819. doi: 10.1007/BF01186812. [DOI] [PubMed] [Google Scholar]
- 37.Polo-Parada L, et al. Distinct roles of different neural cell adhesion molecule (NCAM) isoforms in synaptic maturation revealed by analysis of NCAM 180 kDa isoform-deficient mice. J Neurosci. 2004;24:1852–1864. doi: 10.1523/JNEUROSCI.4406-03.2004. [DOI] [PMC free article] [PubMed] [Google Scholar]
- 38.Sytnyk V, et al. Neural cell adhesion molecule promotes accumulation of TGN organelles at sites of neuron-to-neuron contacts. J Cell Biol. 2002;159:649–661. doi: 10.1083/jcb.200205098. [DOI] [PMC free article] [PubMed] [Google Scholar]
- 39.Sytnyk V, et al. NCAM promotes assembly and activity-dependent remodeling of the postsynaptic signaling complex. J Cell Biol. 2006;174:1071–1085. doi: 10.1083/jcb.200604145. [DOI] [PMC free article] [PubMed] [Google Scholar]
- 40.Mayford M, et al. Modulation of an NCAM-related adhesion molecule with long-term synaptic plasticity in Aplysia. Science. 1992;256:638–644. doi: 10.1126/science.1585176. [DOI] [PubMed] [Google Scholar]
- 41.Schacher S, et al. Cell-specific changes in expression of mRNAs encoding splice variants of Aplysia cell adhesion molecule accompany long-term synaptic plasticity. J Neurobiol. 2000;45:152–161. doi: 10.1002/1097-4695(20001115)45:3<152::aid-neu3>3.0.co;2-0. [DOI] [PubMed] [Google Scholar]
- 42.Hoffman KB, et al. Delayed and isoform-specific effect of NMDA exposure on neural cell adhesion molecules in hippocampus. Neurosci Res. 2001;39:167–173. doi: 10.1016/s0168-0102(00)00214-5. [DOI] [PubMed] [Google Scholar]
- 43.Tacke R, Goridis C. Alternative splicing in the neural cell adhesion molecule pre-mRNA: regulation of exon 18 skipping depends on the 5′-splice site. Genes Dev. 1991;5:1416–1429. doi: 10.1101/gad.5.8.1416. [DOI] [PubMed] [Google Scholar]
- 44.Huang YS, et al. CPEB3 and CPEB4 in neurons: analysis of RNA-binding specificity and translational control of AMPA receptor GluR2 mRNA. EMBO J. 2006;25:4865–4876. doi: 10.1038/sj.emboj.7601322. [DOI] [PMC free article] [PubMed] [Google Scholar]
- 45.Bannister AJ, et al. Spatial distribution of di- and tri-methyl lysine 36 of histone H3 at active genes. J Biol Chem. 2005;280:17732–17736. doi: 10.1074/jbc.M500796200. [DOI] [PubMed] [Google Scholar]
- 46.Krogan NJ, et al. Methylation of histone H3 by Set2 in Saccharomyces cerevisiae is linked to transcriptional elongation by RNA polymerase II. Mol Cell Biol. 2003;23:4207–4218. doi: 10.1128/MCB.23.12.4207-4218.2003. [DOI] [PMC free article] [PubMed] [Google Scholar]
- 47.Xiao T, et al. Phosphorylation of RNA polymerase II CTD regulates H3 methylation in yeast. Genes Dev. 2003;17:654–663. doi: 10.1101/gad.1055503. [DOI] [PMC free article] [PubMed] [Google Scholar]
- 48.Edmunds JW, et al. Dynamic histone H3 methylation during gene induction: HYPB/Setd2 mediates all H3K36 trimethylation. EMBO J. 2008;27:406–420. doi: 10.1038/sj.emboj.7601967. [DOI] [PMC free article] [PubMed] [Google Scholar]
- 49.Joshi AA, Struhl K. Eaf3 chromodomain interaction with methylated H3–K36 links histone deacetylation to pol II elongation. Mol Cell. 2005;20:971–978. doi: 10.1016/j.molcel.2005.11.021. [DOI] [PubMed] [Google Scholar]
- 50.Keogh MC, et al. Cotranscriptional set2 methylation of histone H3 lysine 36 recruits a repressive Rpd3 complex. Cell. 2005;123:593–605. doi: 10.1016/j.cell.2005.10.025. [DOI] [PubMed] [Google Scholar]
- 51.Kunda P, et al. Evidence for the involvement of Tiam1 in axon formation. J Neurosci. 2001;21:2361–2372. doi: 10.1523/JNEUROSCI.21-07-02361.2001. [DOI] [PMC free article] [PubMed] [Google Scholar]
- 52.Umlauf D, et al. Site-specific analysis of histone methylation and acetylation. Methods Mol Biol. 2004;287:99–120. doi: 10.1385/1-59259-828-5:099. [DOI] [PubMed] [Google Scholar]
Associated Data
This section collects any data citations, data availability statements, or supplementary materials included in this article.


