

Abstract
Although it is appreciated that canonical signal-transduction pathways represent dominant modes of regulation embedded in larger interaction networks, relatively little has been done to quantify pathway cross-talk in such networks. Through quantitative measurements that systematically canvas an array of stimulation and molecular perturbation conditions, together with computational modeling and analysis, we have elucidated cross-talk mechanisms in the platelet-derived growth factor (PDGF) receptor signaling network, in which phosphoinositide 3-kinase (PI3K) and Ras/extracellular signal-regulated kinase (Erk) pathways are prominently activated. We show that, while PI3K signaling is insulated from cross-talk, PI3K enhances Erk activation at points both upstream and downstream of Ras. The magnitudes of these effects depend strongly on the stimulation conditions, subject to saturation effects in the respective pathways and negative feedback loops. Motivated by those dynamics, a kinetic model of the network was formulated and used to precisely quantify the relative contributions of PI3K-dependent and -independent modes of Ras/Erk activation.
Keywords: kinetic model, mitogen-activated protein kinase, phosphatidylinositol 3-kinase, receptor tyrosine kinase, signal transduction
Introduction
Signal transduction is traditionally characterized in terms of intracellular pathways, which govern outcomes such as cell proliferation, survival, migration, and differentiation. Cross-talk interactions, which couple distinct pathways, are recognized for their importance in cell regulation yet remain poorly defined because of their complex nature (Hunter, 2000). They allow information flow and regulation to be distributed across multiple pathways, and perturbations targeting specific signaling molecules might therefore have unexpected effects (Bray, 1990). Here, we describe the systematic and quantitative characterization of cross-talk between two major signaling pathways, phosphoinositide 3-kinase (PI3K) and Ras/extracellular signal-regulated kinase (Erk), which play prominent roles in signaling networks accessed by many cell surface receptors. Signaling mediated by platelet-derived growth factor (PDGF) receptors, members of the receptor tyrosine kinase class of signal transducers (Claesson-Welsh, 1994; Schlessinger, 2000), is relevant to wound healing, development, and cancer (Heldin and Westermark, 1999) and is distinguished by potent activation of type IA PI3Ks, which control a host of cellular responses through the production of specific lipid second messengers (Vanhaesebroeck et al, 2001; Engelman et al, 2006; Hawkins et al, 2006). PDGF receptors also enhance signaling through Ras proteins by promoting Ras guanine nucleotide exchange factor (Ras-GEF) activity and hence an increase in GTP-bound Ras; in this state, Ras activates the canonical Raf/mitogen-activated protein kinase (MAPK) or Erk kinase (MEK)/Erk cascade. Erk isoforms are both master integrators of upstream signals and master controllers of transcription factors and other effectors (Kolch, 2000).
Although cross-talk between the PI3K and Ras/Erk pathways has been studied extensively, a definitive pattern of regulation has not yet emerged, because the two pathways apparently affect each other in various ways and in a context-dependent manner. Despite striking evidence that PI3Ks bind to and are activated by Ras-GTP (Rodriguez-Viciana et al, 1994), the effects of blocking Ras signaling on growth factor-stimulated PI3K activation range from partial inhibition (Rodriguez-Viciana et al, 1994; Klinghoffer et al, 1996) to very little or no inhibition (Klippel et al, 1996; Kaur et al, 2006). Numerous reports have also implicated PI3K in the activation or regulation of Ras/Erk signaling, but again with disparate conclusions being drawn (discussed in Duckworth and Cantley, 1997). Although PI3K inhibitors apparently abrogate Erk activation but not Ras-GTP loading in certain contexts (Cross et al, 1994; Karnitz et al, 1995; Duckworth and Cantley, 1997; King et al, 1997), other reports indicate a role for PI3K upstream of Ras (Hu et al, 1995; DePaolo et al, 1996; Hawes et al, 1996; Wennström and Downward, 1999).
Through a kinetic analysis of PI3K and Ras/Erk signaling in the PDGF receptor system, complemented by quantitative modeling (Tyson et al, 2003; Ma'ayan et al, 2005; Kholodenko, 2006), we find that PI3K signaling affects Erk activation both upstream and downstream of Ras, and that Ras and PI3K account for most, if not all, of the pathways from PDGF receptors to Erk. The magnitudes of the Ras- and PI3K-dependent effects are shown to depend strongly on the stimulation conditions, in ways that are readily explained based on the saturability of the respective pathways and negative feedback mechanisms. Interestingly, cross-talk from the Ras/Erk pathway to PI3K is shown to be far less significant, an observation that we speculate is tied to the ability of PDGF receptors to directly and potently activate PI3K signaling. Through modeling and computation, the magnitudes of PI3K-dependent cross-talk mechanisms are quantified, and predictions are generated to inform further refinement of those mechanisms.
Results
Ras and PI3K make independent contributions to Erk signaling, whereas PI3K is effectively insulated from cross-talk
To systematically evaluate cross-talk between the PI3K and Ras/Erk pathways, Erk phosphorylation and PI3K-dependent Akt phosphorylation in PDGF-stimulated NIH 3T3 fibroblasts were measured by quantitative immunoblotting for an array of 126 experimental conditions, sampling different combinations of ligand dose, stimulation time, and molecular manipulation (Figures 1 and 2). Considering biological replicates and parallel determination of total Erk and Akt levels, this data set comprises 2772 total measurements. We have confirmed on multiple occasions that the immunoblot imaging system used produces a linear response as a function of epitope loaded, over a sufficiently broad dynamic range (unpublished results).
Figure 1.

Systematic analysis of PDGF-stimulated Erk phosphorylation kinetics. (A) Immunoblots, representative of five or six independent experiments, used to quantify relative amounts of phosphorylated Erk (p-Erk1/2) and total Erk (t-Erk1). NIH 3T3 fibroblasts were modulated by retroviral induction of dominant-negative (S17N) or constitutively active (G12V) H-Ras expression or incubation with inhibitors of PI3K (100 μM LY294002) or MEK (50 μM PD098059). The respective controls are empty pBM-puro vector or 0.2% DMSO. Lysates were prepared from cells that were unstimulated or stimulated with PDGF-BB for 5, 15, 30, 60, or 120 min. (B–E) Quantification of Erk phosphorylation, normalized as described under Materials and methods, comparing either S17N Ras expression (B; n=6), PI3K inhibition (C; n=5), G12V Ras expression (D; n=6), or MEK inhibition (E; n=5) with their respective controls. Values are reported as mean±s.e.m., and comparisons to control in (B, C) are by Student's t-test: *P<0.05; **P<0.01. Source data is available for this figure at www.nature.com/msb.
Figure 2.

Systematic analysis of PDGF-stimulated Akt phosphorylation kinetics. (A) Representative immunoblots used to quantify relative amounts of phosphorylated Akt (p-Akt) and total Akt (t-Akt) for the same set of experimental conditions as in Figure 1. (B–E) Quantification of Erk phosphorylation, normalized as described under Materials and methods, comparing either S17N Ras expression (B; n=6), MEK inhibition (C; n=5), G12V Ras expression (D; n=6), or PI3K inhibition (E; n=5) with their respective controls. Values are reported as mean±s.e.m. Source data is available for this figure at www.nature.com/msb.
The results reveal that when either Ras or PI3K is inhibited, by the expression of dominant-negative (S17N) H-Ras or incubation with LY294002 compound, respectively, PDGF-stimulated Erk phosphorylation is partially inhibited (Figure 1A–C). Expression of S17N H-Ras sequesters Ras-GEFs and thus affects activation of all Ras isoforms, and we confirmed previously that it prevents PDGF-stimulated Ras-GTP loading in our cells (Kaur et al, 2006); we also confirmed that the control compound LY303511, which is pharmacologically similar to LY294002 except that it does not inhibit PI3K (Knight et al, 2006; Gharbi et al, 2007), does not affect Erk phosphorylation significantly (Supplementary Figure S1). The degree of Erk inhibition depends strongly on both stimulation dose and time; no single combination of these conditions is indicative of the relative roles of Ras and PI3K in activating Erk. At short stimulation times, PI3K inhibition significantly affects Erk activation at low but not high PDGF concentrations, in accord with a previous study (Duckworth and Cantley, 1997); however, even at saturating PDGF concentrations, Erk phosphorylation in PI3K-inhibited cells is less sustained, with significantly lower values than the control at later stimulation times. The effects of Ras inhibition are similar, except that Erk phosphorylation is less sensitive to PDGF concentration and shows a lower initial rate at higher PDGF doses (compare Figure 1B and C). As we will show, these subtle differences in the kinetics between PI3K- and Ras-inhibited cells are indicative of distinct pathways integrated by Erk.
Expression of constitutively active (G12V) H-Ras yields not only an elevated level of Erk phosphorylation prior to stimulation but also a somewhat reduced responsiveness to PDGF (Figure 1D), consistent with high constitutive expression of MAPK phosphatase (MKP) as reported previously (Kaur et al, 2006); indeed, the basal expression of MKP-1 is roughly 17-fold higher in G12V Ras-expressing cells (results not shown). Thus, Erk signaling in these cells is the net result of both higher phosphorylation and higher dephosphorylation rates. Erk phosphorylation is mediated by both G12V H-Ras and PDGF-responsive signaling, which presumably includes activation of endogenous Ras isoforms and pathways that depend on PI3K.
By comparison, the PI3K pathway is not significantly activated through cross-talk from Ras. Neither expression of dominant-negative Ras nor application of the MEK inhibitor PD098059 has a significant effect on Akt phosphorylation (Figure 2A–C); the latter treatment is expected to enhance Ras-GTP loading by relieving feedback desensitization of the Ras-GEF mSos (Klarlund et al, 1995; Langlois et al, 1995; Waters et al, 1995), but the only effect of the drug is a slight reduction of the peak Akt phosphorylation. Expression of constitutively active Ras results in a higher basal Akt phosphorylation level in unstimulated cells but does not grossly affect PDGF-stimulated Akt phosphorylation. When Akt phosphorylation is far from saturation, the PDGF-stimulated response is incremented by the basal level, suggesting an approximately additive relationship; there is also evidence that the saturated Akt phosphorylation response is more sustained in G12V Ras-expressing cells (Figure 2D). Therefore, whereas inhibiting activation of endogenous Ras did not significantly affect PDGF-stimulated PI3K/Akt signaling in this study, high levels of Ras-GTP cooperate with PDGF receptors in a subtle way to activate this pathway (Jiménez et al, 2002; Kaur et al, 2006).
These results suggest two possible Erk activation mechanisms, or combinations thereof: Ras and PI3K promote Erk signaling independently, or PI3K lies upstream of Ras in the same pathway, in which case at least one additional pathway would be responsible for the residual Erk phosphorylation seen when either Ras or PI3K is inhibited. In each of three independent experiments, simultaneous inhibition of Ras and PI3K almost completely abolished PDGF-stimulated Erk phosphorylation, indicating that Ras and PI3K are responsible for all of the major pathways from PDGF receptors to Erk, and at least one mode of PI3K-dependent cross-talk to Erk operates in parallel with Ras (Figure 3). Incidentally, this result also provides further confirmation that Ras function is effectively blocked in our S17N Ras-expressing cells.
Figure 3.

Ras and PI3K account for all of the major PDGF-stimulated pathways that converge on Erk. NIH 3T3 fibroblasts were infected with retrovirus produced from empty vector or vector with S17N H-Ras, pretreated with either DMSO control or LY294002, then stimulated with PDGF-BB (dose and time indicated). Although inhibition of Ras or PI3K partially blocks Erk phosphorylation, consistent with Figure 1B and C, blocking both Ras and PI3K abolishes Erk phosphorylation. The results are representative of three independent experiments.
PI3K enhances Erk activation at points both upstream and downstream of Ras
Having established a role for PI3K-dependent signaling to Erk in parallel with Ras, we sought to determine whether or not PI3K also partially contributes to the PDGF receptor-mediated activation of Ras. Using a coupled enzymatic assay (Scheele et al, 1995; Kaur et al, 2006), we measured the kinetics of PDGF-stimulated Ras-GTP loading for selected conditions (Figure 4). In each of three independent experiments, incubation with LY294002 reduced the initial rate of Ras-GTP loading at a low PDGF concentration (50 pM), whereas Ras-GTP loading kinetics were minimally affected at 1 nM PDGF. Interestingly, the plateau level of Ras-GTP in PI3K-inhibited cells was similar to that of control cells, even at the lower dose of PDGF.
Figure 4.

Quantitative Ras-GTP loading measurements: characterization of PI3K-dependent cross-talk and Erk-dependent feedback regulation. NIH 3T3 fibroblasts were stimulated with PDGF-BB as indicated; pretreatments were control (0.2% DMSO), LY294002 (100 μM), or PD098059 (50 μM). Ras-GTP levels were measured using a quantitative enzymatic assay and normalized as described under Materials and methods; values are reported as mean±s.e.m. (n=3). Source data is available for this figure at www.nature.com/msb.
As alluded to in the previous section, Ras-GTP loading is affected by a known negative feedback loop that destabilizes Ras-GEF recruitment, and accordingly, incubation with PD098059 yields a higher Ras-GTP level (Figure 4). The feedback loop might also explain the effect of PI3K inhibition seen at lower PDGF concentrations. Erk phosphorylation is dramatically reduced under those conditions (Figure 1C), and thus the feedback regulation might be relieved. The net effect of reduced but stable Ras-GEF recruitment would be a lower initial rate and more sustained level of Ras-GTP loading.
Multiple negative feedback loops shape the integrated Erk phosphorylation response
In addition to feedback regulation of Ras-GEF, we also characterized the upregulation of MKP expression induced by Erk and other MAPKs (Brondello et al, 1997; Bhalla et al, 2002; Plows et al, 2002) (Figure 5A and B). MKP-1 expression is upregulated ∼3-fold in response to 1 nM PDGF, after a lag time of approximately 15 min. At 30 pM PDGF, which elicits roughly half-maximal Erk phosphorylation (Figure 1B and C), MKP-1 expression increases only slightly, suggestive of a signaling threshold for triggering the feedback loop. A similar MKP-1 response is observed when either Ras or PI3K is inhibited, with a partial reduction in the fold induction (Figure 5B); this outcome can be attributed at least in part to the diminished Erk phosphorylation response, integrated over time, when either of the two major pathways is disrupted. As expected, inhibition of MEK/Erk or c-Jun N-terminal kinase (JNK) (but not of p38; results not shown) significantly reduces the induction of MKP-1 expression, and simultaneous inhibition of MEK and JNK blocks MKP-1 upregulation completely (Figure 5C).
Figure 5.

Delayed onset and threshold for MKP-1 upregulation, a known negative feedback loop in the Erk pathway. (A) Immunoblots of MKP-1 levels in control, PI3K-inhibited, or S17N H-Ras-expressing cells that were unstimulated or stimulated with PDGF-BB for 5, 15, 30, 60, or 120 min; each blot is representative of two or three independent experiments. (B) Quantification of MKP-1 expression, with either total Erk1 or total protein as the loading control and normalized as described under Materials and methods. Values are reported as mean±s.e.m. (n=3 for DMSO and LY294002; n=2 for control vector and S17N Ras). (C) MEK/Erk and JNK pathways contribute to feedback upregulation of MKP-1. PDGF stimulation was 1 nM for 60 min. MEK or/and JNK were inhibited by incubation with 50 μM PD098059 (PD) and 25 μM SP600125 (SP), respectively. The DMSO concentration was 0.25% in all cases. The blot is representative of two independent experiments. Source data is available for this figure at www.nature.com/msb.
Parsing the magnitudes of PI3K-dependent cross-talk interactions in the PDGF receptor signaling network
Synthesizing the data assembled, a conceptual model of the PDGF receptor signaling network is now clear (Figure 6). Yet, the unique dose–response and kinetic information in the data set allow for a more quantitative description through mathematical modeling and analysis. The relatively coarse granularity of our model, described in detail in the Supplementary information, reflects a careful balance between the level of molecular detail included and both the uncertainty of those details and the ability to specify model parameters. In the context of the model, the magnitudes of the Ras- and PI3K-dependent inputs converging on MEK/Erk determine the saturability of Erk phosphorylation with respect to PDGF dose and also the degree to which the response adapts, and conversely, the observed dynamics can be used to quantify the magnitudes of the inputs.
Figure 6.

Conceptual model of the PDGF receptor signaling network. Cross-talk interactions from PI3K lipid products (3′ PIs) affect Ras-specific GEF (e.g. Grb2–Sos complex) recruitment and activation of MEK kinases, which might or might not be the same as those activated by Ras. It is recognized that those cross-talk effects might entail multiple steps, and that a more refined model would account for the effect of JNK activation on the MKP negative feedback loop.
A total of 34 unspecified parameter values were estimated using a Monte Carlo-based algorithm that directly and globally compares the model output to the experimental data (Supplementary information); thus, an ensemble of 10 000 parameter sets that fit the data almost equally well was assembled. This approach embraces the inherent ‘sloppiness' of kinetic models, which prohibits the reliable identification of precise parameter values yet allows for predictions based on collective fits to data (Gutenkunst et al, 2007). The model output is expressed as an ensemble average (Brown and Sethna, 2003; Violin et al, 2008) and compared with the corresponding data (Figure 7). The remaining data used to constrain the algorithm indicate the degree of saturation in the MEK/Erk pathway (Supplementary Figure S2). Taken together, the data force the model to reconcile time- and PDGF dose-dependent features of the network observed under the various experimental conditions tested, including subtle differences between the two control experiments (DMSO vehicle only versus empty pBM-puro vector). Considering the global constraints imposed by the data and the necessarily simplified nature of the kinetic model, it is our assessment that the model performs quite well; however, one feature that it was not able to reconcile well is the sensitivity of the Erk phosphorylation response in S17N Ras-expressing cells stimulated with the lower doses of PDGF (Figure 7; bottom row, second plot from left). We speculate that the apparent sensitivity of the response, relative to the model output, is diminished by cell variability. It is known that variability in the cells' sensitivity to stimulation (the EC50 of the dose–response curve) produces a flatter dose–response curve for the population (Altan-Bonnet and Germain, 2005). The model also does not capture the transient nature of the S17N Ras/30 pM PDGF curve, suggesting that ligand depletion or other negative feedback effects might need to be characterized and accounted for in future refinements of the model. Indeed, the transient nature of the Akt phosphorylation response at low PDGF concentrations (Figure 2) provides additional evidence for such effects affecting PI3K-dependent signaling.
Figure 7.

Computational model and algorithm for direct comparison to experimental data. A quantitative kinetic model of the network was formulated, and a Monte Carlo scheme was used to collect an ensemble of parameter sets that fit our data set well (Supplementary information). The solid curves represent ensemble means, and the dashed curves are mean±s.d. (n=10 000). The data values used to constrain the model (symbols) are also shown (see also Supplementary Figure S3). PDGF concentrations are: red, 1 nM; green, 300 pM; blue, 100 pM; gray, 50 pM; black, 30 pM.
Parameter statistics (Supplementary information) show that many parameters tend to be pegged at arbitrarily high values, suggesting ways to simplify the model without a significant change in output. For example, the algorithm consistently picked parameter sets in which the enzymes operate far from saturation. This observation facilitates our analysis of Ras- and PI3K-dependent MEK phosphorylation, in which we examine the catalytic efficiency of each phosphorylation step relative to that of the opposing dephosphorylation reaction (Figure 8A). The results reveal a consistent ratio of PI3K- and Ras-dependent contributions, as indicated by points clustered around a diagonal line, with the Ras-dependent pathway tending to be more potent under maximal PDGF stimulation. To further quantify these pathways, we formulated a single number, the MEK activation comparator (MAC), which compares their capacities to generate dually phosphorylated MEK (ratio of PI3K-dependent/Ras-dependent; see Supplementary information). Over the parameter set ensemble, the median MAC value is 0.22, with quartile values of 0.17 and 0.30; that is, the PI3K-dependent MEK activation pathway is predicted to be intrinsically less potent than the Ras-dependent pathway under maximal PDGF stimulation. Importantly, the MAC quantifies these inputs in a way that uncouples them from negative feedback effects. As shown in Figure 7, feedback desensitization attenuates the maximum stimulation of Ras-GTP by roughly two-thirds. Adjusting the MAC to account for this reduction, which presumably affects both Ras-dependent MEK phosphorylation steps equally, yields a median ratio of 1.6 (quartile values of 1.2 and 2.1); that is, Ras-GEF desensitization renders the PI3K-dependent pathway more important. This is consistent with the observation that PI3K inhibition affects Erk phosphorylation somewhat more dramatically than inhibition of Ras-GTP loading.
Figure 8.

Quantitative analysis of PI3K-dependent cross-talk to Ras/Erk. (A) Quantification of Ras- and PI3K-dependent MEK phosphorylation pathways. For each parameter set described under Figure 7, the quantity Cxij is defined as the maximum catalytic efficiency of pathway i (i=1, Ras dependent; i=2, PI3K dependent) toward site j on MEK divided by the catalytic efficiency of the corresponding phosphatase reaction (Supplementary information). On the dashed line, the two pathways are equally potent by this measure. (B) Quantification of the PI3K-independent and -dependent modes of Ras-GEF recruitment. These are characterized by the model parameters KGR and KGP, respectively, plotted here for each parameter set in the ensemble. The factor of 123 is a scaling factor (Supplementary information); when KGP=KGR/123 (dashed line), the two modes contribute equally to Ras-GEF recruitment in the limit of low PDGF concentration.
Upstream of Ras, a similar analysis was performed for PI3K-dependent and -independent modes of Ras-GEF recruitment, which are characterized by specific model parameters (Figure 8B). Taken together, these modes determine the saturability of Ras-GTP loading with respect to PDGF dose. Although most of the parameter sets in the ensemble included a significant PI3K-dependent contribution, a small fraction of them ignored the PI3K-dependent mode, which we attribute to the subtlety of the data constraining it (the effect of PI3K inhibition on Ras-GTP accumulation). Defining the GEF recruitment comparator (GRC) as the ratio of PI3K-dependent/PI3K-independent modes at low PDGF concentrations (see Supplementary information), the median GRC value for the ensemble is 1.4, with quartile values of 0.7 and 2.0. This analysis suggests that the two Ras activation modes are almost equally important.
Model predictions and potential for model refinement
We have shown how data-driven analysis of a kinetic model can be used to quantify inputs to signaling pathways. Another use of this approach is to generate hypothetical predictions with an eye toward future experiments. Here, we focus on the PI3K-dependent cross-talk impinging upstream and downstream of Ras (Figure 9). Although both mechanisms are blocked by PI3K inhibition, the model ensemble predicts unique kinetic signatures that might be expected if either mechanism were silenced selectively. At lower PDGF concentrations, it is predicted that blocking either mechanism would yield Erk phosphorylation levels that are intermediate between control and PI3K-inhibited conditions, but the key discriminator is the Erk phosphorylation kinetics observed with a high PDGF dose; there, if the cross-talk mechanism upstream of Ras is blocked, the kinetics are predicted to be similar to control conditions, whereas if the mechanism downstream of Ras is blocked, the kinetics are predicted to be similar to the PI3K-inhibited case (Figure 9). The basis for this result stems from the saturability of Ras-GEF recruitment, wherein high PDGF concentrations stimulate maximal Ras-GTP loading even in the absence of PI3K signaling.
Figure 9.

Model predictions based on ensemble averaging. Predictions are based on hypothetical interventions by which the PI3K-dependent cross-talk upstream or downstream of Ras are selectively blocked (Supplementary information), which can be compared with control and PI3K-inhibited (all cross-talk blocked) conditions. Solid curves represent ensemble means, and dashed curves are mean±s.d. (n=10 000). PDGF concentrations are: red, 1 nM; black, 30 pM.
Discussion
A unique data set was collected to systematically characterize multiple cross-talk interactions between the PI3K and Ras/Erk pathways and regulatory feedback loops in the PDGF receptor signaling network. PI3K is strongly activated and plays a prominent role in this system, and Ras- and PI3K-dependent pathways converge as distinct inputs to Erk activation that we have quantified experimentally and through computational modeling. At lower PDGF concentrations, Erk activation qualitatively follows AND logic, with both inputs required for a robust response, whereas it follows OR logic at higher PDGF concentrations, wherein either pathway is sufficient. The basis for these observations lies in the saturability of the pathways. Half-maximal PDGF receptor phosphorylation is elicited by ∼0.5–1 nM PDGF-BB (Park et al, 2003), concentrations that yield maximal activation of PI3K and Ras in our cells; downstream of Ras, we also find partial saturation of MEK or Erk. The magnitudes of the inputs to the Erk pathway also affect adaptation of the response imposed by negative feedback regulation.
In contrast, cross-talk from the Ras/Erk pathway to PI3K is far less significant, which might be considered surprising in light of the interaction between Ras-GTP and PI3K catalytic subunits. Apparently, Ras does not appreciably complement the already tight binding between PDGF receptors and PI3K (Kazlauskas and Cooper, 1990), whereas Ras might play a more significant role in conjunction with receptors/adaptors that bind PI3K regulatory subunit with lower affinity (Kaur et al, 2006).
To advance this line of inquiry, the PI3K-dependent intermediates that execute the cross-talk to Erk will need to be better and more quantitatively characterized. One candidate pathway is the phosphorylation of Raf-1 on Ser338, which has been implicated in Raf-1 activation. Phosphorylation of Raf-1 on Ser338 is catalyzed by isoforms of p21-activated kinase (Pak), which can be activated downstream of PI3K and either Rac or Cdc42 (Chaudhary et al, 2000; Sun et al, 2000). Raf-1 mutants that cannot bind Ras-GTP can be activated in cells by co-expression of Pak3 and constitutively active Cdc42, suggesting a Ras-independent pathway (Sun et al, 2000), whereas other evidence suggests a role for Ras in the activation of Raf-1 by Rac/Cdc42 and Pak (Li et al, 2001; Zang et al, 2002). Consistent with this literature, we found that Raf-1 phosphorylation on Ser338 strongly depends on both PI3K and Ras in our cells (results not shown); from the standpoint of cross-talk from PI3K to Erk, this finding is inconclusive, because it does not account for the Ras-independent pathway in our cells. Other aspects of Raf-1 regulation might account for the pathway, as there is ample evidence that Ser338 phosphorylation is not a strong correlate of Raf-1 activity (Sun et al, 2000; Chiloeches et al, 2001; Oehrl et al, 2003; Beeser et al, 2005); regulation of other Raf isoforms and other putative MEK kinases, such as Pak (Beeser et al, 2005; Park et al, 2007) and 3-phosphoinositide-dependent protein kinase 1 (Sato et al, 2004), might also be considered. It is also worth noting that such PI3K-dependent modes of Erk activation could mask a subtle negative regulation of the Erk pathway, through Akt for example (Zimmermann and Moelling, 1999); however, overexpression of Akt-1 does not affect PDGF-stimulated Erk phosphorylation in our cells, despite a two-fold increase in phosphorylated Akt (results not shown). Finally, although at least one important mode of PI3K-dependent cross-talk to Erk is Ras independent, PI3K lipid products apparently contribute upstream of Ras as well, perhaps through direct recruitment of Ras-specific GEF activity or through mediators such as centaurin-α1 (Hayashi et al, 2006).
If such mechanisms are to be tested, mathematical model predictions provide kinetic signatures that could help validate the point of action of a particular pathway from PI3K to Erk. For example, if a particular kinase contributing to the Ras-independent Erk activation pathway were blocked, the model predicts that the time courses of Erk phosphorylation at both low and high PDGF concentrations would be perturbed relative to control (Figure 9). Furthermore, the extent of perturbation relative to complete PI3K inhibition, especially at high PDGF concentrations, reveals the degree to which the kinase is playing a major role in the pathway. Such an analysis would require quantitative measurements of the type presented here. Importantly, the extent of Erk inhibition in the dominant-negative Ras background would lend further evidence and opportunity for model validation. In turn, characterization of cross-talk mechanisms along these lines allows both conceptual and quantitative models to be refined. The data set generated here, together with new data, will be instrumental in iteratively testing more detailed models of the PDGF receptor signaling network.
Another issue that needs to be confronted is the generality of signal-transduction networks across receptor and cell types. Certainly, major disparities in the regulation of signaling in different contexts, even among receptors of the same class, should be expected. Indeed, it is instructive to compare the PDGF receptor network to the proposed regulatory structure ascribed to epidermal growth factor (EGF) receptor, which has been the subject of numerous quantitative modeling efforts (Wiley et al, 2003). Recent experimental and modeling work has provided compelling evidence that EGF receptor signaling through PI3K and Erk are coupled primarily through regulation of Gab1 (Kiyatkin et al, 2006). According to that model, phosphorylated Gab1 recruits PI3K, and Gab1 responds to 3′ phosphoinositides, constituting a positive feedback loop; Gab1 also aids in the activation of Ras. Further, Gab1 and therefore PI3K are subject to a negative feedback loop mediated by Erk. The evidence suggests that the inability of EGF receptors to interact directly with PI3K demands the utilization of Gab1 and thus dictates the important features of that network. In contrast, PDGF receptors activate PI3K directly and strongly, perhaps explaining why PI3K is not subject to regulation by Erk in our cells; other evidence suggests that Gab1 is prominently utilized to recruit PI3K in response to EGF, but not PDGF, in the same cell background (Zhang et al, 2002). Clearly, control at the network level is highly context dependent, and more quantitative approaches will be needed to unravel the mechanisms that distinguish particular signaling systems.
Materials and methods
Reagents
All tissue culture reagents were from Invitrogen (Carlsbad, CA). Human recombinant PDGF-BB was from Peprotech (Rocky Hill, NJ). Antibodies against Ras (Y13-259, agarose conjugated), Akt-1/2 N terminus, Erk-1 C terminus, and MKP-1 were from Santa Cruz Biotechnology (Santa Cruz, CA). Phospho-specific antibodies against Akt pSer473, Erk pThr202/pTyr204, and Raf-1 pSer338 were from Cell Signaling Technology (Beverly, MA). Pharmacological inhibitors were from Calbiochem (San Diego, CA); where applicable, cells were pre-incubated with the inhibitor for 30–60 min prior to PDGF stimulation. Unless otherwise noted, all other reagents were from Sigma-Aldrich (St Louis, MO).
Plasmids, retroviral infection, and cell culture
The retroviral vectors bearing S17N and G12V H-Ras, cloned into pBM-IRES-Puro, and their introduction into the ecotropic φNX packaging cell line by the calcium phosphate precipitation method, were described previously (Kaur et al, 2006). NIH 3T3 fibroblasts (American Type Culture Collection, Manassas, VA) were cultured at 37°C, 5% CO2 in Dulbecco's modified Eagle's medium supplemented with 10% fetal bovine serum, 2 mM L-glutamine, and the antibiotics penicillin and streptomycin. Where applicable, NIH 3T3 cells were serially infected with retrovirus bearing empty vector, S17N H-Ras, or G12V H-Ras and selected using puromycin prior to each experiment, as described previously (Kaur et al, 2006).
Lysate preparation and biochemical assays
Cells were serum-starved for 4 h prior to stimulation. Detergent lysates were prepared for quantitative immunoblotting, and immunoblots were performed using enhanced chemiluminescence, as described previously (Park et al, 2003). Blots comparing lysates prepared on the same day, representing either different inhibitor treatments or different cell variants and respective control conditions, were performed in parallel and exposed at the same time. The Bio-Rad Fluor S-Max system, which gives a linear response with respect to light output, was used, and band intensity was quantified using local background subtraction. Total cellular protein concentrations were determined by Micro BCA assay (Pierce, Rockford, IL).
To determine the amounts of Ras-bound GTP (from all Ras isoforms), eluted from anti-Ras immunoprecipitates (Y13-259, agarose conjugated), the coupled nucleoside-5′-diphosphate kinase/luciferase assay (Scheele et al, 1995) was used; the determination of the sum of GDP+GTP was achieved by first converting GDP to GTP. These assays were performed as described previously (Kaur et al, 2006).
Data normalization and statistical analysis
Biochemical data were first normalized by an appropriate loading control as stated in the figure legends. To evaluate the consistency of relative trends across independent experiments, the data were further normalized as follows (see also Supplementary Figure S3). Suppose there are n experiments for which data are collected at m time points. During each of the n experiments, the same control is run. Let Xij denote the experimental measurement for the control in the ith experiment at the jth time point. Often the quantity of interest Yij (for example, the fraction of Erk or Akt in the phosphorylated state) is related to Xij by an unknown scale factor, αi. Under ideal conditions, the control would not vary from experiment to experiment. Therefore, we sought the set of αi values that minimize the suitable error metric F, defined as follows.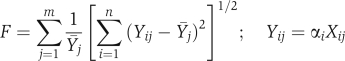 where Ȳj is the mean value that results for time point j. The function F is proportional to the mean coefficient of variation for the control time series. The minimization is subject to a constraint that eliminates the trivial solution, αi=0 for all i. The time course of cells stimulated with 1 nM PDGF under control conditions (DMSO or empty vector) was used to determine the normalization factors, and each factor was applied to the remaining data collected on the same day (control conditions with lower PDGF concentrations and either inhibitor or Ras variant expression conditions, measured in parallel). Where applicable, normalized means for control and perturbed conditions were compared by Student's t-test, using the most conservative model (two-tails, unequal variance).
Kinetic modeling and analysis
A mathematical model was constructed based on known or plausible signaling mechanisms, with appropriate simplifications, as described in detail in the Supplementary information. Briefly, PDGF receptor binding, dimerization, and endocytosis, and the production of 3′ PI lipids by receptor-recruited PI3K, are modeled as previously described (Park et al, 2003; Schneider and Haugh, 2005). Activated receptors and 3′ PI lipids mediate the recruitment of Ras-GEF activity and Ras-GTP loading; for simplicity, the roles of adaptors such as Grb2 and Shc are implicit. Ras-GTP and 3′ PI lipids independently mediate the activation of one or more MEK kinases, and MEK and Erk are sequentially activated by dual phosphorylations. Activated Erk governs negative feedback through desensitization of Ras-GEF and through upregulation of MKP activity.
The model has 18 time-dependent variables and a total of 44 rate constants or other adjustable parameters, of which 10 were assigned fixed values based on previous work. Remaining parameters were specified using a computational scheme based on the Metropolis algorithm, which is well suited for kinetic parameter estimation constrained by biochemical data (Brown and Sethna, 2003; Violin et al, 2008). Our variation of the method, implemented in MATLAB (The MathWorks; codes available upon request), works as follows (see Supplementary information for details). Starting with initial parameter values, the model output is computed and aligned with the data, and the quality of fit is evaluated. Next, new values are chosen according to normal distributions centered on the previous values; the width of the distribution is a parameter of the algorithm. If specified error criteria are met, the new parameter set is accepted and used as the nexus for choosing the next parameter values; otherwise, the procedure is repeated with the previous parameter set. If the starting parameter set (determined based on a separate error minimization subroutine) is nearly optimal, then the parameter sets generated in this manner constitute an ensemble that fit the data almost equally well. After compiling the ensemble, the model output is recalculated for each parameter set, and at each time point, an ensemble mean and standard deviation are calculated.
Supplementary Material
Supplementary text S1 and supplementary Figures S1, S2 and S3
SBML (level 2, version 4) model
Acknowledgments
We thank Timothy Elston (Department of Pharmacology, University of North Carolina-Chapel Hill) for helpful discussions on data normalization and parameter estimation practices. This study was supported by National Institutes of Health grant R01-GM067739.
Footnotes
The author declares that he has no conflict of interest.
References
- Altan-Bonnet G, Germain RN (2005) Modeling T cell antigen discrimination based on feedback control of digital ERK responses. PLoS Biol 3: e356. [DOI] [PMC free article] [PubMed] [Google Scholar]
- Beeser A, Jaffer ZM, Hofmann C, Chernoff J (2005) Role of group A p21-activated kinases in activation of extracellular-regulated kinase by growth factors. J Biol Chem 280: 36609–36615 [DOI] [PubMed] [Google Scholar]
- Bhalla US, Ram PT, Iyengar R (2002) MAP kinase phosphatase as a locus of flexibility in a mitogen-activated protein kinase signaling network. Science 297: 1018–1023 [DOI] [PubMed] [Google Scholar]
- Bray D (1990) Intracellular signaling as a parallel distributed process. J Theor Biol 143: 215–231 [DOI] [PubMed] [Google Scholar]
- Brondello J, Brunet A, Pouysségur J, McKenzie FR (1997) The dual specificity mitogen-activated protein kinase phosphatase-1 and -2 are induced by the p42/p44MAPK cascade. J Biol Chem 272: 1368–1376 [DOI] [PubMed] [Google Scholar]
- Brown KS, Sethna JP (2003) Statistical mechanical approaches to models with many poorly known parameters. Phys Rev E 68: 021904. [DOI] [PubMed] [Google Scholar]
- Chaudhary A, King WG, Mattaliano MD, Frost JA, Diaz B, Morrison DK, Cobb MH, Marshall MS, Brugge JS (2000) Phosphatidylinositol 3-kinase regulates Raf1 through Pak phosphorylation of serine 338. Curr Biol 10: 551–554 [DOI] [PubMed] [Google Scholar]
- Chiloeches A, Mason CS, Marais R (2001) S338 phosphorylation of Raf-1 is independent of phosphatylinositol 3-kinase and Pak3. Mol Cell Biol 21: 2423–2434 [DOI] [PMC free article] [PubMed] [Google Scholar]
- Claesson-Welsh L (1994) Platelet-derived growth factor receptor signals. J Biol Chem 269: 32023–32026 [PubMed] [Google Scholar]
- Cross DAE, Alessi DR, Vandenheede JR, McDowell HE, Hundal HS, Cohen P (1994) The inhibition of glycogen synthase kinase-3 by insulin or insulin-like growth factor 1 in the rat skeletal muscle cell line L6 is blocked by wortmannin, but not rapamycin: evidence that wortmannin blocks activation of the mitogen-activated protein kinase pathway in L6 cells between Ras and Raf. Biochem J 303: 21–26 [DOI] [PMC free article] [PubMed] [Google Scholar]
- DePaolo D, Reusch JEB, Carel K, Bhuripanyo P, Leitner JW, Draznin B (1996) Functional interactions of phosphatidylinositol 3-kinase with GTPase-activating protein in 3T3-L1 adipocytes. Mol Cell Biol 16: 1450–1457 [DOI] [PMC free article] [PubMed] [Google Scholar]
- Duckworth BC, Cantley LC (1997) Conditional inhibition of the mitogen-activated protein kinase cascade by wortmannin: dependence on signal strength. J Biol Chem 272: 27665–27670 [DOI] [PubMed] [Google Scholar]
- Engelman JA, Luo J, Cantley LC (2006) The evolution of phosphatidylinositol 3-kinases as regulators of growth and metabolism. Nat Rev Genet 7: 606–619 [DOI] [PubMed] [Google Scholar]
- Gharbi SI, Zvelebil MJ, Shuttleworth SJ, Hancox T, Saghir N, Timms JF, Waterfield MD (2007) Exploring the specificity of the PI3K family inhibitor LY294002. Biochem J 404: 15–21 [DOI] [PMC free article] [PubMed] [Google Scholar]
- Gutenkunst RN, Waterfall JJ, Casey FP, Brown KS, Myers CR, Sethna JP (2007) Universally sloppy parameter sensitivities in systems biology models. PLoS Comp Biol 3: e189. [DOI] [PMC free article] [PubMed] [Google Scholar]
- Hawes BE, Luttrell LM, van Biesen T, Lefkowitz RJ (1996) Phosphatidylinositol 3-kinase is an early intermediate in the Gβγ-mediated mitogen-activated protein kinase signaling pathway. J Biol Chem 271: 12133–12136 [DOI] [PubMed] [Google Scholar]
- Hawkins PT, Anderson KE, Davidson K, Stephens LR (2006) Signalling through class I PI3Ks in mammalian cells. Biochem Soc Trans 34: 647–662 [DOI] [PubMed] [Google Scholar]
- Hayashi H, Matsuzaki O, Muramatsu S, Tsuchiya Y, Harada T, Suzuki Y, Sugano S, Matsuda A, Nishida E (2006) Centaurin-α1 is a phosphatidylinositol 3-kinase-dependent activator of ERK1/2 mitogen-activated protein kinases. J Biol Chem 281: 1332–1337 [DOI] [PubMed] [Google Scholar]
- Heldin C-H, Westermark B (1999) Mechanism of action and in vivo role of platelet-derived growth factor. Physiol Rev 79: 1283–1316 [DOI] [PubMed] [Google Scholar]
- Hu Q, Klippel A, Muslin AJ, Fantl WJ, Williams LT (1995) Ras-dependent induction of cellular responses by constitutively active phosphatidylinositol-3 kinase. Science 268: 100–102 [DOI] [PubMed] [Google Scholar]
- Hunter T (2000) Signaling—2000 and beyond. Cell 100: 113–127 [DOI] [PubMed] [Google Scholar]
- Jiménez C, Hernández C, Pimental B, Carrera AC (2002) The p85 regulatory subunit controls sequential activation of phosphoinositide 3-kinase by Tyr kinases and Ras. J Biol Chem 277: 41556–41562 [DOI] [PubMed] [Google Scholar]
- Karnitz LM, Burns LA, Sutor SL, Blenis J, Abraham RT (1995) Interleukin-2 triggers a novel phosphatidylinositol 3-kinase-dependent MEK activation pathway. Mol Cell Biol 15: 3049–3057 [DOI] [PMC free article] [PubMed] [Google Scholar]
- Kaur H, Park CS, Lewis JM, Haugh JM (2006) Quantitative model of Ras/phosphoinositide 3-kinase signalling cross-talk based on co-operative molecular assembly. Biochem J 393: 235–243 [DOI] [PMC free article] [PubMed] [Google Scholar]
- Kazlauskas A, Cooper JA (1990) Phosphorylation of the PDGF receptor β-subunit creates a tight binding site for phosphatidylinositol-3 kinase. EMBO J 9: 3279–3286 [DOI] [PMC free article] [PubMed] [Google Scholar]
- Kholodenko BN (2006) Cell-signalling dynamics in time and space. Nat Rev Mol Cell Biol 7: 165–176 [DOI] [PMC free article] [PubMed] [Google Scholar]
- King WG, Mattaliano MD, Chan TO, Tsichlis PN, Brugge JS (1997) Phosphatidylinositol 3-kinase is required for integrin-stimulated AKT and Raf-1/mitogen-activated protein kinase pathway activation. Mol Cell Biol 17: 4406–4418 [DOI] [PMC free article] [PubMed] [Google Scholar]
- Kiyatkin A, Aksamitiene E, Markevich NI, Borisov NM, Hoek JB, Kholodenko BN (2006) Scaffolding protein Grb2-associated binder 1 sustains epidermal growth factor-induced mitogenic and survival signaling by multiple positive feedback loops. J Biol Chem 281: 19925–19938 [DOI] [PMC free article] [PubMed] [Google Scholar]
- Klarlund JK, Cherniak AD, Czech MP (1995) Divergent mechanisms for homologous desensitization of p21ras by insulin and growth factors. J Biol Chem 270: 23421–23428 [DOI] [PubMed] [Google Scholar]
- Klinghoffer RA, Duckworth B, Valius M, Cantley L, Kazlauskas A (1996) Platelet-derived growth factor-dependent activation of phosphatidylinositol 3-kinase is regulated by receptor binding of SH2-domain-containing proteins which influence Ras activity. Mol Cell Biol 16: 5905–5914 [DOI] [PMC free article] [PubMed] [Google Scholar]
- Klippel A, Reinhard C, Kavanaugh WM, Apell G, Escobedo M, Williams LT (1996) Membrane localization of phosphatidylinositol 3-kinase is sufficient to activate multiple signal-transducing kinase pathways. Mol Cell Biol 16: 4117–4127 [DOI] [PMC free article] [PubMed] [Google Scholar]
- Knight ZA, Gonzalez B, Feldman ME, Zunder ER, Goldenberg DD, Williams O, Loewith R, Stokoe D, Balla A, Toth B, Balla T, Weiss WA, Williams RL, Shokat KM (2006) A pharmacological map of the PI3-K family defines a role for p110α in insulin. Cell 125: 733–747 [DOI] [PMC free article] [PubMed] [Google Scholar]
- Kolch W (2000) Meaningful relationships: the regulation of the Ras/Raf/MEK/Erk pathway by protein interactions. Biochem J 351: 289–305 [PMC free article] [PubMed] [Google Scholar]
- Langlois WJ, Sasaoka T, Saltiel AR, Olefsky JM (1995) Negative feedback regulation and desensitization of insulin- and epidermal growth factor-stimulated p21ras activation. J Biol Chem 270: 25320–25323 [DOI] [PubMed] [Google Scholar]
- Li W, Chong H, Guan KL (2001) Function of the Rho family GTPases in Ras-stimulated Raf activation. J Biol Chem 276: 34728–34737 [DOI] [PubMed] [Google Scholar]
- Ma'ayan A, Blitzer RD, Iyengar R (2005) Toward predictive models of mammalian cells. Annu Rev Biophys Biomol Struct 34: 319–349 [DOI] [PMC free article] [PubMed] [Google Scholar]
- Oehrl W, Rubio I, Wetzker R (2003) Serine 338 phosphorylation is dispensable for activation of c-Raf1. J Biol Chem 278: 17819–17826 [DOI] [PubMed] [Google Scholar]
- Park CS, Schneider IC, Haugh JM (2003) Kinetic analysis of platelet-derived growth factor receptor/phosphoinositide 3-kinase/Akt signaling in fibroblasts. J Biol Chem 278: 37064–37072 [DOI] [PubMed] [Google Scholar]
- Park ER, Eblen ST, Catling AD (2007) MEK1 activation by PAK: a novel mechanism. Cell Signalling 19: 1488–1496 [DOI] [PMC free article] [PubMed] [Google Scholar]
- Plows D, Briassouli P, Owen C, Zoumpourlis V, Garrett MD, Pintzas A (2002) Ecdysone-inducible expression of oncogenic Ha-Ras in NIH 3T3 cells leads to transient nuclear localization of activated extracellular signal-regulated kinase regulated by mitogen-activated protein kinase phosphatase-1. Biochem J 362: 305–315 [DOI] [PMC free article] [PubMed] [Google Scholar]
- Rodriguez-Viciana P, Warne PH, Dhand R, Vanhaesebroeck B, Gout I, Fry MJ, Waterfield MD, Downward J (1994) Phosphatidylinositol-3-OH kinase as a direct target of Ras. Nature 370: 527–532 [DOI] [PubMed] [Google Scholar]
- Sato S, Fujita N, Tsuruo T (2004) Involvement of 3-phosphoinositide-dependent protein kinase-1 in the MEK/MAPK signal transduction pathway. J Biol Chem 279: 33759–33767 [DOI] [PubMed] [Google Scholar]
- Scheele JS, Rhee JM, Boss GR (1995) Determination of absolute amounts of GDP and GTP bound to Ras in mammalian cells: comparison of parental and Ras-overproducing NIH 3T3 fibroblasts. Proc Natl Acad Sci USA 92: 1097–1100 [DOI] [PMC free article] [PubMed] [Google Scholar]
- Schlessinger J (2000) Cell signaling by receptor tyrosine kinases. Cell 103: 211–225 [DOI] [PubMed] [Google Scholar]
- Schneider IC, Haugh JM (2005) Quantitative elucidation of a distinct spatial gradient-sensing mechanism in fibroblasts. J Cell Biol 171: 883–892 [DOI] [PMC free article] [PubMed] [Google Scholar]
- Sun H, King AJ, Diaz HB, Marshall MS (2000) Regulation of the protein kinase Raf-1 by oncogenic Ras through phosphatidylinositol 3-kinase, Cdc42/Rac and Pak. Curr Biol 10: 281–284 [DOI] [PubMed] [Google Scholar]
- Tyson JJ, Chen KC, Novak B (2003) Sniffers, buzzers, toggles and blinkers: dynamics of regulatory and signaling pathways in the cell. Curr Opin Cell Biol 15: 221–231 [DOI] [PubMed] [Google Scholar]
- Vanhaesebroeck B, Leevers SJ, Ahmadi K, Timms J, Katso R, Driscoll PC, Woscholski R, Parker PJ, Waterfield MD (2001) Synthesis and function of 3-phosphorylated inositol lipids. Annu Rev Biochem 70: 535–602 [DOI] [PubMed] [Google Scholar]
- Violin JD, Dipilato LM, Yildirim N, Elston TC, Zhang J, Lefkowitz RJ (2008) β2-Adrenergic receptor signaling and desensitization elucidated by quantitative modeling of real time cAMP dynamics. J Biol Chem 283: 2949–2961 [DOI] [PubMed] [Google Scholar]
- Waters SB, Holt KH, Ross SE, Syu L, Guan K, Saltiel AR, Koretzky GA, Pessin JE (1995) Desensitization of Ras activation by a feedback disassociation of the Sos–Grb2 complex. J Biol Chem 270: 20883–20886 [DOI] [PubMed] [Google Scholar]
- Wennström S, Downward J (1999) Role of phosphoinositide 3-kinase in activation of Ras and mitogen-activated protein kinase by epidermal growth factor. Mol Cell Biol 19: 4279–4288 [DOI] [PMC free article] [PubMed] [Google Scholar]
- Wiley HS, Shvartsman SY, Lauffenburger DA (2003) Computational modeling of the EGF-receptor system: a paradigm for systems biology. Trends Cell Biol 13: 43–50 [DOI] [PubMed] [Google Scholar]
- Zang M, Hayne C, Luo Z (2002) Interaction between active Pak1 and Raf-1 is necessary for phosphorylation and activation of Raf-1. J Biol Chem 277: 4395–4405 [DOI] [PubMed] [Google Scholar]
- Zhang SQ, Tsiaras WG, Araki T, Wen GY, Minichiello L, Klein R, Neel BG (2002) Receptor-specific regulation of phosphatidylinositol 3′-kinase activation by the protein tyrosine phosphatase Shp2. Mol Cell Biol 22: 4062–4072 [DOI] [PMC free article] [PubMed] [Google Scholar]
- Zimmermann S, Moelling K (1999) Phosphorylation and regulation of Raf by Akt (protein kinase B). Science 286: 1741–1744 [DOI] [PubMed] [Google Scholar]
Associated Data
This section collects any data citations, data availability statements, or supplementary materials included in this article.
Supplementary Materials
Supplementary text S1 and supplementary Figures S1, S2 and S3
SBML (level 2, version 4) model