Abstract
Purpose: To prospectively evaluate differences in T1ρ (T1 relaxation time in the rotating frame) and T2 values in the meniscus at magnetic resonance (MR) imaging in both patients with varying degrees of osteoarthritis (OA) and healthy control subjects.
Materials and Methods: The study was institutional review board approved and HIPAA compliant. Written informed consent was obtained from all subjects. T1ρ and T2 measurements were performed at 3.0-T MR imaging in 60 subjects deemed to be healthy (n = 23; mean age, 34.1 years ± 10.0 [standard deviation]; age range, 23–59 years), having mild OA (n = 27; mean age, 52.5 years ± 10.9; age range, 32–69 years), or having severe OA (n = 10; mean age, 61.6 years ± 11.6; age range, 50–86 years). Semiautomatic segmentation was performed to generate T1ρ and T2 maps of the menisci. Clinical findings were assessed by using Western Ontario and McMaster Osteoarthritis (WOMAC) questionnaires. Differences in T1ρ and T2 values between the three subject groups were calculated by using two-tailed t tests (with P < .05 indicating significance), and receiver operating characteristic analyses were performed. Correlations of meniscal T1ρ and T2 values with age, cartilage-derived T1ρ and T2 parameters, and WOMAC scores were calculated.
Results: Significant differences between the three subject groups were found: Mean T1ρ values were 14.7 msec ± 5.5, 16.1 msec ± 6.6, and 19.3 msec ± 7.6 for the healthy, mild OA, and severe OA groups, respectively. Mean T2 values were 11.4 msec ± 3.9, 13.5 msec ± 4.7, and 16.6 msec ± 8.2 for the healthy, mild OA, and severe OA groups, respectively. Correlations of meniscal T1ρ and T2 values with subject age (R2 = 0.18, for correlation with T2 only), cartilage-derived parameters (R2 = 0.14–0.29), and WOMAC scores (R2 = 0.11–0.45) were significant.
Conclusion: Meniscal T1ρ and T2 values correlate with clinical findings of OA and can be used to differentiate healthy subjects from patients with mild or severe OA.
© RSNA, 2008
Osteoarthritis (OA) is a multifactorial degenerative joint disease and is the most common form of arthritis. The knee is the most common site affected, with an incidence of 240 cases per 100 000 individuals a year. The incidences of hand OA (100 cases per 100 000 individuals annually) and hip OA (88 cases per 100 000 individuals annually) follow (1). Previous studies have shown that OA leads to progressive cartilage loss, which can be evaluated with magnetic resonance (MR) imaging. MR sequences to evaluate cartilage qualitatively (2–5) and quantify cartilage volume (6,7) have been developed. Loss of hyaline articular cartilage is irreversible; however, the cartilage loss and clinical symptoms are preceded by collagen-proteoglycan (PG) matrix damage and elevated cartilage water content (8). Therefore, a sensitive technique for detecting these early structural and functional changes during the early stages of OA could be valuable for identifying the need for early treatment, monitoring response to treatment, and assessing efforts to prevent disease progression.
Relatively recent studies have shown the potential of MR imaging examinations, including T2 (9,10) and T1ρ (T1 relaxation time in the rotating frame) quantifications (11,12) and gadolinium-enhanced MR imaging of cartilage (13,14), to reveal changes in the biochemical composition of hyaline cartilage with early OA. Although these techniques have shown promise for characterizing the cartilage matrix composition, the segmentation of hyaline cartilage required for quantitative analysis is a cumbersome procedure that may take several hours per knee. In addition, OA is a multisystemic disease, the origin and progression of which are not attributable to disease in only one tissue, such as articular cartilage, but rather to disease in any tissues of the joint, including the subchondral bone, synovium, capsule, and meniscus (15). Thus, attention has also been focused on the meniscus because although its structure is similar to that of hyaline cartilage, the segmentation is substantially less challenging (16). Menisci and hyaline cartilage contain mainly water, collagen, and PGs. Krishnan et al (16) used gadolinium-enhanced MR imaging of cartilage to examine the meniscus and correlated the results with the articular cartilage findings in patients with OA and asymptomatic subjects. However, to our knowledge, the relationship between OA and meniscal T1ρ and T2 values had not been studied. Thus, the aim of this study was to prospectively evaluate the differences in T1ρ and T2 values in the meniscus at MR imaging in both patients with varying degrees of OA and healthy control subjects.
MATERIALS AND METHODS
Subjects and Clinical Assessment
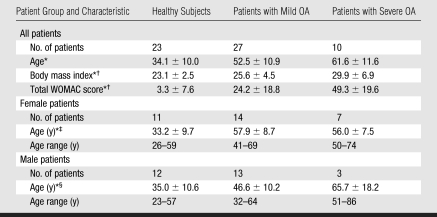
The authors had control of the data and information submitted for publication. The study was performed in accordance with the rules and regulations of the University of California Committee for Human Research and was Health Insurance Portability and Accountability Act compliant. Written informed consent was obtained from all subjects. Twenty-seven patients with mild OA, 10 patients with severe OA, and 23 healthy control subjects (Table 1) were recruited from February 2006 to April 2007.
Table 1.
Characteristics of the Study Population
Note.—WOMAC = Western Ontario and McMaster Osteoarthritis.
Mean values ± standard deviations.
There were significant differences (P < .05) in body mass index and WOMAC score between the three subject groups.
There was a significant difference (P < .05) in age between the healthy female subjects and the female patients with mild or severe OA but no significant difference in age between the female patients with mild OA and the female patients with severe OA.
There was a significant difference (P < .05) in age between the male subjects in each group.
Inclusion criteria for all subjects were good health according to medical history, physical examination, and clinical laboratory data and the absence of contraindications to MR imaging. Inclusion criteria for the patients specifically were mild radiographic signs of OA without joint space narrowing (grade 1 or 2 based on Kellgren-Lawrence OA classification system [17]) or severe radiographic signs of OA with joint space narrowing (Kellgren-Lawrence grade 3 or 4). For inclusion, subjects also had to have clinical symptoms of knee OA, such as frequent or chronic knee pain and limited function as assessed by using medical history and physical examination (18). Control subjects were included if they had no clinical evidence of knee OA, were examined by a sports medicine physician and found to have intact joint function with full strength, and had no history of chronic or frequent knee pain. Exclusion criteria were inflammatory arthritis and knee OA secondary to other causes (ie, acute or chronic infection, previous surgery, or previous fracture). All subjects completed a standardized clinical WOMAC questionnaire for measuring the degrees of pain, functional impairment, and stiffness on a five-point scale (no, slight, moderate, severe, or extreme) before undergoing MR imaging (19).
Imaging Techniques
We obtained anteroposterior radiographs of the knee in the standing position in all patients with OA to determine the Kellgren-Lawrence grade. MR imaging of the most severely affected knee joint in the patients with OA and of the dominant knee joint in the control subjects was performed by using a 3.0-T system (Signa; GE Medical Systems, Milwaukee, Wis) and a dedicated knee coil (Clinical MR Solutions, Brookfield, Wis). The dominant knee was identified by asking the control subject which leg he or she would use to kick a ball.
The morphology of the cartilage and other knee structures and the integrity of the meniscus were assessed by using a sagittal fat-saturated intermediate-weighted fast spin-echo sequence (4300/51 [repetition time msec/echo time msec], echo train length of nine, two acquired signals, acquisition time of 12 minutes 42 seconds, 45 sections, 16-cm field of view, 512 × 256 matrix, in-plane spatial resolution of 0.293 × 0.293 mm, 2-mm section thickness, 0.5-mm intersection gap) and a sagittal T1-weighted three-dimensional high-spatial-resolution volumetric fat-suppressed spoiled gradient-echo (SPGR) sequence (20/7.5, 12° flip angle, 512 × 512 matrix, 0.293 × 0.293-mm in-plane spatial resolution, 16-cm field of view, 0.75 acquired signal, acquisition time of 7 minutes 37 seconds, 1-mm section thickness).
Sagittal T1ρ and T2 mapping sequences were used to assess the meniscal matrix. Three-dimensional T1ρ-weighted images were obtained by using spin-lock techniques and an SPGR image acquisition, as previously described in detail by Li et al (20). In short, the sagittal three-dimensional T1ρ-weighted imaging sequence consisted of two parts: magnetization preparation for imparting T1ρ contrast and an elliptically centered segmented three-dimensional SPGR acquisition immediately after the T1ρ preparation during transient signal evolution. The main parameters used for this sequence were as follows: 9.3/3.7; 14-cm field of view; 256 × 192 matrix; 3-mm section thickness; receiver bandwidth of 31.25 kHz; 48 views per segment; recovery time of 1.5 seconds; spin-lock times of 0, 10, 40, and 80 msec; and spin-lock frequency of 500 Hz. The total acquisition time was 12 minutes 42 seconds. Sagittal three-dimensional T2 maps were acquired by adding a nonselective T2 preparation imaging sequence to the SPGR sequence used for T1ρ mapping and using a repetition time of 2000 msec and echo times of 4.1, 14.5, 25.0, and 45.9 msec. All other prescription parameters for the T2-weighted sequence were identical to those used for the T1ρ sequence, and the total acquisition time was 10 minutes 36 seconds.
With use of the model introduced by Collins et al (21), the estimated average specific absorption rate achieved with the parameters used in this study was 2.06 W/kg, which is substantially lower than the Food and Drug Administration–mandated maximal specific absorption rate of 12 W/kg in 1 g of tissue in the extremities averaged over 5 minutes.
Image Analysis
Meniscal T1ρ and T2 measurements.—Meniscus segmentation was performed by using in-house software (22) developed with Matlab (Mathworks, Natick, Mass) and a semiautomatic technique based on Bezier splines and edge detection. In each medial meniscus and lateral meniscus, distinct regions were defined and segmentation was performed on the sagittal three-dimensional SPGR images. The meniscal body was defined mesially as the first section where the anterior and posterior parts of the meniscus were connected and peripherally as the last section showing the meniscus without partial volume effects, which were characterized by a change in the signal intensity of the meniscus compared with the signal intensity of the adjacent sections. The posterior border of the posterior horn of the lateral meniscus was defined by the hiatus popliteus. The fascicles were not included in the analysis. The mesial and peripheral borders separating the meniscus from the roots and capsular ligaments were identified on the basis of partial volume effects and signal intensity changes: Only those areas that had the same signal intensity as the more central aspects of the menisci were segmented. The vascular pedicle was not excluded from the analysis because it could not be consistently visualized or segmented.
After segmentation, the meniscus was transformed into a three-dimensional binary mask with isotropic voxels, and T1ρ and T2 maps were reconstructed. The T1ρ and T2 maps were automatically coregistered to the SPGR images; the meniscal segmentations were then resampled and superimposed onto the T1ρ and T2 maps to define the regions of interest for T1ρ and T2 assessment. One observer (I.R.) performed the segmentations and analyses after undergoing 1 week of training with experienced investigators (X.L., J.C.) and under the supervision of an experienced musculoskeletal radiologist (T.M.L., 20 years experience in musculoskeletal radiology). The segmentation and analysis required about 30 minutes. No menisci were excluded. Figure 1 shows a segmented medial meniscus on an SPGR image.
Figure 1:
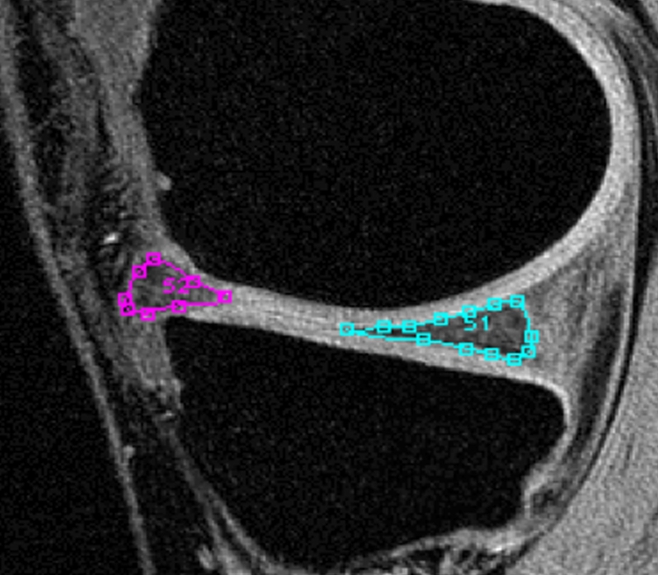
SPGR MR image (20/7.5, 12° flip angle) shows segmented anterior and posterior horns of medial meniscus.
Reproducibility measurements.—Coefficients of variation (CVs) were calculated to determine the reproducibility of measurements in the entire menisci (medial and lateral menisci combined) and in the meniscal subregions. Three subjects were randomly selected, and their menisci were segmented three times by the same investigator (I.R.). Note that the reproducibility assessment performed accounted for the variation in image analysis findings only and not for the variable error in data acquisitions.
Cartilage T1ρ and T2 measurements.—In addition to the menisci, hyaline articular cartilage was segmented in the control subjects and patients with mild OA by using the same software and semiautomatic technique (22). The articular cartilage was segmented in six regions: medial and lateral femora, medial and lateral tibiae, patella, and trochlea. These regions were combined into larger units—namely, the femoropatellar joint (trochlea and patella) and the medial and lateral femorotibial joints. Coregistration was performed as in the meniscus.
Whole-organ MR imaging scores.—Two experienced radiologists (T.M.L., R.S., 20 and 4 years experience, respectively) analyzed and scored the MR imaging findings in the knee joint in consensus by using a modified semiquantitative whole-organ MR imaging score (WORMS) (23). The WORMS was developed to semiquantitatively analyze OA by separately grading the following entities: articular cartilage integrity, subarticular bone marrow abnormality, subarticular cysts, subarticular bone attrition, marginal osteophytes, medial and lateral meniscal integrity, anterior and posterior cruciate ligament integrity, medial and lateral collateral ligament integrity, synovitis or effusion, intraarticular loose bodies, and periarticular cysts or bursitis (23). Seven compartments were analyzed: medial and lateral tibiae, trochlea, medial and lateral femora, and medial and lateral patellae. These compartments were combined into larger units—namely, the femur, lateral-medial compartment, tibia, patellofemoral compartment, and all compartments combined. We used the WORMS (23) to semiquantitatively grade cartilage abnormalities in terms of morphology and size and to semiquantitatively grade the bone marrow edema pattern in terms of size. Meniscal lesions were graded morphologically by differentiating between intrasubstance degeneration (grade 1), nondisplaced tears without deformity (grade 2), tears with deformity (grade 3), and severe destruction or maceration of the meniscus (grade 4).
Statistical Analyses
All statistical testing was performed with JMP, version 6, software (SAS Institute, Cary, NC). Descriptive statistical evaluation was performed, and differences in age between the male and female study subjects, in body mass index, and in WOMAC scores were compared by using standard t tests. After evaluating the mean T1ρ and T2 values (with standard deviations) for the segmented menisci, we performed analysis of variance with post hoc t tests and adjusted the data for multiple comparisons by using Bonferroni corrections. Differences were deemed to be significant at P < .05. To account for parameters that were significantly different between the three groups, such as age, we performed multivariate analysis with stepwise forward linear regression. Receiver operating characteristic analysis (24) was performed to better assess the diagnostic performance of T1ρ and T2 measurements in the differentiation of the healthy versus mild OA groups because these are the most clinically relevant populations and patients with severe OA can be easily identified on the basis of their cartilage morphology and meniscal abnormalities. The binomial model was fitted by using logistic regression; the discriminatory power of the model was analyzed by calculating the areas under the receiver operating characteristic curves (Az), with corresponding 95% confidence intervals.
The correlations between T1ρ and T2 measurements and both age and body mass index (expressed as R2 values) in the healthy subjects and the correlations between T1ρ and T2 values derived from cartilage and those derived from menisci in all subject groups were calculated by using linear regression analyses. R2 values were also calculated for correlations between meniscal T1ρ and T2 values and WORMS and WOMAC scores. In addition to P values, 95% confidence intervals of the correlation coefficients were generated with Fisher r to z transformation (25).
RESULTS
T1ρ and T2 Measurements in the Menisci
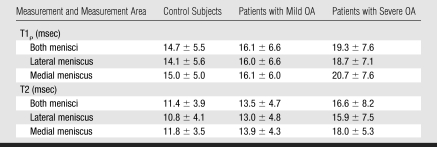
T1ρ and T2 values in the patients with OA were increased compared with values in the healthy subjects (Table 2). These values tended to correlate with degree of OA. Differences in T1ρ and T2 values among the three groups were significant (P < .05) (Table 3), the only exception being the difference in medial meniscus T1ρ between the control subjects and the patients with mild OA. Differences in T2 values between the three groups were more significant than differences in T1ρ values. Figure 2 shows representative fat-saturated intermediate-weighted fast spin-echo images and T1ρ and T2 maps obtained in subjects from each group. After adjustments for age in the multivariate regression model, differences in T2 values between the groups were significant (P < .05 for comparisons in entire meniscus [both menisci combined], medial meniscus, and anterior horns of medial and lateral menisci), but differences in T1ρ values were not. Body mass index and WOMAC scores were found to have no significant contribution in the multivariate regression model.
Table 2.
Meniscal T1ρ and T2 Measurements in Control Subjects and Patients with Mild or Severe OA
Note.—Data are mean values ± standard deviations.
Table 3.
P Values for Intergroup Comparisons of T1ρ and T2 Values
Significant difference (P < .05) after Bonferroni correction for multiple comparisons.
Figure 2a:
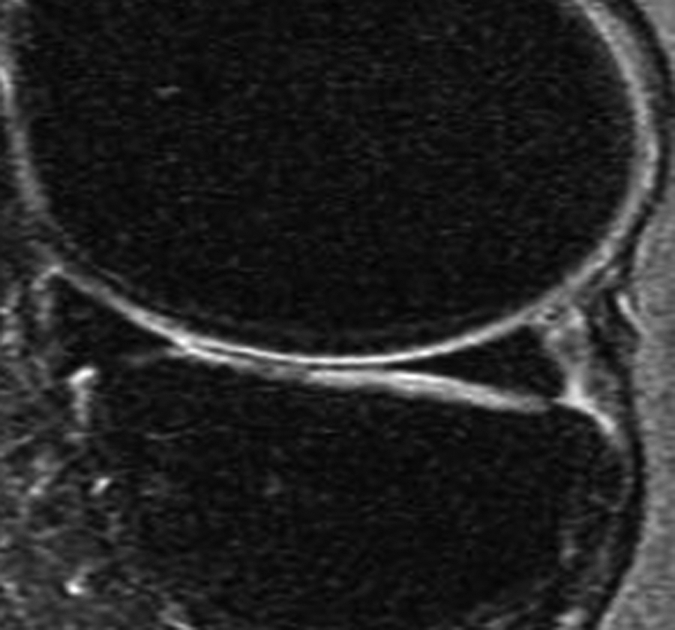
Representative MR images show medial meniscus in (a, d, g) a healthy subject, (b, e, h) a patient with mild OA, and (c, f, i) a patient with severe OA. (a–c) Fast spin-echo images (4300/51) show morphology of the menisci. In a and b, the meniscus appears normal, but c shows a tear in the anterior and posterior horns of the medial meniscus. Corresponding (d–f) T1ρ (in milliseconds) and (g–i) T2 (in milliseconds) color maps overlaid on SPGR images (20/7.5, 12° flip angle) clearly show differences in the meniscal matrix among the three subjects.
Figure 2b:
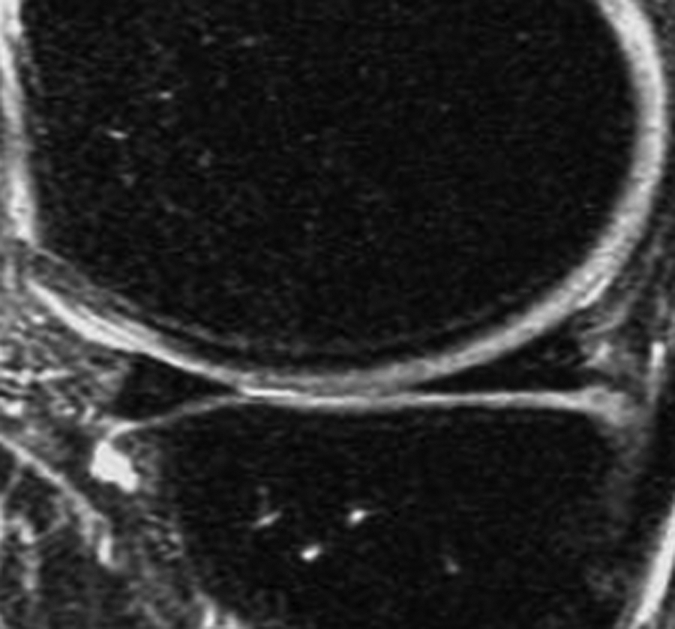
Representative MR images show medial meniscus in (a, d, g) a healthy subject, (b, e, h) a patient with mild OA, and (c, f, i) a patient with severe OA. (a–c) Fast spin-echo images (4300/51) show morphology of the menisci. In a and b, the meniscus appears normal, but c shows a tear in the anterior and posterior horns of the medial meniscus. Corresponding (d–f) T1ρ (in milliseconds) and (g–i) T2 (in milliseconds) color maps overlaid on SPGR images (20/7.5, 12° flip angle) clearly show differences in the meniscal matrix among the three subjects.
Figure 2c:
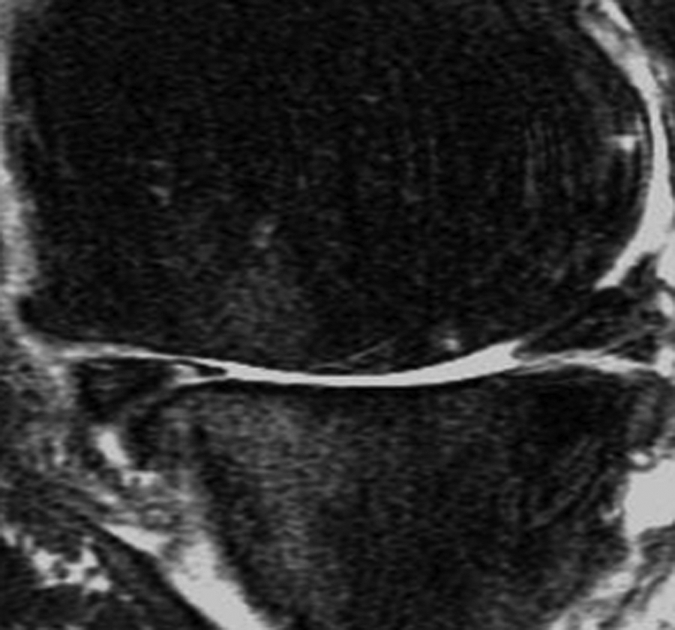
Representative MR images show medial meniscus in (a, d, g) a healthy subject, (b, e, h) a patient with mild OA, and (c, f, i) a patient with severe OA. (a–c) Fast spin-echo images (4300/51) show morphology of the menisci. In a and b, the meniscus appears normal, but c shows a tear in the anterior and posterior horns of the medial meniscus. Corresponding (d–f) T1ρ (in milliseconds) and (g–i) T2 (in milliseconds) color maps overlaid on SPGR images (20/7.5, 12° flip angle) clearly show differences in the meniscal matrix among the three subjects.
Figure 2d:
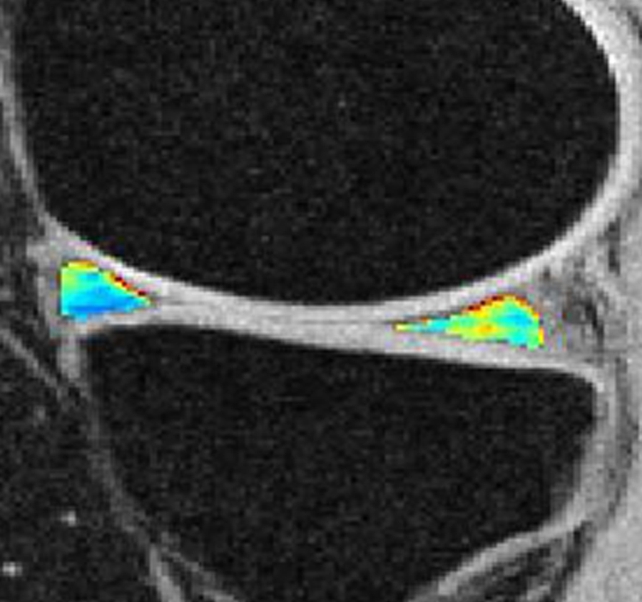
Representative MR images show medial meniscus in (a, d, g) a healthy subject, (b, e, h) a patient with mild OA, and (c, f, i) a patient with severe OA. (a–c) Fast spin-echo images (4300/51) show morphology of the menisci. In a and b, the meniscus appears normal, but c shows a tear in the anterior and posterior horns of the medial meniscus. Corresponding (d–f) T1ρ (in milliseconds) and (g–i) T2 (in milliseconds) color maps overlaid on SPGR images (20/7.5, 12° flip angle) clearly show differences in the meniscal matrix among the three subjects.
Figure 2e:
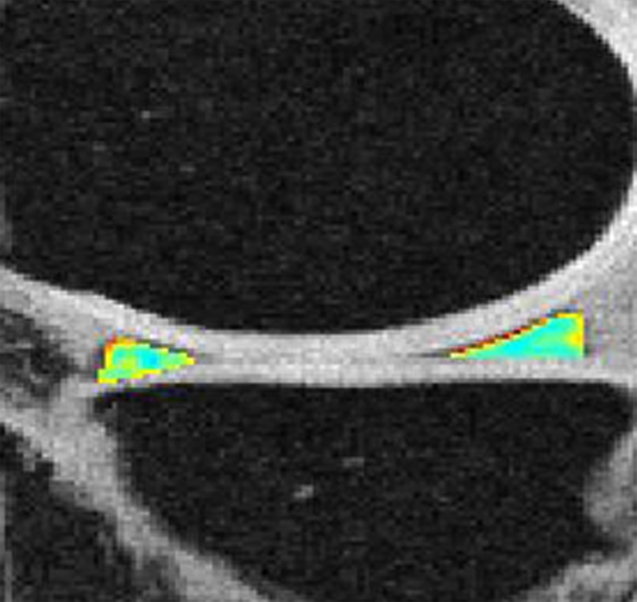
Representative MR images show medial meniscus in (a, d, g) a healthy subject, (b, e, h) a patient with mild OA, and (c, f, i) a patient with severe OA. (a–c) Fast spin-echo images (4300/51) show morphology of the menisci. In a and b, the meniscus appears normal, but c shows a tear in the anterior and posterior horns of the medial meniscus. Corresponding (d–f) T1ρ (in milliseconds) and (g–i) T2 (in milliseconds) color maps overlaid on SPGR images (20/7.5, 12° flip angle) clearly show differences in the meniscal matrix among the three subjects.
Figure 2f:
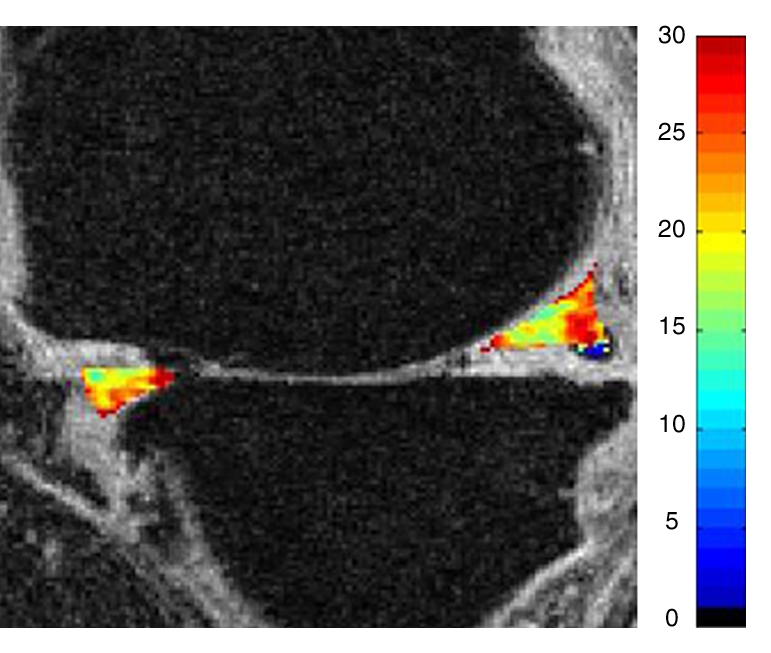
Representative MR images show medial meniscus in (a, d, g) a healthy subject, (b, e, h) a patient with mild OA, and (c, f, i) a patient with severe OA. (a–c) Fast spin-echo images (4300/51) show morphology of the menisci. In a and b, the meniscus appears normal, but c shows a tear in the anterior and posterior horns of the medial meniscus. Corresponding (d–f) T1ρ (in milliseconds) and (g–i) T2 (in milliseconds) color maps overlaid on SPGR images (20/7.5, 12° flip angle) clearly show differences in the meniscal matrix among the three subjects.
Figure 2g:
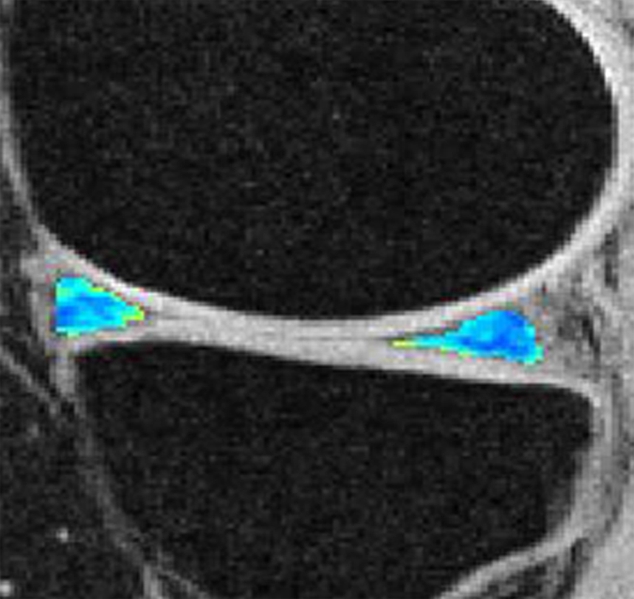
Representative MR images show medial meniscus in (a, d, g) a healthy subject, (b, e, h) a patient with mild OA, and (c, f, i) a patient with severe OA. (a–c) Fast spin-echo images (4300/51) show morphology of the menisci. In a and b, the meniscus appears normal, but c shows a tear in the anterior and posterior horns of the medial meniscus. Corresponding (d–f) T1ρ (in milliseconds) and (g–i) T2 (in milliseconds) color maps overlaid on SPGR images (20/7.5, 12° flip angle) clearly show differences in the meniscal matrix among the three subjects.
Figure 2h:
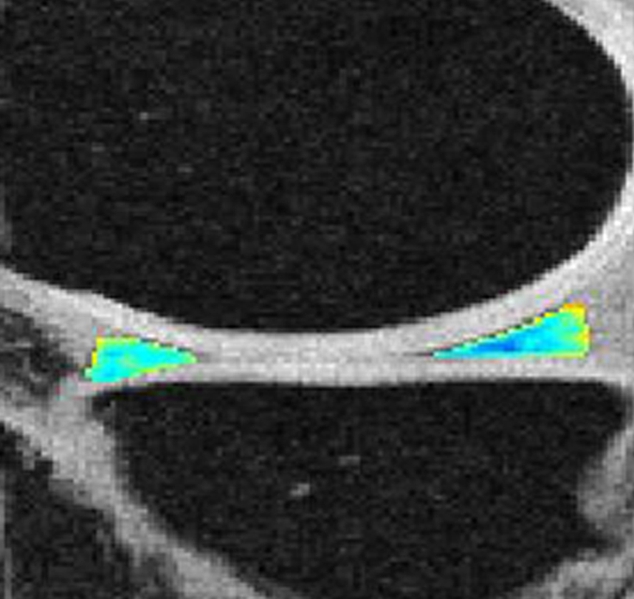
Representative MR images show medial meniscus in (a, d, g) a healthy subject, (b, e, h) a patient with mild OA, and (c, f, i) a patient with severe OA. (a–c) Fast spin-echo images (4300/51) show morphology of the menisci. In a and b, the meniscus appears normal, but c shows a tear in the anterior and posterior horns of the medial meniscus. Corresponding (d–f) T1ρ (in milliseconds) and (g–i) T2 (in milliseconds) color maps overlaid on SPGR images (20/7.5, 12° flip angle) clearly show differences in the meniscal matrix among the three subjects.
Figure 2i:
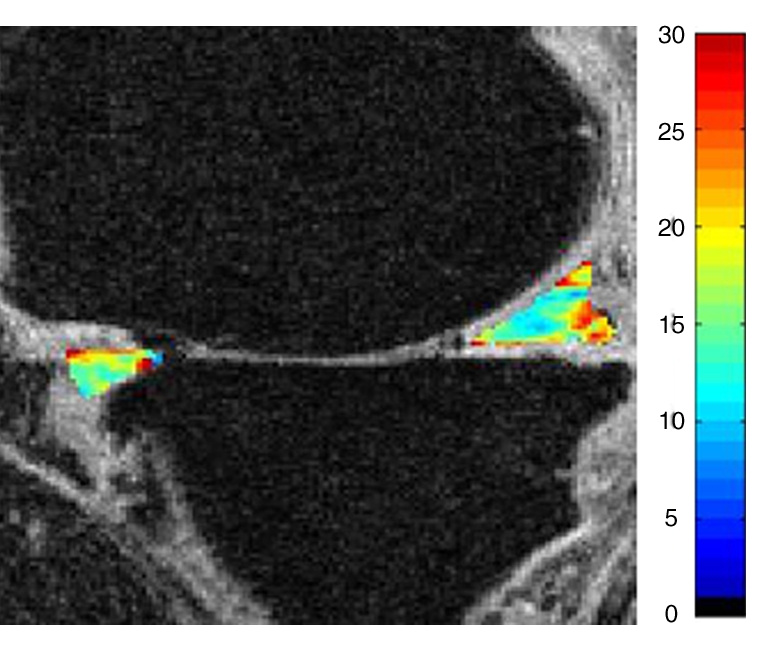
Representative MR images show medial meniscus in (a, d, g) a healthy subject, (b, e, h) a patient with mild OA, and (c, f, i) a patient with severe OA. (a–c) Fast spin-echo images (4300/51) show morphology of the menisci. In a and b, the meniscus appears normal, but c shows a tear in the anterior and posterior horns of the medial meniscus. Corresponding (d–f) T1ρ (in milliseconds) and (g–i) T2 (in milliseconds) color maps overlaid on SPGR images (20/7.5, 12° flip angle) clearly show differences in the meniscal matrix among the three subjects.
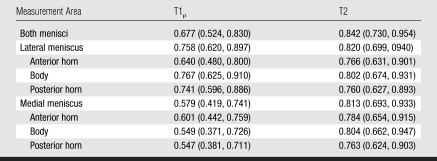
T2 in both menisci (lateral and medial menisci combined) had the highest diagnostic performance in differentiating control subjects from patients with mild OA (Az = 0.842), and T2 values in the medial and lateral menisci were similar (Table 4). Compared with the Az values for T2 differentiation performance, the Az values for T1ρ differentiation performance were lower in every meniscal compartment, and T1ρ Az values at the lateral meniscus were notably higher than those at the medial meniscus.
Table 4.
Az Values for Differentiation between Control Subjects and Patients with Mild OA Based on Meniscal T1ρ and T2 Measurements
Note.—Data are Az values, with 95% confidence intervals in parentheses.
Reproducibility Measurements
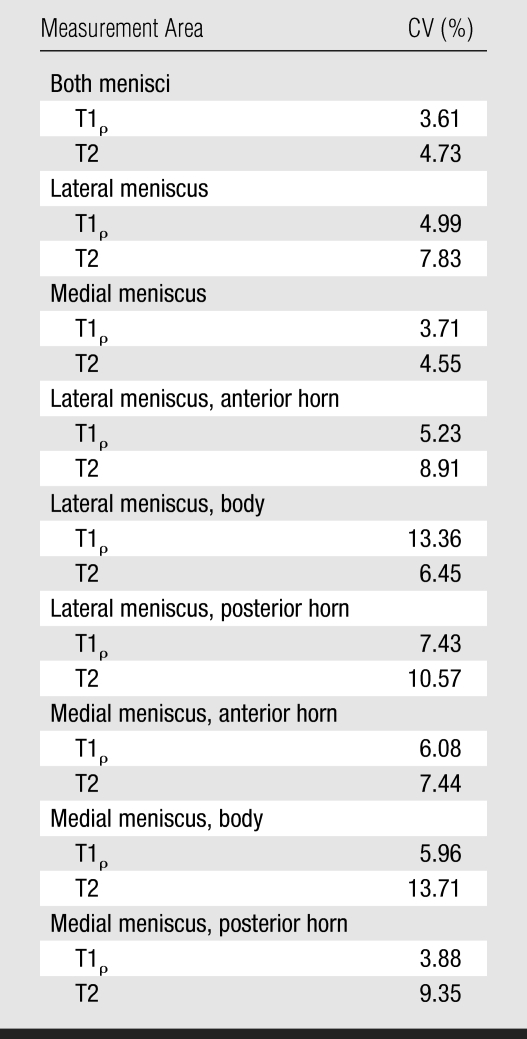
CVs were higher for T2 measurements than for T1ρ measurements (Table 5), indicating that T2 measurements may be less reproducible. For measurement reproducibility in the anterior and posterior horns of the menisci, CVs ranged from 3.88 (medial posterior horn T1ρ) to 10.57 (lateral posterior horn T2). The highest CVs were found in the bodies of the lateral and medial menisci, consistent with limited segmentation due to partial volume effects in these areas.
Table 5.
CVs for Reproducibility of T1ρ and T2 Measurements in Menisci and Meniscal Subregions
Relationships of Meniscal T1ρ and T2 with Age, Body Mass Index, Cartilage T1ρ and T2, WOMAC Score, and WORMS
Correlations of meniscal T1ρ and T2 with subject age and body mass index in the healthy subjects were nonsignificant in the majority of comparisons. Only the correlation between T2 for both menisci and age was found to be significant (R2 = 0.18, P = .0429).
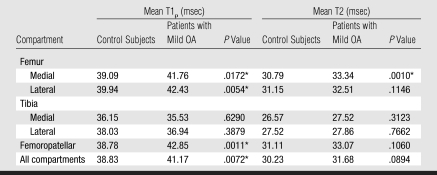
Femoral cartilage T1ρ and T2 values (Table 6) correlated significantly with medial and lateral meniscal T1ρ and T2 values (R2 = 0.22–029, P < .05) in the control subjects and patients with mild OA. However, tibial cartilage T1ρ and T2 values did not show significant correlations with meniscal values. The R2 value was 0.17 for the correlation between medial femorotibial cartilage compartment T1ρ and medial meniscal T1ρ and 0.24 for the correlation between medial femorotibial cartilage compartment T2 and medial meniscal T2. The R2 value was 0.14 for the correlation between lateral femorotibial cartilage compartment T1ρ and lateral meniscal T1ρ and 0.18 for the correlation between lateral femorotibial cartilage compartment T2 and lateral meniscal T2 (P < .05).
Table 6.
Mean Hyaline Cartilage T1ρ and T2 Measurements in Different Knee Compartments in Control Subjects and Patients with Mild OA
Significant difference (P < .05) in values between the two subject groups.
The range of Az values for the differentiation between hyaline cartilage T1ρ and T2 values in healthy subjects and those in patients with mild OA were similar to those calculated for the menisci: The highest Az values were 0.86 for femoropatellar cartilage T1ρ and 0.81 for medial femoral condyle cartilage T2. However, while in the menisci T2 had a better performance in the differentiation of the two groups, in the hyaline cartilage T1ρ had a better differentiation performance.
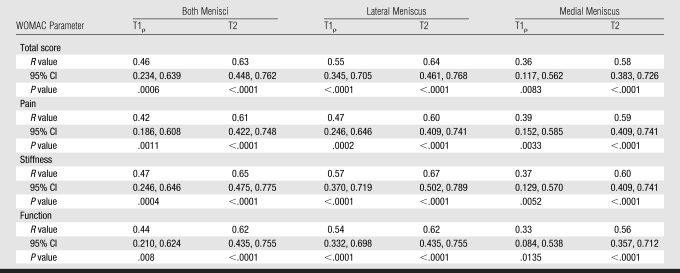
WOMAC scores were correlated with T1ρ and T2 measurements (Table 7). The highest correlations observed were those between T2 values in the lateral meniscus and both menisci combined and the WOMAC parameter stiffness (P < .05). Significant correlations were also observed between T2 in the lateral meniscus and both menisci combined and the total WOMAC score. Correlations with T2 measurements were consistently higher than correlations with T1ρ measurements. However, no significant correlations between articular cartilage T1ρ and T2 measurements and WOMAC scores were demonstrated.
Table 7.
Correlations of Meniscal T1ρ and T2 Measurements with Total and Individual-Parameter WOMAC Scores
Note.—CI = confidence interval.
Comparisons of WORMS with meniscal T1ρ and T2 revealed the most significant correlations with meniscal abnormality: The R2 was 0.53 for the correlations of WORMS with both medial meniscal T2 and medial meniscal T1ρ. Correlations with lateral meniscal values were substantially lower but still significant (P < .05). In the healthy group of 23 subjects, only two individuals had meniscal lesions: One subject had a grade 1 lesion at the medial meniscus, and one had a grade 2 lesion at the lateral meniscus. In the mild OA group of 27 patients, seven medial meniscal abnormalities were detected: two grade 3, two grade 2, and three grade 1 lesions. All 10 patients with severe OA had meniscal lesions of grades higher than 1. There were no significant differences in T1ρ and T2 values between the patients with mild OA who had meniscal lesions and the patients in this group who did not have these lesions. However, the two healthy subjects with meniscal lesions had higher T1ρ and T2 values compared with the other healthy subjects.
We observed significant correlations between the WORMS for medial joint compartment cartilage and the T1ρ (R2 = 0.38) and T2 (R2 = 0.20) values in the medial meniscus (P < .05) and between lateral joint compartment cartilage WORMS and lateral meniscal T2 (R2 = 0.15, P < .05). In addition, the WORMS for bone marrow edema pattern correlatedmildly but significantly with T2 (R2 = 0.30) and T1ρ (R2 = 0.11) values in both menisci combined (P < .05).
DISCUSSION
Our study results indicate significant differences in meniscal T1ρ and T2 values between healthy subjects, patients with mild OA, and patients with severe OA. These differences most likely reflect degeneration within the matrix of the menisci. An interesting finding was that in the menisci, T2 values were more useful than T1ρ values for differentiating the subject groups, but in the articular cartilage, T1ρ values were more useful for this differentiation. These meniscal matrix measurements correlated significantly with the clinical findings determined by using WOMAC scores.
To our knowledge, only one study of MR-based meniscal matrix measurements has been published previously: Krishnan et al (16) analyzed the T1 of gadolinium-based contrast material in the meniscus and the relationship between this parameter and the T1 of delayed gadolinium-based contrast material in the articular cartilage at gadolinium-enhanced MR imaging of cartilage data sets. Their study results showed that the T1 in the meniscus correlated significantly with that in the articular cartilage, potentially demonstrating associated degenerative processes in the knee joint. Mild yet significant correlations between meniscal and cartilage T1ρ and T2 values were also observed in our study.
Although hyaline cartilage has a PG concentration of 5%–10%, the concentration of PG in the meniscus is comparatively low: 1%–2% (26). It has been shown that T1ρ correlates highly with PG content in the cartilage (27). Since loss of PG is the initiating event in early OA, and given the fact that neither the content nor the type of collagen in the cartilage is modified during early OA (28), the T1ρ parameter appears to be well suited for differentiating patients with early OA from healthy control subjects.
On the other hand, T2 is sensitive to interactions between water molecules and the macromolecular concentration and structure of the extracellular matrix (29–31), especially such interactions based on the content, orientation, and anisotropy of collagen (32,33). The correlation of T2 with PG, however, remains controversial. Although Watrin-Pinzano et al (34) found significantly increased T2 with hyaluronidase-induced PG degeneration, in other studies, the depletion of PG had little influence on T2 (31,35,36). Compared with articular cartilage, which has a type 2 collagen concentration of 10%–20%, the meniscus has a higher type 1 collagen concentration: 15%–25% (37). The higher collagen concentration in the meniscus may in part also explain the lower meniscal T2 values compared with the cartilage T2 values.
The factors that contribute to T1ρ changes in the meniscus are not clear and need further investigation. In cartilage, changes in collagen and hydration may affect T1ρ. However, even with the current spin-lock frequency (500 Hz) of clinical MR imagers, T1ρ values are approximately 30% higher than T2 values in cartilage and approximately 20% higher in the menisci. Spin locking reduces dipolar interaction, which dominates T2 relaxation. Previous study findings have suggested that chemical exchanges between bulk water and the hydroxyl and amine groups of PG may be important relaxation mechanisms for T1ρ in articular cartilage (38). Studies have also shown that T1ρ is more sensitive to PG changes than is T2 in degenerated cartilage (39,40).
Previous study investigators have quantified T1ρ and T2 measurements in the articular cartilage of control subjects and patients with OA and reported higher T1ρ (11,12,38,41) and T2 (9,42) in the cartilage of patients with OA. A previous study in which T1ρ and T2 measurement techniques were compared revealed better results with T1ρ measurements (11). However, in our study of the meniscus, T2 measurements yielded better results. This might be explained by differences in the biochemical composition of these tissues.
The changes in meniscal T1ρ and T2 values with increasing OA severity were supported by significant correlations with the WOMAC scores. The highest such correlation observed was that with combined T2 measurements for the lateral meniscus. We find it interesting that previous studies of the correlations of WOMAC scores with focal cartilage abnormalities, meniscal abnormalities, and T2 measurements have revealed lower R2 values (43,44). This is a complex issue, and it has been hypothesized that patients with more advanced disease, characterized by morphologic cartilage lesions and meniscal and ligamentous abnormalities, could be treated with pain medications and might be able to adapt to more advanced disease (44). Regarding MR matrix measurements of the hyaline cartilage and meniscus, it should be noted that an abnormal matrix pattern is seen in early disease and that, to our knowledge, the results of only smaller-scale studies of the relationships between T2 and T1ρ in the hyaline cartilage and clinical findings are available. Clearly, larger-scale studies are required.
Because there were gaps in age between the subject groups studied, we used multivariate regression analysis to study the effects of age. Interestingly, T2 values were still significant at this analysis, whereas no T1ρ values were. It appears that T1ρ measurements are substantially affected by age. Similar findings for the hyaline cartilage were reported in a previous study (45). Therefore, it is not entirely clear whether T1ρ measurements are related to the aging process, regardless of the presence of OA; however, it is difficult to separate these issues because degeneration is also age related.
Receiver operating characteristic analysis to assess the diagnostic performance of T1ρ and T2 in the differentiation between healthy and mild OA–affected subjects revealed similar Az values for the menisci and articular cartilage. Given the time-consuming segmentation of the articular cartilage—it may take 2–4 hours for a whole knee joint—meniscal matrix characterization, which involves a segmentation time of about 20 minutes, has the potential to serve as an alternative technique. However, given the limited sample size and the lack of hypothesis testing of equivalence in this study, further investigation is required.
In our study, we analyzed the entire meniscus without considering zonal variations. This may have been a limitation, and future cadaver studies will be required to analyze T1ρ and T2 values in the anatomic subregions of the menisci. In addition, the CVs in our study were relatively high and thus consistent with limited reproducibility. Only a small number of subjects were examined, and CVs were obtained for image analysis and not after the subjects had undergone another imaging examination. The high CVs obtained suggest that the reproducibility was not adequate for longitudinal studies. Clearly, more automated segmentation that improves the precision of this technique will need to be developed.
The fat-saturated intermediate- spin-echo sequence used for morphologic imaging in our study represents a compromise approach applied to achieve good visualization of the cartilage morphology, bone marrow, ligaments, and menisci. The use of additional intermediate-weighted sequences has been suggested for visualization of meniscal abnormalities, but owing to time constraints, only one morphologic sequence was possible. However, we did use a section thickness of 2 mm and had an increased signal-to-noise ratio with 3.0-T imaging (as opposed to the signal-to-noise ratio at routine 1.5-T imaging), potentially improving the visualization of meniscal abnormalities compared with the visualization at standard MR imaging.
There also may be concern that the identification of a correlation of meniscal T1ρ and T2 measurements with early OA does not mean that these measurements represent a more sensitive indicator of OA than currently used indicators. However, our findings show that this is a feasible technique. The fact that meniscal measurements correlated with WOMAC scores—although this has not been shown previously for morphologic markers of OA (44) or for cartilage T1ρ and T2 measurements—suggests that this technique may be suited for enabling a better understanding of the clinical symptoms related to OA.
In rheumatologic studies, the established reference standards for identifying and grading findings in patients with OA are clinical findings and Kellgren-Lawrence grades. In time, these may be replaced by semiquantitative and quantitative MR-based biomarkers.
This study is a first step in an ongoing investigation of the relationship between OA progression and T1ρ and T2 measurements. Before these measurements are implemented clinically they need to be validated, and one of the steps in the validation process is to show that different measurements are obtained in subjects with different grades of OA. The long-term goal is to be able to identify early matrix changes of the menisci and cartilage that indicate increased risk for OA in these subjects and monitor new therapies that prevent OA. Thus, these measurements may have a substantial effect on OA prevention.
In conclusion, the results of this study demonstrate that meniscal matrix measurements, T2 values in particular, may be used to differentiate healthy subjects from individuals with early OA. Matrix measurements increased consistently with higher OA grade. In addition, significant correlations between matrix measurements in the meniscus and clinical scores were found; however, these correlations involving the same parameters were not significant in the hyaline cartilage.
ADVANCES IN KNOWLEDGE
Calculated MR-based T1ρ (T1 relaxation time in the rotating frame) and T2 values in the menisci enabled the differentiation of healthy subjects from patients with mild or severe osteoarthri-tis (OA).
While in the fibrocartilage of the menisci, T2 measurements are better for differentiating healthy subjects from individuals with mild or severe OA, in the hyaline cartilage, T1ρ performs better in the differentiation of the three subject groups.
The matrix parameters T1ρ and T2 in the menisci correlate with clinical symptoms based on Western Ontario and McMaster Osteoarthritis scores.
IMPLICATION FOR PATIENT CARE
Calculated T1ρ and T2 values in the menisci have the potential to be used as biomarkers for diagnosing early OA—the disease stage when potential therapeutic interventions may be most useful.
Abbreviations
AZ = area under receiver operating characteristic curve
CV = coefficient of variation
OA = osteoarthritis
PG = proteoglycan
SPGR = spoiled gradient echo
T1ρ = T1 relaxation time in rotating frame
WOMAC = Western Ontario and McMaster Osteoarthritis
WORMS = whole-organ MR imaging score
Author contributions: Guarantors of integrity of entire study, S.M., T.M.L.; study concepts/study design or data acquisition or data analysis/interpretation, all authors; manuscript drafting or manuscript revision for important intellectual content, all authors; manuscript final version approval, all authors; literature research, I.R., T.M.L.; clinical studies, A.L., T.M.L.; statistical analysis, I.R., M.B.H., S.M., T.M.L.; and manuscript editing, I.R., R.S., X.L., M.B.H., A.L., S.M., T.M.L.
Authors stated no financial relationship to disclose.
Funding: This research was funded by the National Institutes of Health (grant R01 AR46905).
References
- 1.Oliveria SA, Felson DT, Reed JI, Cirillo PA, Walker AM. Incidence of symptomatic hand, hip, and knee osteoarthritis among patients in a health maintenance organization. Arthritis Rheum 1995;38:1134–1141. [DOI] [PubMed] [Google Scholar]
- 2.Gold GE, McCauley TR, Gray ML, Disler DG. What's new in cartilage? RadioGraphics 2003;23:1227–1242. [DOI] [PubMed] [Google Scholar]
- 3.Lang P, Noorbakhsh F, Yoshioka H. MR imaging of articular cartilage: current state and recent developments. Radiol Clin North Am 2005;43:629–639. [DOI] [PubMed] [Google Scholar]
- 4.Link TM, Stahl R, Woertler K. Cartilage imaging: motivation, techniques, current and future significance. Eur Radiol 2007;17:1135–1146. [DOI] [PubMed] [Google Scholar]
- 5.Recht MP, Resnick D. Magnetic resonance imaging of articular cartilage: an overview. Top Magn Reson Imaging 1998;9:328–336. [PubMed] [Google Scholar]
- 6.Eckstein F, Heudorfer L, Faber SC, Burgkart R, Englmeier KH, Reiser M. Long-term and resegmentation precision of quantitative cartilage MR imaging (qMRI). Osteoarthritis Cartilage 2002;10:922–928. [DOI] [PubMed] [Google Scholar]
- 7.Peterfy C, Dijke C, Janzen D, et al. Quantification of articular cartilage in the knee with pulse saturation transfer subtraction and fat-suppressed MR imaging: optimization and validation. Radiology 1994;192:485–491. [DOI] [PubMed] [Google Scholar]
- 8.Mankin HJ, Brandt KD. Pathogenesis of arthritis. In: Textbook of rheumatology. Philadelphia, Pa: Saunders, 1993.
- 9.Dunn TC, Lu Y, Jin H, Ries MD, Majumdar S. T2 relaxation time of cartilage at MR imaging: comparison with severity of knee osteoarthritis. Radiology 2004;232:592–598. [DOI] [PMC free article] [PubMed] [Google Scholar]
- 10.Mosher TJ, Dardzinski BJ. Cartilage MRI T2 relaxation time mapping: overview and applications. Semin Musculoskelet Radiol 2004;8:355–368. [DOI] [PubMed] [Google Scholar]
- 11.Li X, Benjamin Ma C, Link TM, et al. In vivo T(1rho) and T(2) mapping of articular cartilage in osteoarthritis of the knee using 3T MRI. Osteoarthritis Cartilage 2007;15:789–797. [DOI] [PMC free article] [PubMed] [Google Scholar]
- 12.Regatte RR, Akella SV, Wheaton AJ, et al. 3D-T1rho-relaxation mapping of articular cartilage: in vivo assessment of early degenerative changes in symptomatic osteoarthritic subjects. Acad Radiol 2004;11:741–749. [DOI] [PubMed] [Google Scholar]
- 13.Burstein D, Gray M. New MRI techniques for imaging cartilage. J Bone Joint Surg Am 2003;85-A(suppl 2):70–77. [DOI] [PubMed]
- 14.Bashir A, Gray ML, Boutin RD, Burstein D. Glycosaminoglycan in articular cartilage: in vivo assessment with delayed Gd(DTPA)(2-)-enhanced MR imaging. Radiology 1997;205:551–558. [DOI] [PubMed] [Google Scholar]
- 15.Brandt KD, Radin EL, Dieppe PA, van de Putte L. Yet more evidence that osteoarthritis is not a cartilage disease. Ann Rheum Dis 2006;65:1261–1264. [DOI] [PMC free article] [PubMed] [Google Scholar]
- 16.Krishnan N, Shetty SK, Williams A, Mikulis B, McKenzie C, Burstein D. Delayed gadolinium-enhanced magnetic resonance imaging of the meniscus: an index of meniscal tissue degeneration? Arthritis Rheum 2007;56:1507–1511. [DOI] [PubMed] [Google Scholar]
- 17.Kellgren J, Lawrence J. Radiological assessment of osteoarthritis. Ann Rheum Dis 1957;16:494–501. [DOI] [PMC free article] [PubMed] [Google Scholar]
- 18.Altman R, Asch E, Bloch D, et al. Development of criteria for the classification and reporting of osteoarthritis: classification of osteoarthritis of the knee—Diagnostic and Therapeutic Criteria Committee of the American Rheumatism Association. Arthritis Rheum 1986;29:1039–1049. [DOI] [PubMed] [Google Scholar]
- 19.Bellamy N, Buchanan W, Goldsmith C, Campbell J, Stitt L. Validation study of WOMAC: a health status instrument for measuring clinically important patient relevant outcomes to antirheumatic drug therapy in patients with osteoarthritis of the hip or knee. J Rheumatol 1988;15:1833–1840. [PubMed] [Google Scholar]
- 20.Li X, Han ET, Busse RF, Majumdar S. In vivo T(1rho) mapping in cartilage using 3D magnetization-prepared angle-modulated partitioned k-space spoiled gradient echo snapshots (3D MAPSS). Magn Reson Med 2008;59:298–307. [DOI] [PMC free article] [PubMed] [Google Scholar]
- 21.Collins CM, Li S, Smith MB. SAR and B1 field distributions in a heterogeneous human head model within a birdcage coil: specific energy absorption rate. Magn Reson Med 1998;40:847–856. [DOI] [PubMed] [Google Scholar]
- 22.Carballido-Gamio J, Bauer J, Lee KY, Krause S, Majumdar S. Combined image processing techniques for characterization of MRI cartilage of the knee. Conf Proc IEEE Eng Med Biol Soc 2005;3:3043–3046. [DOI] [PubMed] [Google Scholar]
- 23.Peterfy CG, Guermazi A, Zaim S, et al. Whole-organ magnetic resonance imaging score (WORMS) of the knee in osteoarthritis. Osteoarthritis Cartilage 2004;12:177–190. [DOI] [PubMed] [Google Scholar]
- 24.Metz C. Basic principles of ROC analysis. Semin Nucl Med 1978;8:283–298. [DOI] [PubMed] [Google Scholar]
- 25.Fisher R. On the ‘probable error’ of a coefficient of correlation deduced from a small sample. Metron 1921;1:3–32. [Google Scholar]
- 26.McNicol D, Roughley PJ. Extraction and characterization of proteoglycan from human meniscus. Biochem Genet 1980;185:705–713. [DOI] [PMC free article] [PubMed] [Google Scholar]
- 27.Akella SV, Regatte RR, Gougoutas AJ, et al. Proteoglycan-induced changes in T1rho-relaxation of articular cartilage at 4T. Magn Reson Med 2001;46:419–423. [DOI] [PubMed] [Google Scholar]
- 28.Dijkgraaf LC, de Bont LG, Boering G, Liem RS. The structure, biochemistry, and metabolism of osteoarthritic cartilage: a review of the literature. J Oral Maxillofac Surg 1995;53:1182–1192. [DOI] [PubMed] [Google Scholar]
- 29.Fragonas E, Mlynarik V, Jellus V, et al. Correlation between biochemical composition and magnetic resonance appearance of articular cartilage. Osteoarthritis Cartilage 1998;6:24–32. [DOI] [PubMed] [Google Scholar]
- 30.Liess C, Lusse S, Karger N, Heller M, Gluer CC. Detection of changes in cartilage water content using MRI T2-mapping in vivo. Osteoarthritis Cartilage 2002;10:907–913. [DOI] [PubMed] [Google Scholar]
- 31.Mlynarik V, Trattnig S, Huber M, Zembsch A, Imhof H. The role of relaxation times in monitoring proteoglycan depletion in articular cartilage. J Magn Reson Imaging 1999;10:497–502. [DOI] [PubMed] [Google Scholar]
- 32.Goodwin DW, Zhu H, Dunn JF. In vitro MR imaging of hyaline cartilage: correlation with scanning electron microscopy. AJR Am J Roentgenol 2000;174:405–409. [DOI] [PubMed] [Google Scholar]
- 33.Xia Y, Moody JB, Burton-Wurster N, Lust G. Quantitative in situ correlation between microscopic MRI and polarized light microscopy studies of articular cartilage. Osteoarthritis Cartilage 2001;9:393–406. [DOI] [PubMed] [Google Scholar]
- 34.Watrin-Pinzano A, Ruaud JP, Olivier P, et al. Effect of proteoglycan depletion on T2 mapping in rat patellar cartilage. Radiology 2005;234:162–170. [DOI] [PubMed] [Google Scholar]
- 35.Borthakur A, Shapiro EM, Beers J, Kudchodkar S, Kneeland JB, Reddy R. Sensitivity of MRI to proteoglycan depletion in cartilage: comparison of sodium and proton MRI. Osteoarthritis Cartilage 2000;8:288–293. [DOI] [PubMed] [Google Scholar]
- 36.Toffanin R, Mlynarik V, Russo S, Szomolanyi P, Piras A, Vittur F. Proteoglycan depletion and magnetic resonance parameters of articular cartilage. Arch Biochem Biophys 2001;390:235–242. [DOI] [PubMed] [Google Scholar]
- 37.Mow VC, Huiskes R, eds. Basic orthopaedic biomechanics and mechano-biology. 3rd ed. Philadelphia, Pa: Lippincott Williams & Wilkins, 2004.
- 38.Duvvuri U, Goldberg AD, Kranz JK, et al. Water magnetic relaxation dispersion in biological systems: the contribution of proton exchange and implications for the noninvasive detection of cartilage degradation. Proc Natl Acad Sci U S A 2001;98:12479–12484. [DOI] [PMC free article] [PubMed] [Google Scholar]
- 39.Regatte RR, Akella SV, Borthakur A, Kneeland JB, Reddy R. Proteoglycan depletion-induced changes in transverse relaxation maps of cartilage: comparison of T2 and T1rho. Acad Radiol 2002;9:1388–1394. [DOI] [PubMed] [Google Scholar]
- 40.Regatte RR, Akella SV, Lonner JH, Kneeland JB, Reddy R. T1rho relaxation mapping in human osteoarthritis (OA) cartilage: comparison of T1rho with T2. J Magn Reson Imaging 2006;23:547–553. [DOI] [PubMed] [Google Scholar]
- 41.Li X, Han ET, Ma CB, Link TM, Newitt DC, Majumdar S. In vivo 3T spiral imaging based multi-slice T(1rho) mapping of knee cartilage in osteoarthritis. Magn Reson Med 2005;54:929–936. [DOI] [PubMed] [Google Scholar]
- 42.Blumenkrantz G, Stahl R, Carballido Gamio J, Link T, Majumdar S. Longitudinal changes in the heterogeneity of cartilage T2 in osteoarthritis subjects [abstr]. In: Proceedings of the 15th Meeting of the International Society for Magnetic Resonance in Medicine. Berkeley, Calif: International Society for Magnetic Resonance in Medicine, 2007.
- 43.Stahl R, Blumenkrantz G, Carballido-Gamio J, et al. MRI-derived T2 relaxation times and cartilage morphometry of the tibio-femoral joint in subjects with and without osteoarthritis during a 1-year follow-up. Osteoarthritis Cartilage 2007;15:1225–1234. [DOI] [PubMed] [Google Scholar]
- 44.Link TM, Steinbach LS, Ghosh S, et al. Osteoarthritis: MR imaging findings in different stages of disease and correlation with clinical findings. Radiology 2003;226:373–381. [DOI] [PubMed] [Google Scholar]
- 45.Stahl R, Luke A, Ma B, et al. Cartilage pathology, T1rho and T2 in patients with early osteoarthritis as well as asymptomatic, active and sedentary subjects. Eur Radiol (in press).


