

Abstract
A Papua New Guinea field collection of the marine cyanobacterium Blennothrix cantharidosmum was investigated for its cytotoxic constituents. Bioassay-guided isolation defined the cytotoxic components as the known compounds lyngbyastatins 1 and 3. However, six new acyl proline derivatives, tumonoic acids D-I, plus the known tumonoic acid A, were also isolated. Their planar structures were defined from NMR and MS data while their stereostructures followed from a series of chiral chromatographies, degradation sequences and synthetic approaches. The new compounds were tested in an array of assays, but showed only modest antimalarial and inhibition of quorum sensing activities. Nevertheless, these are the first natural products to be reported from this genus, and this inspired a detailed morphologic and 16S rDNA-based phylogenetic analysis of the producing organism.
Cyanobacteria are an ancient group of organisms well known for their prolific production of natural products.1,2 Several genera, such as Lyngbya and Microcystis, have been well investigated for production of both dangerous toxins and drug leads.3,4 However, there are numerous other cyanobacterial genera that have not been studied in such detail. Recent advances in the molecular taxonomy of cyanobacteria have allowed more rapid and precise identification of cyanobacterial specimens and have the potential to assist in the discovery of new natural products from some of these lesser-known genera.
Blennothrix cantharidosmum Komárek (formerly Hydrocoleum Gomont) is one of the most abundant species of mat-forming benthic cyanobacteria in the tropics5 and an important contributor to nitrogen fixation.6 Under bacteriological systems, Blennothrix has been assigned as a sub-genus of Microcoleus based on several common morphological features, most distinctively, the presence of multiple trichomes within a single sheath.7 However, recent phylogenetic studies have shown that Blennothrix species are more closely related to the common planktonic genus Trichodesmium.5,8 Despite their widespread occurrence, very few studies have been carried out on the chemistry of Blennothrix, and these studies have focused solely on their pigments.5,9 In this manuscript, we describe the first secondary metabolites reported from a Blennothrix species, and further investigate the taxonomy of this important genus of marine cyanobacterium.
Results and Discussion
Natural products isolation and structure elucidation
The strain was collected near Duke of York Island in Papua New Guinea in 2005. The specimen was extracted with CH2Cl2– MeOH, and fractionated by silica vacuum liquid chromatography. Initial assays revealed activity against an H-460 cell line in several of the polar fractions, which were subsequently fractionated by reversed-phase solid phase extraction (SPE) and HPLC to yield the known metabolites lyngbyastatins 110 and 311 as the active metabolites, in addition to six new acylproline derivatives, the tumonoic acids D-I (1-6), as well as the known compound tumonoic acid A (7).12 Structures of the tumonoic acids are given in Figure 1.
Figure 1.
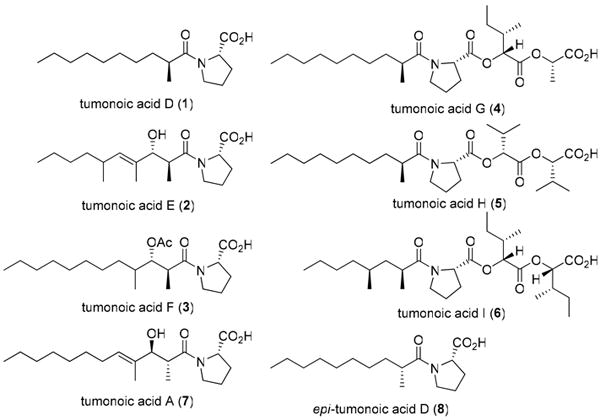
Structures of tumonoic acids D-I (1-6), A (7), and epi-tumonoic acid D (8). Configurations for the fatty acid portions of 2-6 are relative only.
The molecular formula of tumonoic acid D (1) was determined to be C16H29NO3 by HRESIMS (m/z 284.2211, [M+H]+). Analysis of 1H NMR data (Table 1) revealed downfield resonances (δH 4.64, d; 3.62, ddd; 3.51, ddd) characteristic of a proline residue, while the large methylene envelope (δH 1.24–1.28) and methyl signals (δH 1.15, d; 0.88, t) suggested a branched fatty acid. HMBC correlations from the methyl doublet to carbons at 179.9, 38.1 and 34.1 ppm confirmed its location at C-2. 2D NMR analysis (Figure 2) enabled the assignment of all protons and carbons in the proline residue, and the terminal regions of the fatty acid moiety. The three remaining carbons (δC 29.2, 29.4, 29.6) were assigned as the methylene carbons in the central portion of the fatty acid, which was consistent with the observed molecular formula. However, no HMBC correlations were observed linking the proline and fatty acid portions of 1, but based on the downfield shifts of H-2′ and H-5′, it was clear that the proline nitrogen was part of an amide group, leading to the structure shown.
Table 1.
NMR Data (CDCl3) for tumonoic acids D-F (1-3)a
| tumonoic acid D (1) | tumonoic acid E (2) | tumonoic acid F (3) | ||||
|---|---|---|---|---|---|---|
| δC | δH | δC | δH | δC | δH | |
| fatty acid | ||||||
| 1 | 179.9 | 178.2 | 175.6 | |||
| 2 | 38.1 | 2.59 dq (6.8, 6.8) | 41.3 | 2.82 dq (6.8, 6.5) | 40.0 | 2.96 dq (9.6, 6.8) |
| 3 | 34.1 | 1.69 m, 1.43 m | 80.6 | 4.15 d (6.5) | 77.5 | 5.21 dd (9.6, 1.5) |
| 4 | 27.5 | 1.26 m | 132.3 | 33.9 | 1.75 br tq (5.9, 6.7) | |
| 5 | 29.6 | 1.25 m | 137.0 | 5.23 d (9.3) | 33.6 | 1.31 m |
| 6 | 29.4 | 1.25 m | 32.1 | 2.38 m | 27.3 | 1.25 m |
| 7 | 29.2 | 1.25 m | 37.1 | 1.33 m, 1.21 m | 29.7 | 1.25 m |
| 8 | 31.8 | 1.24 m | 28.8 | 1.22 m | 29.2 | 1.25 m |
| 9 | 22.6 | 1.28 m | 22.7 | 1.29 m | 29.5 | 1.25 m |
| 10 | 14.1 | 0.88 t (6.8) | 14.1 | 0.87 t (7.2) | 31.8 | 1.25 m |
| 11 | 22.6 | 1.28 m | ||||
| 12 | 14.1 | 0.88 t (6.9) | ||||
| 2-Me | 16.8 | 1.15 d (6.8) | 14.3 | 1.05 d (6.8) | 13.7 | 1.14 d (6.8) |
| 4-Me | 10.9 | 1.63 brs | 12.9 | 0.91 d (6.8) | ||
| 6-Me | 20.9 | 0.95 d (6.6) | ||||
| OAc | 169.9 20.8 | 1.99 s | ||||
| proline | ||||||
| 1′ | 171.4 | n/ob | 172.8 | |||
| 2′ | 60.5 | 4.64 d (7.6) | 60.2 | 4.62 d (9.5) | 59.7 | 4.55 dd (8.1, 2.5) |
| 3′ | 26.6 | 2.56 m 1.94 m | 27.3 | 2.51 m 2.03 m | 27.8 | 2.41 ddd (2.5, 6.1, 10.0) 2.00 m |
| 4′ | 24.8 | 2.03 m | 24.8 | 2.04 m | 24.6 | 2.10 m |
| 5′ | 48.0 | 3.62 ddd (9.5, 7.8, 3.2) 3.51 ddd (9.8, 9.5, 7.1) | 48.0 | 3.71 ddd (9.2, 7.6, 7.6) 3.60 ddd (9.2, 7.0, 3.6) | 47.7 | 3.64 dd (8.4, 5.1) |
1H NMR spectra were recorded at 500 MHz, and 13C spectra at 75 MHz.
not observed.
Figure 2.

Elucidation of planar structures of tumonoic acids D-I (1-6). COSY correlations are indicated by bolded bonds, while key HMBC correlations are designated by arrows (proton to carbon).
Tumonoic acid E (2) (C18H31NO4, m/z 326.2321, [M+H]+) possessed more complex 1H and 13C NMR spectra than 1. While resonances consistent with a proline residue were present, it was clear that the fatty acid moiety of 2 was more highly functionalized. The presence of a downfield doublet (δH 5.23, d), along with two sp2 carbon resonances (δC 137.0, 132.3), suggested the presence of a double bond. Also observed were resonances consistent with an oxygenated methine (δH 4.15, d; δC 80.6), and two additional methyls. A broad IR stretch at 3381 cm-1 confirmed the presence of a free hydroxy group. COSY and HMBC correlations (Figure 2) situated the oxygenated methine at H-3, while HMBC correlations from the three methyl groups (δH 1.05, d; δC 14.3, δH 1.63, brs; δC 10.9, and δH 0.95, d; δC 20.9) confirmed their positions at C-2, C-4, and C-6, respectively. Likewise, HMBC correlations situated the vinylic proton at H-5, while ROESY correlations between H-5 and H-3 confirmed the E-geometry of the double bond. The H-2 pentet (δH 2.82, dq, J = 6.8, 6.5) of the fatty acid moiety was characteristic for an anti-configuration of the 2-Me and 3-OH substituents.12,13 The relative configuration at C-6 was not assigned.
Tumonoic acid F (3) (C21H37NO5, m/z 384.2736, [M+H]+) also possessed a complex fatty acid moiety, two secondary methyls (δH 1.14, d and 0.91, d) and an oxygenated methine proton (δH 5.21, d) shifted further downfield than that of 2. In combination with the presence of a deshielded methyl group (δH 1.99, s; δC 20.8) and an additional carbonyl resonance (δC 169.9), this suggested the presence of an O-acetyl group at C-3, which was confirmed by 2D NMR analysis (Figure 2). HMBC correlations also positioned the secondary methyls at C-2 and C-4, respectively. As for 2, the H-2 pentet of the fatty acid moiety suggested an anti-arrangement for the 2-Me and 3-OAc moieties. In an attempt to determine the absolute configuration at C-3, a small sample of 3 was subjected to base hydrolysis and derivatization with Mosher's acid chloride (both R and S). However, this proved unsuccessful. Prior research has suggested that reduction of the C-1 amide to an alcohol is necessary before successful esterification can occur.12 Given the small amount of material available, further attempts were not made.
The molecular formula of tumonoic acid G (4) was determined to be C25H43NO7 (m/z 470.3106, [M+H]+) by HRESIMS. While 1H and 13C NMR analyses revealed the presence of the same proline and 2-methyldecanoyl moieties as tumonoic acid D (1), the spectra were significantly more complex, with additional downfield methine and methyl resonances being the most distinctive new elements. COSY analysis established the presence of a spin system incorporating two methines (δH 5.05, d; δH 2.05, m), two methyls (δH 0.91, t; δH 0.96, d), and a diastereotopic methylene unit (δH 1.44, m; δH 1.28, m), consistent with the presence of an isoleucic acid residue. 13C NMR shifts (Table 2) and HMBC correlations (Figure 2) confirmed this assignment, and a strong correlation from H-2″ to C-1 of the proline residue was used to connect the isoleucic acid to the proline unit. The second new spin system consisted of another downfield methine connected to a deshielded methyl resonance. While no HMBC correlations were observed from these protons, the distinctive chemical shifts (δH 5.27, brq; δC 71.1 and δH 1.50, d; δC 16.7) were indicative of a lactic acid residue, which was later confirmed by HPLC analysis as described below. The terminal carboxylic acid group was not observed in the 13C NMR spectrum, likely due to broadening caused by partial deprotonation of this functionality.
Table 2.
NMR Data (CDCl3) for tumonoic acids G-I (4-6)a
| tumonoic acid G (4) | tumonoic acid H (5) | tumonoic acid I (6) | ||||
|---|---|---|---|---|---|---|
| δC | δH | δC | δH | δC | δH | |
| fatty acid | ||||||
| 1 | 176.1 | 175.9 | 175.9 | |||
| 2 | 37.8 | 2.56 dq (6.7, 6.7) | 37.7 | 2.55 tq (6.8, 6.7) | 35.2 | 2.67 dq (6.8, 6.8) |
| 3 | 33.8 | 1.64 m 1.37 m | 33.8 | 1.64 m, 1.36 m | 41.2 | 1.64 ddd (13.5, 6.8, 6.8) 1.19 m |
| 4 | 27.3 | 1.31 m | 27.4 | 1.30 m | 30.1 | 1.48 m |
| 5 | 29.1 | 1.27 m | 29.5 | 1.26 m | 36.1 | 1.32 m, 1.02 m |
| 6 | 29.3 | 1.27 m | 29.3 | 1.26 m | 29.0 | 1.31 m, 1.21 m |
| 7 | 29.7 | 1.27 m | 29.7 | 1.26 m | 22.9 | 1.28 m |
| 8 | 31.8 | 1.24 m | 31.8 | 1.26 m | 14.4 | 0.88 t (6.7) |
| 9 | 22.6 | 1.28 m | 22.6 | 1.28 m | ||
| 10 | 14.1 | 0.87 t (6.8) | 14.0 | 0.89 t (6.7) | ||
| 2-Me | 16.7 | 1.11 d (6.7) | 16.8 | 1.10 d (6.7) | 16.9 | 1.08 d (6.7) |
| 4-Me | 20.1 | 0.88 d (6.8) | ||||
| proline | ||||||
| 1′ | 172.3 | 172.2 | 172.1 | |||
| 2′ | 59.1 | 4.50 dd (7.7, 4.5) | 59.2 | 4.51 dd (8.1, 4.9) | 59.2 | 4.52 dd (7.3, 4.5) |
| 3′ | 29.5 | 2.23 m, 2.05 m | 29.2 | 2.24 m, 2.08 m | 29.2 | 2.21 m, 2.11 m |
| 4′ | 25.0 | 2.18 m, 2.02 m | 25.0 | 2.18 m, 2.01 m | 24.9 | 2.20 m, 2.02 m |
| 5′ | 47.1 | 3.69 ddd (9.8, 7.4, 6.0) 3.60 ddd (9.8, 6.5, 6.5) | 47.1 | 3.70 ddd (9.9, 7.1, 6.0) 3.59 ddd (9.9, 9.6, 6.7) | 47.0 | 3.68 ddd (9.4, 7.3, 6.8) 3.61 ddd (9.4, 7.1, 6.9) |
| hydroxy acid 1 | ||||||
| 1″ | 169 | 168.9 | 169.5 | |||
| 2″ | 75.5 | 5.05 d (3.3) | 77.2 | 5.06 d (4.1) | 75.0 | 5.20 d (3.3) |
| 3″ | 36.6 | 2.05 m | 29.8 | 2.33 m | 36.6 | 2.05 m |
| 4″ | 25.8 | 1.44 m, 1.28 m | 18.6 | 1.00 d (7.0) | 25.8 | 1.41 m, 1.25 m |
| 5″ | 11.5 | 0.91 t (7.4) | 11.6 | 0.92 t (7.3) | ||
| 3″-Me | 14.2 | 0.96 d (6.8) | 17.0 | 0.98 d (6.8) | 14.2 | 0.95 d (7.0) |
| hydroxy acid 2 | ||||||
| 1‴ | n/o b | n/o b | n/o b | |||
| 2‴ | 71.1 | 5.27 brq (5.1) | 79.0 | 5.04 d (5.4) | 77.2 | 5.09 d (4.6) |
| 3‴ | 16.7 | 1.50 d (5.1) | 30.2 | 2.27 m | 36.4 | 2.04 m |
| 4‴ | 18.5 | 1.00 d (7.0) | 24.5 | 1.55 m, 1.30 m | ||
| 5‴ | 11.4 | 0.92 t (7.3) | ||||
| 3‴-Me | 17.7 | 0.99 d (7.1) | 15.2 | 0.98 d (6.8) | ||
1H NMR spectra were recorded at 500 MHz, and 13C spectra at 75 MHz.
not observed.
The 1H and 13C NMR spectra of tumonoic acid H (5) (C26H45NO7, m/z 484.3254, [M+H]+) were very similar to those of 4, with the same proline and 2-methyldecanoyl units again present, however, the abundance of secondary methyls (δH 1.00, d; 1.00, d; 0.99, d; 0.98, d) indicated the presence of two 2-hydroxyisovaleric acid residues in place of the isoleucic and lactic acids of 4. 2D NMR analysis (Figure 2) was consistent with such a structure, and later chiral HPLC analysis confirmed the presence of the hydroxyisovaleric acid residues.
Likewise, tumonoic acid I (6) (C27H47NO7, m/z 498.3413, [M+H]+) was very similar to both 4 and 5. A second set of resonances characteristic of isoleucic acid (Table 2) indicated the replacement of the lactic acid residue of 4 with an additional isoleucic acid residue. Compound 6 showed a much smaller methylene envelope than that of the other tumonoic acids, indicating the presence of a shorter fatty acid chain. Additionally, a distinctive secondary methyl resonance (δH 0.88, d; δC 20.1) indicated the presence of a second methyl branch along the fatty acid chain; this could be positioned at C-4 using 2D NMR correlations to give the structure shown (Figure 2). Based on the wide separation of the 1H NMR resonances (δH 1.64, 1.19) of H-3 of the dimethyloctanoic acid moiety, and comparison with literature examples, we propose that the C-2 and C-4 methyl groups are in a syn-orientation.14
Stereochemical investigations
After solving the planar structures of 1-6, the next issues to be addressed were their absolute configurations. This was determined for the proline residues of 1-7 by acid hydrolysis followed by derivatization with Marfey's reagent (FDVA) and subsequent LCMS analysis. This analysis revealed that the proline unit in all seven compounds was l. The configurations of the α-hydroxy acids of 4-6 were determined by chiral HPLC. Analysis of the acid hydrolysates of 4-6 and comparison with known standards revealed the following compositions: 4: d-allo-isoleucic acid, l-lactic acid; 5: d-2-hydroxyisovaleric acid, l-2-hydroxyisovaleric acid; 6: d-allo-isoleucic acid, l-isoleucic acid. In order to determine the positions of the isomeric hydroxy acids in 5 and 6, the natural products were derivatized with α-methylbenzylamine and the products subjected to base hydrolysis, yielding only one free hydroxy acid. Analysis of these hydrolysates revealed only d-2-hydroxyisovaleric acid for 5 and d-allo-isoleucic acid for 6, enabling the configurations of the hydroxy acids to be assigned as shown.
The C-2 configuration of the fatty acid moiety of tumonoic acid D (1) was determined by synthesis. Racemic 2-methyldecanoic acid was first derivatized with l-proline methyl ester. The methyl ester present in each component of the mixture was hydrolyzed under basic conditions to yield two epimeric acids 1 and 8. These were separated using reversed-phase (RP) HPLC and characterized using standard spectroscopic techniques. 1H and 13C NMR, IR and [α]D data were very similar for both epimers, and it was not possible to conclusively distinguish the two solely on this basis. However, co-injections of the synthetic epimers with natural 1 and analysis by LCMS conclusively showed that the earlier eluting peak was the natural epimer. Finally, each of the two synthetic tumonoic acids was hydrolyzed under acidic conditions to give free 2-methyldecanoic acid, which was purified by HPLC and its [α]D value measured and compared with literature values.15 This sequence revealed that 1 contained (2S)-2-methyldecanoic acid whereas the unnatural epimer 8 incorporated (2R)-2-methyldecanoic acid. Although we did not conduct similar reaction sequences on the other new tumonoic acids, we propose on biogenetic grounds that 4 and 5 share the same absolute configuration at C-2. As the known tumonoic acid A (7) possesses the opposite 2R configuration, we have not assigned the absolute configurations of the fatty acid portions for 2, 3, or 6. Intriguingly, our isolate of tumonoic acid A (7) was of 2R configuration as in the original report {[α]D -79.4 (c 0.3, CHCl3); lit. [α]D -79 (c 1.1, CHCl3)12}, and this is opposite the configuration at C-2 in compound 1.
Tumonoic acids A-C were originally isolated in 1999 along with two methyl esters, and were not reported to possess any significant biological activities.12 The new tumonoic acids differ from these previously isolated examples in the greater diversity of fatty acids incorporated. All three tumonoic acids in the original isolation possess the same 2,4-dimethyl-3-hydroxydodec-4-enoic acid moiety, while those in the current study include a range of unusual fatty acids.
Biological activities
The tumonoic acids A (7) and D-I (1-6) were assayed for anticancer, antimalarial, anti-Chagas, antileishmania, and antimicrobial (MRSA) activity. Tumonoic acid I (6) displayed moderate activity in the antimalarial assay (IC50 = 2 μM) whereas none of the other naturally occurring analogs showed any activity in this assay at a concentration of 10 μg/mL. It was interesting to observe only 6 displaying such activity given the strong structural similarities between 6 and the other isolated acids, especially 4 and 5. It was also noted that several of these tumonoic acids bore a close resemblance to homoserine lactones involved in bacterial communication. Thus, investigations were carried out into the possible effects of these compounds on bacterial quorum sensing and biofilm formation. The tumonoic acids showed no activity in an assay utilizing a mutated E. coli strain that produces green fluorescence protein in response to 3-oxohexanoyl homoserine lactone addition.16 However, in an assay using a wild-type strain of Vibrio harveyi that regulates bioluminescence via quorum sensing, several of these tumonoic acids (2-5) displayed modest inhibition of bioluminescence without affecting bacterial growth, with tumonoic acid F (3) being the most active (IC50 of 62 μM).
Morphological and phylogenetic analysis
Given the difficulties in the taxonomic classification of cyanobacteria, and relative paucity of 16S rDNA sequences for Blennothrix species in the literature, a detailed morphological and phylogenetic analysis of Blennothrix strain PNG05-4 (PNG-5/21/05-4) was carried out. The strain was morphologically identified as B. (Hydrocoleum) cantharidosmum Komárek & Anagnostidis. The thallus formed a soft, gelatinous, thick, 2 cm high, brown/grey mat covering the reef substrate. The cyanobacterium was filamentous and filaments were either solitary or several enclosed together in common sheaths. Furthermore, the trichomes were cylindrical and slightly constricted at the crosswalls. Cells were disk-shaped, 21 μm wide and 3.1 μm long. The end cells were cylindrical, with thickened outer cell walls.
The almost complete 16S rDNA gene sequence (1414 nucleotides) was PCR-amplified and sequenced (GenBanck Acc. No. EU253968). BLAST-analysis of the 16S rDNA gene sequence showed highest sequence identity (99.1%) with the B. (Hydrocoleum) cantharidosmum strain GV58 from New Caledonia (GenBank Acc. No. DQ883636).5 Due to the lack of full 16S rDNA sequences for related species available in databases, including the Blennothrix sp. from New Caledonia, a 1082 nucleotide stretch of the 16S rDNA genes was used in the final multiple sequence alignment and phylogenetic tree construction. The three main kinds of reconstruction methods [(1) the distance method by neighbour-joining (NJ), (2) maximum parsimony (MP), and (3) likelihood method by maximum-likelihood (ML)] were compared for their predicted relationships. The overall topography of the different phylogenetic trees was consistent with the ML-method giving the most robust bootstrap values; hence, this tree is displayed in Figure 3. The clading was also stable using either the 1414- or the 599-nucleotide stretches (see Supporting Information); however, use of the 1414 base pair stretch excluded several species of interest in the study. In the final phylogenetic analysis, 43 16S rDNA cyanobacterial gene sequences were included, including four from Microcoleus species. Consistent with previous findings,5 species of Blennothrix and Microcoleus are genetically very different and form separate clades in the phylogenetic tree.
Figure 3.

Phylogenetic relationships of filamentous marine cyanobacteria from 16S rDNA nucleotide sequences, including new sequences from Blennothrix cantharidosmum and Schizothix sp., determined in this study (performed using partial 1,082 nucleotide sequence).
Schizothrix is a former genus that has also been assigned as a sub-genus of Microcoleus based on the presence of multiple trichomes within a sheath,7 and thus it bears a close resemblance to Blennothrix. However, the 16S rDNA gene data for Schizothrix species available in GenBank is even less extensive than that for Blennothrix, with only a 599 nucleotide stretch being currently available (Schizothrix calcicola UTEX, GenBank Acc. No. AY271841). Hence, in the interests of further clarifying the taxonomic relationships between these genera, a Schizothrix sp. PNG5-22 (PNG-5/20/05-2) from our own collection was morphologically- and phylogenetically-identified according to previously described taxonomic methods, and its 16S rDNA gene sequence was also included in this study. The thallus of this specimen was soft, mucilaginous, hemispherical, 4 cm tall, and dark yellowish-brown. The cyanobacterium was filamentous, with several cylindrical trichomes within the same sheaths. The cells were isodiametric, 1.2 μm wide by 3.2 μm long.
A 1370 nucleotide stretch of the Schizothrix PNG5-22 16S rDNA gene was PCR-amplified and sequenced (GenBank Acc. No. 1060443), and a 1082-nucleotide stretch included in the phylogenetic analysis described above. Interestingly, this Schizothrix sp. PNG5-22 appeared genetically very different from members of both Microcoleus and Blennothrix (Figure 3). Thus, it appears that the taxonomic groupings originally created using phycological criteria and nomenclature are supported by this genetic-based analysis, and raises concerns about the recent regrouping of genera under the bacteriological system.7
Conclusions
The tumonoic acids were originally isolated from a Lyngbya majuscula/Schizothrix calcicola assemblage, as well as a collection of L. majuscula, all collected in Guam.12 Given the uncertainties involved in cyanobacterial taxonomy, and the overall morphological resemblance between Blennothrix, Schizothrix and Lyngbya, it is possible that the original tumonoic acid isolation was in fact from a Lyngbya/Blennothrix assemblage.17 However, in the absence of 16S rDNA data from the previous work it is impossible to make a definitive assignment. The current study illustrates the inadequacy of morphological identification in cyanobacterial taxonomy, and demonstrates the complementary power of molecular-taxonomy in the classification of these organisms. Precise taxonomic investigations are important in guiding chemical investigations of some of the less well studied cyanobacteria, and these can lead to the isolation of new metabolites such as those described herein.
Experimental Section
General Experimental Procedures
Optical rotations were measured on a JASCO P1010 polarimeter. IR and UV spectra were recorded on a Nicolet IR-100 FT-IR and Beckman-Coulter DU800 spectrophotometer, respectively. NMR spectra were recorded on Varian Unity 300 and 500 MHz spectrometers with the solvent CDCl3 (δH at 7.26, δC at 77.0) used as an internal standard. High resolution mass spectra were acquired using an Agilent ESI-TOF mass spectrometer. LC-MS analyses were carried out on a Finnigan LCQ advantage mass-spectrometer, attached to a Finnigan Surveyor HPLC system. HPLC was performed using Waters 515 pumps and a Waters 996 photodiode array detector, under computer control using Empower software. Chemicals were acquired from VWR, except for 2-methyldecanoic acid, which was purchased from Narchem, and 1-ethyl-(3-dimethylaminopropyl)carbodiimide hydrochloride (EDAC.HCl), purchased from Chem-Impex International.
Collection
The Blennothrix and Schizothrix specimens were collected by SCUBA in Papua New Guinea in May 2005. The Blennothrix sp. PNG05-4 (PNG-5/21/05-4) was collected to the west of Duke of York Island, near Kibil, at a depth of 30 ft (GPS coordinates S 04° 07.270′, E 152° 26.666′). The Schizothrix sp. PNG5-22 (PNG-5/20/05-2) was collected on a reef to the west of the Credner islands, near Kerawara, at a depth of 40 ft (GPS coordinates S 04° 12.922′, E 152° 22.926′). The samples were stored in EtOH-seawater (1:1) at −20 °C until extraction, with a small (∼100 mg) tissue sample preserved in 5 mL RNA-later (Ambion®) for genetic analysis. Voucher specimens are available from WHG.
Morphological Characterization
Preliminary morphological and taxonomic characterizations of the Blennothrix and Schizothrix specimens were performed using a field microscope (RFM-2 Microscope from Richardson Technologies Inc.) and the taxonomic field guide by Littler & Littler,18 while more accurate measurements and characterizations were made with an Olympus BH-2 light microscope. The following morphological parameters were evaluated: thallus morphology, cell length, cell width (and cell length/width ratios), constriction of cell walls, presence of specialized cells such as heterocysts, akinetes or calyptra, size and shape of trichomes, and characteristics of end-cells. Morphological identification was made in accordance with the phycological systems by Gomont,19 Geitler,20 and Komárek & Anagnostidis.21
DNA Extraction, 16S rDNA Gene PCR-amplification and Cloning
Genomic DNA was extracted from 40 mg of cleaned cyanobacterial tissues using the Wizard® Genomic DNA Purification Kit (Cat. A1120) according to the manufacturer's specifications (Promega, Madison, WI). The isolated genomic DNA was further purified using Genomic-tips 20/G from Qiagen® (Cat. 10223). The 16S rDNA genes were PCR-amplified from isolated DNA using the cyanobacteria-specific primers, 106F and 1509R, as previously described.22 The reaction volumes were 25 μL containing 0.5 μL of DNA (50 ng), 2.5 μL of 10× PfuUltra II reaction buffer, 0.5 μL of dNTP mix (25 mM each of dATP, dTTP, dGTP, and dCTP), 0.5 μL of each primer (10 μM), 0.5 μL of PfuUltra II fusion HS DNA polymerase (Cat. 600760) and 20.5 μL dH2O. The PCR reaction was performed in an Eppendorf® Mastercycler® gradient as follows: initial denaturation for 2 min at 95°C, 30 cycles of amplification using: 20 sec at 95°C, 20 sec at 50°C (16S rDNA)/56°C (ITS) and 15 sec at 72°C, and final elongation for 3 min at 72°C. PCR products were subcloned using the Zero Blunt® TOPO® PCR Cloning Kit (Cat. K2800-20SC) from Invitrogen into pCR®-Blunt II TOPO® vector, transformed into TOPO® cells and cultured on LB-Kanamycin plates. Plasmid DNA was isolated using the QIAprep® Spin Miniprep Kit (Cat. 27106) from Qiagen and sequenced in both directions using pCR®-Blunt II TOPO® vector specific primers M13F and M13R and the internal middle primers 359F and 758R as previously described.22
Phylogenetic Analysis
The 16S rDNA gene sequences were visually inspected and a total DNA stretch of 1414/1082 nucleotides were aligned together with 43 cyanobacterial species representing 14 major genera of the order Oscillatoriales, obtained from GenBank (http://www.ncbi.nlm.nih.gov). The multiple sequence alignments were performed using ClustalX, with standard gap opening and extension penalties without gaps, and the aligned 16S rDNA gene sequences were used to generate phylogenetic trees in MEGA 4.0. The phylogenetic relation of the cyanobacterial 16S rDNA genes were compared; (1) the distance method by neighbour-joining (NJ), (2) maximum parsimony (MP), and (3) the likelihood method by maximum-likelihood (ML). The evolutionarily distant cyanobacterium Nostoc punctiforme PCC73102 (GenBank Acc. No. AF027655) from the order Nostocales was used as an outgroup.
Extraction and Isolation
Approximately 64.5 g (dry weight) of the alga was extracted repeatedly with CH2Cl2–MeOH (2:1) to yield 1.15 g of crude extract. The extract was fractionated by VLC using a stepwise gradient with solvents of increasing polarity, from 100% hexanes to 100% MeOH. The polar fractions eluting with 3:1 EtOAc-MeOH and 100% MeOH possessed activity against the H-460 cell line. These were further fractionated by RP solid phase extraction on Strata C18-E 500 mg cartridges using a stepwise gradient from 10% MeOH–H2O to 100% MeOH. Further purification was carried out via RP HPLC [Phenomenex Synergy-Hydro (4 μm particles, 21.2 × 250 mm), gradient elution from 45% CH3CN–H2O to 75% CH3CN–H2O over 30 min] yielding the tumonoic acids D (1, 19.6 min, 1.8 mg), E (2, 14.2 min, 1.7 mg), F (3, 24.5 min, 3.4 mg), G (4, 28.6 min, 8.0 mg), H (5, 31.1 min, 1.1 mg), I (6, 32.7 min, 5.5 mg), and A (7, 18.3 min, 7.6 mg), and a mixture containing lyngbyastatins 1 and 3 (33.8 mg, 15-17 min).
Tumonoic acid D (1): colorless oil; [α]D −24.3 (c 0.81, MeOH); IR (neat) νmax 2957, 2927, 2856, 1725, 1614, 1468, 1447, 1195 cm−1; 1H NMR (CDCl3, 500 MHz) and 13C NMR (CDCl3, 75 MHz) data, see Table 1; HRESI(+)MS m/z [M+H]+ 284.2211 (calcd for C16H30NO3, 284.2220).
Tumonoic acid E (2): colorless oil; [α]D −24.8 (c 0.94, MeOH); IR (neat) νmax 3381, 2960, 2927, 2874, 1718, 1619, 1448, 1201 cm−1; 1H NMR (CDCl3, 500 MHz) and 13C NMR (CDCl3, 75 MHz) data, see Table 1; HRESI(+)MS m/z [M+H]+ 326.2321 (calcd for C18H32NO4, 326.2326).
Tumonoic acid F (3): colorless oil; [α]D −173.3 (c 1.62, MeOH); IR (neat) νmax 2959, 2927, 2856, 1746, 1626, 1461, 1461, 1373, 1238, 1195 cm−1; 1H NMR (CDCl3, 500 MHz) and 13C NMR (CDCl3, 75 MHz) data, see Table 1; HRESI(+)MS m/z [M+H]+ 384.2736 (calcd for C21H38NO5, 384.2744).
Tumonoic acid G (4): colorless oil; [α]D −33.6 (c 0.69, MeOH); IR (neat) νmax 2961, 2927, 2858, 1744, 1640, 1617, 1459, 1263, 1193, 1098 cm−1; 1H NMR (CDCl3, 500 MHz) and 13C NMR (CDCl3, 75 MHz) data, see Table 2; HRESI(+)MS m/z [M+H]+ 470.3106 (calcd for C25H44NO7, 470.3112).
Tumonoic acid H (5): colorless oil; [α]D −42.6 (c 0.69, MeOH); IR (neat) νmax 2963, 2928, 2855, 1741, 1642, 1610, 1463, 1427, 1208, 1192, 1023 cm−1; 1H NMR (CDCl3, 500 MHz) and 13C NMR (CDCl3, 75 MHz) data, see Table 2; HRESI(+)MS m/z [M+H]+ 484.3254 (calcd for C26H46NO7, 484.3269).
Tumonoic acid I (6): colorless oil; [α]D −40.6 (c 3.0, MeOH); IR (neat) νmax 2964, 2929, 2878, 1742, 1647, 1625, 1460, 1198, 1132 cm−1; 1H NMR (CDCl3, 500 MHz) and 13C NMR (CDCl3, 75 MHz) data, see Table 2; HRESI(+)MS m/z [M+H]+ 498.3417 (calcd for C27H48NO7, 498.3413).
It should be noted that for many of the tumonoic acids, a second, minor set of NMR signals was observed (<10% height of major peaks in all cases). These were attributed to minor isomers caused by cis-trans proline isomerization.
Absolute Configuration of the Proline Residues of Tumonoic Acids D-I
The tumonoic acids (∼0.1 mg each) were hydrolyzed in 6 N HCl at 110 °C for 18 h, and then extracted twice with EtOAc. The aq layers were dried under a stream of N2 before derivatization with 1-fluoro-2,-4-dinitrophenyl-5-l-valeryl-amide (FDVA) in acetone (50 μL) and 0.1 M NaHCO3 (100 μL) in sealed vials at 90 °C for 5 min. The resulting solutions were analysed using RP HPLC using an HP LiChrospher 100 RP-18 (5 μm, 4 × 125 mm) column, eluting with 50% CH3CN–H2O at a flow rate of 0.8 mL/min. The l-proline derivative eluted at 7.7 min, with the d-proline derivative eluting at 8.9 min.
Chiral HPLC analysis
Isoleucic acids were synthesized according to literature methods.23 The organic layers from the acid hydrolysates of 4, 5, and 6 were evaporated to dryness and then redissolved in 2 mM CuSO4. Analysis was carried out using three separate conditions. Condition 1: 100% 2 mM CuSO4, 0.8 mL/min, Phenomenex Chirex 3126 (4.6 × 250 mm) column; elution times (tR, min) for standards: l-lactic acid (22.1), d-lactic acid (29.2) min. Condition 2: 12.5% CH3CN in 2 mM CuSO4, 0.8 mL/min, Phenomenex Chirex 3126 (4.6 × 250 mm) column; elution times (tR, min) for standards: l-2-hydroxyisovaleric acid (7.8), d-2-hydroxyisovaleric acid (12.1) min. Condition 3: 12.5% CH3CN in 2 mM CuSO4, 0.8 mL/min, Phenomenex Chirex 3126 (4.6 × 50 mm) column; elution times (tR, min) for standards: l-allo-isoleucic acid (18.3), l-isoleucic acid (21.4), d-allo-isoleucic acid (28.5), d-isoleucic acid (34.1).
The hydrolysates of 4, 5 and 6 were analysed by the methods above, revealing the presence of l-lactic acid and d-allo-isoleucic acid in 4; l-2-hydroxyisovaleric acid and d-2-hydroxyisovaleric acid in 5; and l-isoleucic acid and d-allo-isoleucic acid in 6.
To define the positions of the hydroxy acids in 5 and 6, both were separately derivatized using L-(–)-α-methylbenzylamine using the following method: 0.2 mg of the natural product was dissolved in 100 μL CH2Cl2, cooled to 0 °C, and solutions of L-(–)-α-methylbenzylamine (12 μL), triethylamine (12 μL), EDAC·HCl (18 μL), and DMAP (12 μL) (all solutions 5 mg/mL) were added sequentially. The mixture was allowed to stir overnight, with LC-MS analysis indicating complete conversion to the desired products. The crude products were evaporated to dryness, resuspended in CH2Cl2, and washed sequentially with 0.1 M HCl, H2O, 1 M NaHCO3, H2O, and brine. The organic layers were evaporated to dryness and the residues resuspended in MeOH–1 M NaOH (1:1) and left to stir overnight at room temperature. The MeOH was removed under N2, the aq residue acidified with 2 M HCl, and then extracted twice with EtOAc. The EtOAc was removed under N2, the samples suspended in 2 mM CuSO4, and analysed by the relevant chiral HPLC methods as described above, revealing the presence of free d-2-hydroxyisovaleric acid in 5 and d-allo-isoleucic acid in 6.
Synthesis of tumonoic acid D epimers
Commercially available racemic 2-methyldecanoic acid (50 mg) was dissolved in 2 mL CH2Cl2, cooled to 0 °C, and l-proline methyl ester (30 mg), triethylamine (30 mg), EDAC·HCl (51 mg), and DMAP (33 mg) were added sequentially. The mixture was allowed warm to room temperature over 30 min and then stirred for 18 h, with LC-MS analysis indicating complete conversion to the desired products. The crude products were evaporated to dryness, resuspended in EtOAc, the slurry filtered and then the organic solubles washed as above to yield the crude product (52 mg). The mixture was then hydrolysed in EtOH–1 M NaOH (1:1) overnight at room temperature. The aq layer was acidified with 1 M HCl, extracted twice with EtOAc, and the organic layer evaporated to dryness to yield the epimeric acids 1 and 8 (40 mg).
The two epimeric products were separated by RP HPLC using a Phenomenex Jupiter (10 μm, 21 × 250 mm) column, eluting with 45% CH3CN–H2O at a flow rate of 4 mL/min to give tumonoic acid D (1, 14.2 mg) and the unnatural epimer 8 (13.8 mg). Co-injections with natural 1 were used to confirm which was the natural isomer, using the following HPLC conditions: HP LiChrospher 100 RP-18 (5 μm, 4 × 125 mm) column, eluting with 40% CH3CN–H2O at a flow rate of 0.8 mL/min. Elution times (tR, min): 1 (27.5), 8 (31.7).
A small sub-sample of each of the synthetic tumonoic acids was hydrolysed at 110 °C in dioxane–6 M HCl (1:1) for 18 h. The hydrolysate was extracted with EtOAc, the organic layer reduced under vacuum, and the residue purified by HPLC using a Phenomenex Synergi-Hydro (4 μm, 21 × 250 mm) column, eluting with a gradient from 50% CH3CN–H2O to 100% CH3CN at a flow rate of 4 mL/min. The optical rotations of the purified methyldecanoic acids were measured and compared with literature values.15 Compound 1 yielded (2S)-2-methyldecanoic acid ([α]D +12.3 (CHCl3, c = 0.26); lit. +5.1°), while the unnatural epimer 8 gave (2R)-2-methyldecanoic acid ([α]D −9.8 (CHCl3, c = 0.32); lit. −5.1°).
epi-Tumonoic acid D (8): colorless oil; [α]D −120 (c 0.67, CDCl3); IR (neat) νmax 2958, 2930, 2857, 1736, 1642, 1601, 1468, 1450, 1333, 1191 cm−1; 1H NMR (CDCl3, 500 MHz) δH 9.26 (br s, COOH), 4.60 (d, J = 4.7 Hz, H-2′), 3.63 (br t, J = 8.6 Hz, H-5′a), 3.53 (ddd, J = 9.2, 8.7, 6.1 Hz, H-5′b), 2.57 (dq, J = 6.8, 6.6 Hz, H-2), 2.41 (m, H-3′a), 2.03 (m, H-3′b), 2.01 (m, H-4′), 1.67 (m, H-3a), 1.41 (m, H-3b), 1.28-1.25 (m, H-4 – H-9), 1.15 (d, J = 6.6 Hz, 2-Me), 0.87 (t, J = 6.8 Hz, H-10); 13C NMR (CDCl3, 75 MHz) δC 179.1 (C-1), 172.8 (C-1′), 59.9 (C-2′), 47.7 (C-5′), 38.1 (C-2), 33.5 (C-3), 31.8 (C-9), 29.6, 29.4, 29.2 (C5 – C-7), 27.5 (C-4), 27.4 (C-3′), 24.8 (C-4′), 22.6 (C-9), 17.2 (2-Me), 14.0 (C-10); ESI(+)MS m/z 284 [M+H]+.
Biological Activity
All metabolites were tested for activity in antimalarial,24 antileishmania,25 anti-Chagas,26 cytotoxicity (NCI-H460 lung tumor,27,28 L1210, Colon 38, H-116, H-125M, CEM, and CFU-GM cell lines29), antibacterial (MRSA),30 and quorum sensing assays. Procedures for all assays except quorum sensing are given in the appropriate references.
Quorum sensing assays were carried out using marine broth (MB) containing 1 g yeast extract and 5 g peptone per liter synthetic seawater (Instant Ocean). For agar plates, 15 g agar (USB) per L of H2O was used. 4-Bromo-5-(bromomethylene)-2-(5H)-furanone was synthesized as reported previously.31 The 3-oxohexanoylhomoserine lactone (OHHL) is commercially available (Sigma-Aldrich, Lot # 102K3851).
Vibrio harveyi BB120 produces bioluminescence in response to the autoinducers HAI-1, AI-2, and CAI-1. V. harveyi was cultured in MB at 28 °C while shaking. An overnight culture of V. harveyi BB120 in MB was diluted to an OD600 of 0.1. An aliquot (100 μL) of the diluted culture was added to 5 mL of MB. Test compounds dissolved in DMSO were added to the wells of an opaque microtiter plate (Nunc A/S, Denmark; 0.0076 to 250 μM final concentration; 0.5 % DMSO concentration; negative control = DMSO alone). The synthesized brominated furanone was utilized as a positive control for inhibition of luminescence (0.0076 to 250 μM). The diluted V. harveyi culture was added to the wells and mixed thoroughly. The plates were incubated for 4 h and read on a Packard Lumicount microtiter plate reader (Packard, UK). Relative luminescence units were normalized by the optical density (600 nm) values obtained by transferring 100 μL to a clear bottom microtiter plate.
Escherichia coli JB525 is E. coli MT102 harboring the gfp plasmid pJBA132. This mutant produces an unstable green fluorescent protein in response to a C6-C8 N-acylhomoserine lactone autoinducer. E. coli JB525 was cultured in LB4 broth at 30 °C. Inhibition of fluorescence was determined using a method modified from Anderson et al.16 An overnight culture of E. coli JB525 in LB4 broth was diluted to an OD450 of 0.25 with fresh media. Test compounds dissolved in DMSO, or DMSO alone, were added to the wells of an opaque microtiter plate (Nunc A/S, Denmark; 32 nM OHHL; 0.0076 to 250 μM test compounds; 1 % DMSO concentration). The diluted E. coli culture was added to the wells and mixed thoroughly. The plates were incubated with shaking at 30 °C for 90 min. Fluorescence was determined using a Packard Fluorocount microtiter plate reader (λ=480 nm excitation, λ=515 nm emission). Relative fluorescence values were normalized by optical density values obtained by transferring 100 μL to a clear bottom microtiter plate (λ=450 nm, SpectraMax Multimode Microplate Reader, Molecular Devices).
Supplementary Material
Acknowledgments
We gratefully acknowledge the government of Papua New Guinea for permissions to make these collections, and T. L. Simmons, R. Grindberg, and C. Sorrels for collection of the organisms. We also thank S. Kelly, J. Wingerd, D. Kyle, and L. D. Urena for conducting biological assays, and A. Pereira for recording the optical rotation of tumonoic acid A. Financial support for this work came from the National Cancer Institute (CA100851) and the International Cooperative Biodiversity Groups Program (grant number 1U01 TW 006634-01).
Footnotes
Supporting Information Available: Additional phylogenetic trees using the alternative methods described herein as well as those incorporating the full 1400 nucleotide sequences. NMR spectra showing all 1H NMR, gCOSY, gHSQC and gHMBC spectra for tumonoic acids D-I (1-6). This material is available free of charge via the internet at http://pubs.acs.org.
References and Notes
- 1.(a) Tan LT. Phytochemistry. 2007;68:954–979. doi: 10.1016/j.phytochem.2007.01.012. [DOI] [PubMed] [Google Scholar]; (b) Van Wagoner R, Drummond AK, Wright JLC. Adv Appl Microbiol. 2007;61:89–217. doi: 10.1016/S0065-2164(06)61004-6. [DOI] [PubMed] [Google Scholar]
- 2.Gerwick WH, Tan LT, Sitachitta N. In: The Alkaloids. Cordell GA, editor. Vol. 57. Academic Press; San Diego: 2001. pp. 75–184. [DOI] [PubMed] [Google Scholar]
- 3.Shimizu Y. Curr Opin Microbiol. 2003;6:236–243. doi: 10.1016/s1369-5274(03)00064-x. [DOI] [PubMed] [Google Scholar]
- 4.Haider S, Naithani V, Viswanathan PN, Kakkar P. Chemosphere. 2003;52:1–21. doi: 10.1016/s0045-6535(03)00032-8. [DOI] [PubMed] [Google Scholar]
- 5.Abed RM, Palinska KA, Camoin G, Gulobic S. FEMS Microbiol Lett. 2006;260:171–177. doi: 10.1111/j.1574-6968.2006.00321.x. [DOI] [PubMed] [Google Scholar]
- 6.Charphy L, Alliod R, Rodier M, Golubic S. Aquat Microb Ecol. 2007;47:73–81. [Google Scholar]
- 7.Castenholz RW. In: Bergey's Manual of Systematic Bacteriology. 2. Boone DR, Castenholz RW, editors. Vol. 18. Springer; New York: 2001. pp. 474–487. [Google Scholar]
- 8.Abed RMM, Golubic S, Garcia-Pichel F, Camoin GF, Sprachta S. J Phycol. 2003;30:862–873. [Google Scholar]
- 9.Pecci J, Fujimori E. Biochim Biophys Acta. 1969;154:332–341. doi: 10.1016/0005-2795(68)90047-0. [DOI] [PubMed] [Google Scholar]
- 10.Harrigan GG, Yoshida WY, Moore RE, Nagle DG, Park PU, Biggs J, Paul VJ, Mooberry SL, Corbett TH, Valeriote FV. J Nat Prod. 1998;61:1221–1225. doi: 10.1021/np9801211. [DOI] [PubMed] [Google Scholar]
- 11.Williams PG, Moore RE, Paul VJ. J Nat Prod. 2003;66:1356–1363. doi: 10.1021/np0302145. [DOI] [PubMed] [Google Scholar]
- 12.Harrigan GG, Luesch H, Yoshida WY, Moore RE, Nagle DG, Biggs J, Park PU, Paul VJ. J Nat Prod. 1999;62:464–467. doi: 10.1021/np980460u. [DOI] [PubMed] [Google Scholar]
- 13.Paik S, Carmeli S, Cullingham J, Moore RE, Patterson GML, Tius MA. J Am Chem Soc. 1994;116:8116–8125. [Google Scholar]
- 14.Decicco CP, Grover P. J Org Chem. 1996;61:3534–3541. [Google Scholar]
- 15.Wallace PA, Minnikin DE, McCrudden K, Pizzarello A. Chem Phys Lipids. 1994;71:145–162. doi: 10.1016/0009-3084(94)90067-1. [DOI] [PubMed] [Google Scholar]
- 16.Anderson JB, Heydorn A, Hentzer M, Eberl L, Geisenberger O, Christensen BB, Molin S, Givskov M. App Environ Microbiol. 2001;67:575–585. doi: 10.1128/AEM.67.2.575-585.2001. [DOI] [PMC free article] [PubMed] [Google Scholar]
- 17.While cellular dimensions of the Blennothrix cantharidosmum and Schizothrix sp. collections made in the current study were quite dissimilar, dimensions are known to vary greatly for Schizothrix.19-21
- 18.Littler DS, Littler MM. South Pacific Reef Plants. Offshore Graphics, Inc.; Washington, D.C.: 2000. [Google Scholar]
- 19.Gomont M. Ann Sci Nat Bot Paris. 1892;15:263–368. [Google Scholar]
- 20.Geitler L. Rabenhorst's Kryptogamen-Flora von Deutchland, Österreich und der Schweiz. Vol. 14 Koeltz Scientific Books; Koenigstein: 1932. [Google Scholar]
- 21.Komárek J, Anagnostidis K. In: Süβwasserflora von Mitteleuropa. Büdel B, Gärtner G, Krienitz L, Schagerl M, editors. 19/2 Gustav Fischer; Jena: 2005. [Google Scholar]
- 22.Nubel U, Garcia-Pichel F, Muyzer G. Appl Environ Microbiol. 1997;63:3327–3332. doi: 10.1128/aem.63.8.3327-3332.1997. [DOI] [PMC free article] [PubMed] [Google Scholar]
- 23.Mamer OA. Method Enzymol. 2000;324:3–10. doi: 10.1016/s0076-6879(00)24213-4. [DOI] [PubMed] [Google Scholar]
- 24.Corbett Y, Herrera L, Gonzalez J, Cubilla L, Capson TL, Coley PD, Kursar TA, Romero LI, Ortega-Barria E. Am J Trop Med Hyg. 2004;70:119–124. [PubMed] [Google Scholar]
- 25.Calderon A, Romero LI, Ortega-Barrya E, Brun R, Correa MA, Gupta MP. Panama Pharm Biol. 2006;44:1–16. [Google Scholar]
- 26.Buckner FS, Verlinde CLMJ, La Flamme AC, Van Voorhis WC. Antimicrob Agents Chemother. 1996;40:2592–2597. doi: 10.1128/aac.40.11.2592. [DOI] [PMC free article] [PubMed] [Google Scholar]
- 27.Alley MC, Scudiero DA, Monks A, Hursey ML, Czerwinski MJ, Fine DL, Abbott BJ, Mayo JG, Shoemaker RH, Boyd MR. Cancer Res. 1988;48:589–601. [PubMed] [Google Scholar]
- 28.Manger RL, Leja LS, Lee SY, Hungerford JM, Hokama Y, Dickey RW, Granade HR, Lewis R, Yasumoto T, Wekell MM. J AOAC Int. 1995;78:52–527. [PubMed] [Google Scholar]
- 29.Valeriote F, Grieshaber CK, Media J, Pietraszkiewicz H, Hoffmann J, Pan M, McLaughlin S. J Exp Therap Oncol. 2002;2:228–236. doi: 10.1046/j.1359-4117.2002.01038.x. [DOI] [PubMed] [Google Scholar]
- 30.Soria-Mercado IE, Prieto-Davo A, Jensen PR, Fenical W. J Nat Prod. 2005;68:904–910. doi: 10.1021/np058011z. [DOI] [PubMed] [Google Scholar]
- 31.Manny AJ, Kjelleber S, Kumar N, de Nys R, Read RW, Steinberg P. Tetrahedron. 1997;53:15813–15826. [Google Scholar]
Associated Data
This section collects any data citations, data availability statements, or supplementary materials included in this article.