

Abstract
The α-hemolysin (αHL) protein pore has many applications in biotechnology. This article describes a single-molecule manipulation system that utilizes the nanocavity enclosed by this pore to non-covalently encapsulate a guest molecule. The guest is the thrombin-binding aptamer (TBA) that folds into the G-quadruplex in the presence of cations. Trapping the G-quadruplex in the nanocavity resulted in characteristic changes to the pore conductance that revealed important molecular processes, including spontaneous unfolding of the quartet structure and translocation of unfolded DNA in the pore. Through detection with tag-TBA, we localized the G-quadruplex near the entry of the β-barrel inside the nanocavity, where the molecule vibrates and rotates to different orientations. This guest-nanocavity supramolecular system has potential for helping to understand single-molecule folding and unfolding kinetics.
Introduction
The α-hemolysin (αHL) nanopore is a receptive probe that can be used for various single-molecule detections,1;2 from biosensing,3-6 DNA sequencing,7-14 membrane transportation15-17 and understanding single molecule chemistry,18;19 to creating force microscopes,20-22 supramolecule construction23;24 and modular biochips.25;26 Structurally, αHL encloses a β-barrel27 that is critical for most successful detections. Through translocation or interaction with the lumen of the β-barrel, a single molecule can produce characteristic changes in pore conductance, which can lead to identification and quantification of the target.
αHL also encloses a 4-nm wide nanocavity in the cap, between the 2.6-nm cis opening and the 1.4-nm β-barrel entry in the middle of the pore27. Finding from previous studies led us to wonder if this nanocavity could be utilized for sensitive, non-covalent, label-free single-molecule manipulation. For example, it has been shown that single molecules can be captured in a nanocavity formed by two molecular adapters sequentially bound in the β-barrel;23 and that polyethylglycol can be covalently attached5 and a temperature-sensitive peptide can be inserted into the cavity28 for sensing applications.
Guanine-rich single-stranded nucleic acids can form intra- or inter-molecular four-stranded quadruplexes 29;30 in the presence of cations. These complexes are built with G-tetrads, a planar assembly of four guanine bases networked via hydrogen bonds. G-tetrads stack one on another, with a cation intervened between adjacent tetrads, in coordination with eight carbonyls of guanine bases for stabilization.31;32 G-quadruplexes in the human genome29;30 are important drug targets33-35 because they are associated with many gene control-related mechanisms,29;36-39 such as the function block of telomerase active in cancer cells.40 Synthetic quadruplexes31;32 are capable of recognizing proteins with high affinities.41-44 Therefore, they are powerful biosensors45 and potent pharmaceuticals.32 Recently, the designed quadruplexes with controllable folding/unfolding properties have found application in supramolecular materials46 and nanomachines.47
In this study, we utilized the nanocavity of the αHL pore to non-covalently encapsulate a single G-quadruplex oligonucleotide (Fig.1a). Our target was the thrombin-binding aptamer (TBA). This 15-base single-stranded DNA (GGTTGGTGTGGTTGG)31 adopts the simplest quadruplex structure, with two parallel intra-molecular G-tetrads coordinated by a metal ion.48 The top tetrad is assembled with guanine 1, 6, 10 and 15, and the bottom one with guanine 2, 5, 11 and 1449-51 (Fig.1b). Upon folding, the TBA quadruplex functions as an ultra-sensitive thrombin detector and an efficient inhibitor of thrombin clotting activity.45;52;53
Figure 1.
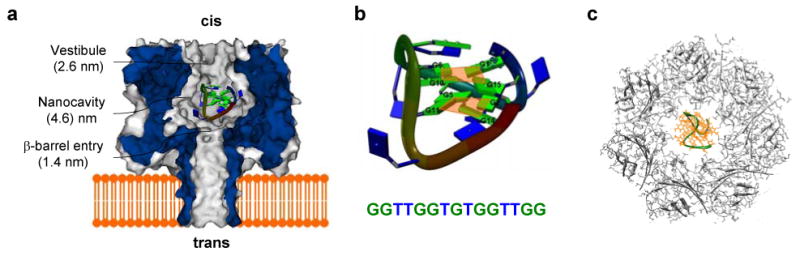
Molecular graphic representations of α-hemolysin (αHL) transmembrane protein pore, thrombin-binding aptamer (TBA) and their interaction. a. Sagittal plane through the αHL pore and a G-quartet TBA encapsulated in the nanocavity of αHL. b. The NMR structure of TBA (DOI 10.2210/pdb1c38/pdb, RCSB Protein Data Bank)50 in the presence of the potassium ion. The two G-tetrad planes (orange) formed by eight guanines (green) are illustrated. c. Top view of the cis vestibule of the αHL pore superimposed on an identically-scaled TBA molecule in the center, showing the pore entry that is wide enough to allow a G-quadruplex to enter.
Through recognition of characteristic blocks to the pore conductance, we discriminated that the trapped G-quartet TBA molecule can spontaneous unfold into a linear TBA that traverses through the β-barrel driven by the voltage. We further determined that the position of the trapped quadruplex is dynamic rather than static: it continues to vibrate and rotate to different orientations. The guest-nanocavity system we describe could be used for further exploring the folding and unfolding kinetics of quadruplexes, revealing distributions and variations of different molecular conformations as the environmental conditions change.
Experimental Methods
Oligonucleotides, including Ctrl-1, Ctrl-2 and TBA, were synthesized and page-purified by Integrated DNA Technologies, IA. DNA solutions were heated at 90 °C for 15 minutes, then cooled to room temperature. Human α-thrombin with a purity of 97.9% was purchased from Haematologic Technologies, Inc. The protein purity was determined by the provider, using SDS polyacrylamide gel electrophoresis.
The single-channel technique has been described elsewhere.54 Briefly, the planar lipid bilayer apparatus was composed of a 25-μm-thick Teflon film (Goodfellow, Malvern, MA) with a 100-μm diameter orifice serving as the partition between the two 2-ml Teflon chambers. The orifice was pretreated with 1:10 hexadecane (J. T. Baker)/pentane (Burdick and Jackson). A solvent-free planar lipid bilayer of 1,2-diphytanoyl-sn-glycerophosphatidylcholine (Avanti Polar Lipids) was formed over the orifice through the mono-layer folding method.55 The potential was applied across this bilayer by Ag/AgCl electrodes with 1.5% agarose (Ultra Pure DNA Grade, Bio-Rad) bridges containing 3M KCl.
The recording solutions in both cis and trans chambers contained 1 M NaCl or KCl, buffered with 10 mM Tris and titrated with HCl to pH 7.2. Protein was added to the cis chamber to form single channels. The voltage was applied from the trans chamber; the cis chamber was grounded. By this convention, a positive current was recorded from the trans to cis chamber at a positive potential. Single-channel currents were recorded with an Axopatch 200B patch-clamp amplifier (Molecular Device Inc.), filtered with a built-in 4-pole low-pass Bessel Filter at 5 kHz or 50 kHz, and acquired with Clampex 9.0 software (Molecular Device Inc.) through a Digidata 1332 A/D converter (Molecular Device Inc.) at a sampling rate of 20 ks-1 or 200 ks-1. The qualified bilayer was identified from the noise level, the value of IRMS displayed on the amplifier panel, which was typically 1.2-1.5 pA. The data were analyzed using Clampfit 9.0 (Molecular Device Inc.), Excel 2003 (MicroSoft) and SigmaPlot (SPSS) software.
The single-channel currents were determined from amplitude histograms by fitting the peaks to Gaussian functions. Current values were transformed into the conductance. The duration of the short-lived blocks for DNA translocation was characterized by two parameters: tP, the peak time in the dwell-time histogram, and , the exponential constant for events longer than tP. The occurrence of the blocks, f S, was calculated using f S =1/ , where is the interval between two adjacent events, obtained by fitting the dwell-time histogram to the exponential distribution. It was difficult to obtain the duration of the long-lived blocks produced by the G-quadruplex ( ) from the exponential fitting, due to the small number of events (50-150) collected from each recording (with a different pore). Thus, we used the arithmetic mean as the value of . Theoretically, the arithmetic mean is equal to the exponential constant (Supplementary Materials). was determined at voltages between +90-+180 mV. was not measurable at +80 mV and lower voltages, due to the small number of events. (A technique for efficient collection of DNA translocation events at low voltage has been reported.10) Data were given as mean ±SD based on at least three separate experiments. The electrophysiology experiments were conducted at 22 ± 2 °C.
The molecular graphic of αHL shown in Fig.1a was adapted from a graphic in a previous publication.16 The graphics of TBA in Fig.1b, as well as the superimposed TBA•αHL complex in Fig.1c, were generated from PDB files27;50 using UCSF Chimera software.
Results and Discussion
Encapsulation of a G-quadruplex in the nanocavity. In order to analyze the current signal for the G-quadruplex, we first examined the translocation properties of two linear strands of DNA with the same length as TBA, Ctrl-1 (CCAAACCAACCACCA) and Ctrl-2 (GATTAGTGTGATTAG).56 Ctrl-1's sequence is different from TBA, in that it consists only of adenine and cytosine; Ctrl-2's sequence is similar to that of TBA, but its capability to form a G-quadruplex is disabled due to the substitution of key guanines at positions 2, 5, 11, and 14 with adenines.56 Single channel recordings revealed that the translocation of Ctrl-1 and Ctrl-2 reduced the pore conductance (gS) by 85%, from ∼800 pS to 45-120 pS, and yielded shorter-lived blocks, at the level of 101-102 μs, with similar occurrences (f S), between 15 and 24 s-1 (Fig. 2 and Table 1).
Figure 2.
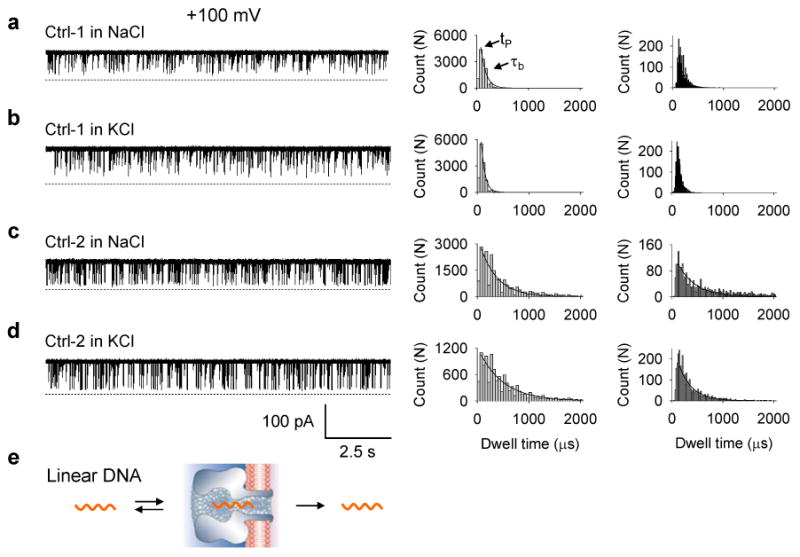
Single channel current traces and histograms showing blocks to the αHL pore with the control oligonucleotides in different metal ions. Both concentrations of Ctrl-1 and Ctrl-2 were 2.5 μM. All traces were recorded at +100 mV in either a 1 M NaCl or a 1 M KCl solution buffered with 10 mM Tris HCl (pH 7.2). The left panels were current traces recorded at a 5 kHz filtering bandwidth and a 20 ks-1 sampling rate; middle panels were histograms constructed from traces in left; and right panels were histograms constructed from recordings at a 50 kHz filtering bandwidth and a 200 ks-1 sampling rate. Calculated tP and values are given in Table 1. a. Ctrl-1 in NaCl. b. Ctrl-1 in KCl. c. Ctrl-2 in NaCl. d. Ctrl-2 in KCl. e. A model showing a linear DNA transporting in a αHL pore.
Table 1.
Conductance, duration and occurrences of blocks to the αHL pore by various oligonucleotides
| Short-lived blocks | Long-lived blocks | ||||||
|---|---|---|---|---|---|---|---|
| gS (pS) |
tP (μs) |
(μs) |
f S (s-1) |
gL (pS) |
(s) |
f L (min-1) |
|
| Ctrl-1, NaCl (50 kHz→) |
110±35 | 75±25 (125±5) |
110±10 (113) |
16±1 | |||
| Ctrl-1, KCl (50 kHz→) |
100±24 | 75±25 (95±5) |
72±8 (70) |
15±1 | |||
| Ctrl-2, NaCl (50 kHz→) |
45±17 | 75±25 (130±10) |
360±40 (470) |
24±1 | |||
| Ctrl-2, KCl (50 kHz→) |
120±21 | 75±25 (123±10) |
490±60 (260) |
21±1 | |||
| TBA, NaCl | 47±19 | 75±25 | 510±100 | 7.9±0.5 | 390±16 | 0.35±0.14 | 6.6±0.9 |
| TBA, KCl | 24±13 | 75±25 | 300±60 | 2.0±0.3 | 480±18 | 15±2 | 3.3±0.2 |
Values in brackets were measured from recordings at 50 kHz filtering bandwidth and 200 ks-1 sampling rate. All other values were from recordings at 5 kHz filtering bandwidth and 20 ks-1 sampling rate. Errors of tP were represented by the half value of bin width in the histogram.
To compare the DNA translocations with those found in earlier studies,57-59 we measured the peak time (tP) and the exponentially decaying constant ( ) from the duration histogram. tP marks the most probable peak time and reflects the temporal dispersion of the translocation. Data recorded at a 5 kHz filtering bandwidth and 20 ks-1 sampling rate revealed that tP values for the Ctrl-1 and Ctrl-2 blocks were 50-100 μs (Fig.2a-d middle panels, Table 1). This range is comparable to that predicted (30-70 μs) for the translocation of a 15-base DNA (+100 mV, 22 °C) in earlier studies.58;59 In contrast to tP, for the two types of DNA were distinct. for the Ctrl-1 block was 72-110 μs, but for the Ctrl-2 block was more than three times as long, 360-490 μs. The data suggest the wider temporal dispersion of the Ctrl-2 block. This property was further verified by data recorded at a 50 kHz bandwidth and 200 ks-1 sampling rate (Fig.2a-d right panels, Table 1).
As described below, the translocation of the linear form of TBA also yielded blocks that have comparable values (300-510 μs) to the Ctrl-2 block (Table 1). This common translocation property may be attributed to their similar sequences. Previous studies58 have suggested the longer time required for translocation is because DNA strands such as poly (dA) require energy to break up their stacked structures before entering the narrow nanopore. Although we have not yet determined the conformations of the linear TBA and Ctrl-2, we hypothesize that these guanine- and thymine-rich DNA strands adopt sequence-dependent secondary structures that are different from Ctrl-1, which does not contain any guanine or thymine. Breaking up their secondary structures during translocation gives rise to the longer time for translocation.
TBA differs from linear oligonucleotides by forming both long-lived and short-lived blocks in 1 M NaCl (Fig.3a) and 1 M KCl (Fig.3b). The TBA short-lived blocks were similar in conductance and duration to Ctrl-1 and Ctrl-2, but had much lower occurrences (f S) depending on the ion species. f S was reduced by 67% in NaCl, from 24±1 s-1 for Ctrl-2 blocks to 7.9±0.5 s-1 for TBA blocks, and 91% in KCl, from 21±1 s-1 (Ctrl-2) to 2.0±0.3 s-1 (TBA). Long-lived events in the same recordings only partially blocked the pore conductance (gL), by 50-51%, to 390±16 pS in 1 M NaCl and 480±18 pS in 1 M KCl. Most notably, long-lived blocks ( ) were 103 to 105 times as long as the short-lived blocks. was 0.35±0.14 s in NaCl and 15±2 s in KCl. These results suggest that there are two forms of TBA in the solution, with an ion species-dependent equilibrium. We attribute the long-lived event to binding with the G-quartet TBA (TBAG, Fig.3c) and the short-lived event to the translocation of linear TBA (TBAL) in the pore.
Figure 3.

Current traces from a single αHL pore showing blocks with TBA in different metal ion and ligand conditions. The DNA concentration and the solution condition were the same as in Fig.2. a. TBA in NaCl. b. TBA in KCl. Left inset was the expansion of a Level-2 block at the long event terminal, and the right inset shows a long-lived event without terminal block. c. A model showing the encapsulation of a G-quartet TBA in the nanocavity of αHL followed by the spontaneous unfolding process. d. TBA in a KCl solution in the presence of 2.5 μM human α-thrombin.
The binding of the G-quadruplex to the pore can be experimentally verified using thrombin. Human α-thrombin can chelate G-quartet TBA molecules (TBAG) with high affinity.31 The formation of the thrombin•TBAG complex in solution should lead to two outcomes: a decrease in the number of long-lived events and a decrease in the occurrence of short-lived events. The dimensions of the thrombin•TBAG complex (5.6×7.7×10 nm) were calculated from the published crystal structure.49 Because this dimension is much wider than the cis opening of the pore, the complex is unable to enter the pore. Consequently the number of long-lived events would decrease. Second, the formation of the thrombin•TBAG complex breaks the equilibrium between TBAL and TBAG, promoting the formation of G-quadruplex from TBAL and decreasing the occurrence of the TBAL short-lived events. Indeed, after adding 2.5 μM thrombin to the cis chamber, where TBA was already present in 1 M KCl, no long-lived event was observed (in 15 minutes); the frequency of short-lived events decreased from 2.0±0.3 s-1 without thrombin to 1.3±0.1 s-1 with thrombin (Fig. 3d). This finding supports the contention that the long-lived blockages are produced by the G-quadruplex and the independent short-lived events are produced by the linear TBA molecule.
To determine the G-quadruplex binding location in the pore, we first evaluated its dimension based on the published structure.50 The dimension of G-quadruplex can be represented by the diagonal distance between O3 atoms of guanine 6 and 15. This distance is 2.1 nm, consistent with the geometry of another G-quadruplex, the 16-base HIV-1 integrase aptamer, which folds into a 1.5 nm×1.5 nm cube.32 This complex is slightly narrower than the cis opening of the pore (2.6 nm, Fig.1c). If the G-quadruplex were anchored to this position, it would almost completely block the ion pathway. The large conductance of the long-lived block observed, however, suggests the G-quadruplex did not bind to the cis opening, but entered the cavity from the cis mouth. Because the G-quadruplex is wider than the entry of the β-barrel in the middle of the pore (1.4 nm), it can not traverse this narrow conduit, but resides in the space between the cis opening and the β-barrel (Fig.1a).
Comparison of the volume of the G-quadruplex (15 nm3) and the capacity of the nanocavity (35 nm3) suggests a large space remaining after arresting a G-quadruplex. This remaining space forms an ion pathway that results in the large conductance of the long-lived block (Table 1). This interpretation is consistent with previously-reported large conductance for the αHL pore attached with a long peptide (tens of amino acids) in the cavity.60 The hairpin DNA has also been reported to produce similar long-lived events with partially reduced conductance.8 However, the hairpin is different from the G-quadruplex in structure. The hairpin DNA is considered to be anchored at the cis opening because its loop is larger than the pore opening.
Finally, the long-lived block for G-quadruplex was found to be flat, without additional conductance change, suggesting that a single G-quadruplex is trapped in the cavity. This interpretation is reasonable, because the large difference in target concentrations between the inside cavity (∼50 mM, one molecule per 35 nm3) and the outside solution (2.5 μM) generates a high chemical potential that prevents trapping additional molecules after capture of the first molecule.
Spontaneous unfolding of the G-quadruplex in the nanocavity. Single channel recordings revealed that, in the presence of Na+ or K+, most long-lived events were terminated with a short Level-2 block (Fig. 3a and b). The expansion of a Level-2 block is shown in Fig. 3b, left inset. The conductance of the Level-2 block was 42-95 pS and the duration was 330-480 μs. Both the conductance and duration resemble that of the independent short-lived event in the same recording (Table 1), suggesting that the Level-2 block at the end of the long-lived event is caused by translocation of the linear TBA molecule. Therefore, we inferred that the encapsulated G-quadruplex transforms into a linear DNA that immediately traverses the β-barrel (Fig.3c). Since the linear DNA translocation can be accelerated by increased voltage,59 we further detected a voltage-dependence of duration of the Level-2 block (Fig.4a). Indeed, the block duration was shortened by a factor of greater than 3, from 410 μs to 130 μs, when voltage increased from +90 mV to +180 mV, consistent with the previously-reported 3- to 4-fold increase in the translocation velocity in the same voltage range.59 The voltage-dependence of the duration of the block verifies the translocation of linear TBA molecules. The observation of long-lived events terminated with a Level-2 block is also consistent with observations from several earlier reports in which the terminal spike was found to be due to unzipping a double-strand DNA into a single strand, followed by translocating it through the β-barrel.8-10;61 It should be mentioned that we also identified long-lived blocks without the terminal spike (Fig.3b, right inset), which we attributed to the G-quadruplex leaving the cavity backward, entering the cis solution before unfolding. However, the number of such blocks was low, accounting for only 15% of the total long-lived events (+100 mV). Our findings suggest that the majority of G-quadruplexes ultimately unfold in the cavity.
Figure 4.

Influence of voltage on the Level-2 block and the long block duration. a. Nonlinear decrease of the Level-2 block duration with the voltage. b. voltage-independence of the long-lived block duration.
The influence of voltage on the duration of the long-lived block ( ) allowed us to discriminate spontaneous and voltage-driven unfolding in the cavity. Our hypothesis was that is independent of the voltage for a spontaneous unfolding reaction; while is shortened by the voltage in an electrically forced unfolding process. Fig. 4b shows that varies slightly between15 and 23s at various voltages from +90 to +180 mV. This result differs from the voltage-driven DNA unzipping in the αHL pore.10;61 For example, the duration for DNA unzipping and translocation was shortened 60-fold with an increase in the voltage from +120 to +180 mV,61 and 250-fold with an increase in voltage from +30 to +150 mV.10 This comparison suggests that is independent of the electrical charge. The unfolding of the quadruplex is not driven by the electrical field. Rather, it is a spontaneous process. In previous DNA unzipping experiments, the DNA possessed a single-strand that protruded into the β-barrel10;61 or had one strand covalently attached to the cis entry,9 allowing the electrical field to drag one strand (or part of it) apart from its complementary partner. By contrast, the G-quadruplex was neither terminated with a single-stranded tail nor covalently attached to the pore lumen. Thus, the unfolding of the quadruplex was not necessarily forced by the voltage. Also, as the drop in voltage falls mostly on the transmembrane β-barrel, the remaining small drop in voltage across the nanocavity would have a weaker impact on the G-quadruplex.
Position, orientation and vibration of G-quadruplex in the nanocavity. We employed a TBA variant, the Tag-TBA, which has a GACTAC tag at the 5′ terminal. Tag-TBA has been confirmed to be able to form a G-quadruplex.62 Structurally, the folded tag-TBA serves as a ball (quadruplex)-stick (tag) chimera (Fig.5). When encapsulated in the nanocavity, the single-strand tag can interact with the β-barrel, resulting in further pore blocks. The current profiles allowed probing the position and molecular movement of the G-quadruplex in the cavity. Single channel recording revealed that the Tag-TBA not only produces long-lived blocks of the same conductance as TBA, but also a series of additional Level-2 blocks within the long-lived block (Fig.5a top). Because the Level-2 event has a conductance similar to the short-lived event in the same trace, we attributed these new events to the interaction of the linear tag with the β-barrel and localized the tag-TBA around the bottom of the nanocavity (Fig.5a bottom). At this position, the tag-TBA vibrates, repeatedly touching the entry of the β-barrel, producing reversible Level-2 blocks. Earlier research found similar secondary blocks (full blocks) produced by a double-stranded DNA with an unpaired single-strand inserted into the β-barrel.63 The Level-2 event occasionally disappeared (Fig. 5b top). This current profile marks a movement in which the tag-TBA suddenly rotates to another orientation within the nanocavity, leaving the β-barrel untouched by the tag (Fig.5b bottom). Finally, the long-lived event terminated with a Level-2 block (Fig. 5c top), which can be attributed to the translocation of the unfolded tag-TBA through the β-barrel (Fig.5 bottom).
Figure 5.
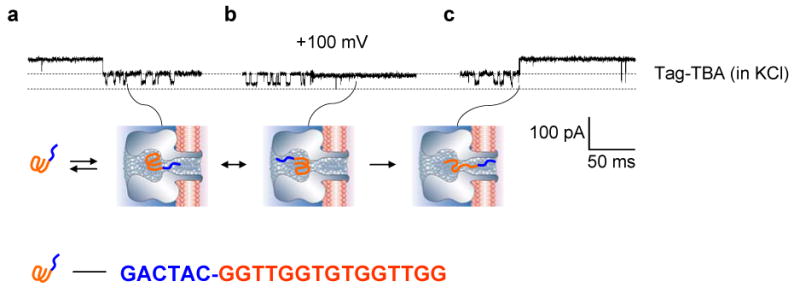
Current traces from single αHL pores showing blocks with Tag-TBA. The DNA concentration and the solution condition were the same as in Fig.2. a. Characteristic blocks produced by tag-TBA (top) and the model showing the molecular location and position in the cavity (bottom). b. Another type of block by tag-TBA (top) and the corresponding model showing the change in position of the molecule (bottom). c. Unfolding of tag-TBA in nanocavity (top) and the model of this process (bottom).
Perspective in exploring single-molecule folding/unfolding kinetics. The G-quadruplex (guest) and the nanocavity (host) form a supramolecule system that is potentially useful for detecting molecular properties and functionalities. We are pursuing an analytical approach to investigating quadruplex kinetics. The observation of long-lived events in NaCl and KCl solutions has proven the TBA's folding capability in Na+ and K+ (Fig.3a-b). This raises the question of which G-quadruplex is more stable. The duration of the long-lived event ( ) represents the lifetime of the G-quadruplex during encapsulation. Therefore, this parameter reasonably reflects its stability. The value in 1 M KCl is nearly fifty times as long as that in 1 M NaCl (Table 1), suggesting that the K+-induced G-quadruplex is much more stable than the one induced by Na+. However, we must be careful about the fact that the long-lived block is the result of a G-quadruplex that has already been formed in the solution before being arrested in the pore. Thus could be shorter than the lifetime in the aqueous phase (τunfold). Currently, we are working to determine the mathematical relationship between and τunfold. Determining this relationship would allow us to calculate the unfolding rate, kunfold. The equilibrium constant can be inferred from the occurrences of short-lived blocks (f S). Given the same DNA concentration (2.5 μM), f S for TBA in the KCl solution was four times lower than in the NaCl solution (Table 1), suggesting a lower percent of linear TBA molecules or a higher percent of folded ones in K+ than in Na+. The shift in equilibrium toward the folded structure suggests that K+ is more capable of the induction of the G-quadruplex formation than Na+. This interpretation is supported by results obtained using ensemble approaches.48;53 By comparing the short-lived block occurrences for TBA and the control DNA, we can further determine the concentrations of both the folded and linear TBA in the solution. These concentration data will be useful for obtaining the equilibrium-folding constant, K fold. Finally, the folding rate constant, k fold, can be determined using K fold =k fold / kunfold.
Establishing this analytical approach will allow us to measure the quadruplex kinetics in a variety of ions and other inducers such as ethanol.64 The results can be compared with those drawn from other single molecule detections.65;66 Contributions from individual guanines to folding stability and the multi-step folding process in more complicated G-quadruplexes32 may also be detected. In addition, aptamer-target interactions, such as the binding of thrombin with TBA, can be dissected with a nanopore force microscope.22 All these detections can be conducted on a portable and durable ion channel chip.25
Conclusions
We have used the thrombin-binding aptamer as a model to demonstrate that the G-quadruplex can be encapsulated in the nanocavity of αHL to form a guest-nanocavity supramolecule for non-covalent single-molecule manipulation. The trapped quadruplex is distinguished from the linear DNA by its characteristic electrical “signature” blocks to the pore conductance. The captured quadruplex sits at the bottom of the nanocavity, vibrating and frequently rotating to different orientations. The encapsulation ends when the quadruplex spontaneously unfolds into a linear DNA and leaves the pore, driven by an electrical force. The proposed system can prove useful for understanding the folding/unfolding kinetics of quadruplexes.
Supplementary Material
Acknowledgments
We thank Qiulin Tan for protein preparation and Shengyou Huang, of Xiaoqin Zou's laboratory, for support in the creation of molecular graphics. The study was funded by the National Science Foundation.
Reference List
- 1.Bayley H, Cremer PS. Nature. 2001;413:226–230. doi: 10.1038/35093038. [DOI] [PubMed] [Google Scholar]
- 2.Bayley H, Jayasinghe L. Molecular Membrane Biology. 2004;21:209–220. doi: 10.1080/09687680410001716853. [DOI] [PubMed] [Google Scholar]
- 3.Braha O, Gu LQ, Zhou L, Lu XF, Cheley S, Bayley H. Nature Biotechnology. 2000;18:1005–1007. doi: 10.1038/79275. [DOI] [PubMed] [Google Scholar]
- 4.Gu LQ, Braha O, Conlan S, Cheley S, Bayley H. Nature. 1999;398:686–690. doi: 10.1038/19491. [DOI] [PubMed] [Google Scholar]
- 5.Movileanu L, Howorka S, Braha O, Bayley H. Nature Biotechnology. 2000;18:1091–1095. doi: 10.1038/80295. [DOI] [PubMed] [Google Scholar]
- 6.Cheley S, Gu LQ, Bayley H. Chemistry & Biology. 2002;9:829–838. doi: 10.1016/s1074-5521(02)00172-2. [DOI] [PubMed] [Google Scholar]
- 7.Kasianowicz JJ, Brandin E, Branton D, Deamer DW. Proceedings of the National Academy of Sciences of the United States of America. 1996;93:13770–13773. doi: 10.1073/pnas.93.24.13770. [DOI] [PMC free article] [PubMed] [Google Scholar]
- 8.Vercoutere W, Winters-Hilt S, Olsen H, Deamer D, Haussler D, Akeson M. Nature Biotechnology. 2001;19:248–252. doi: 10.1038/85696. [DOI] [PubMed] [Google Scholar]
- 9.Howorka S, Cheley S, Bayley H. Nature Biotechnology. 2001;19:636–639. doi: 10.1038/90236. [DOI] [PubMed] [Google Scholar]
- 10.Mathe J, Visram H, Viasnoff V, Rabin Y, Meller A. Biophysical Journal. 2004;87:3205–3212. doi: 10.1529/biophysj.104.047274. [DOI] [PMC free article] [PubMed] [Google Scholar]
- 11.Nakane J, Wiggin M, Marziali A. Biophysical Journal. 2004;87:615–621. doi: 10.1529/biophysj.104.040212. [DOI] [PMC free article] [PubMed] [Google Scholar]
- 12.Ashkenasy N, Sanchez-Quesada J, Bayley H, Ghadiri MR. Angewandte Chemie-International Edition. 2005;44:1401–1404. doi: 10.1002/anie.200462114. [DOI] [PMC free article] [PubMed] [Google Scholar]
- 13.Astier Y, Braha O, Bayley H. Journal of the American Chemical Society. 2006;128:1705–1710. doi: 10.1021/ja057123+. [DOI] [PubMed] [Google Scholar]
- 14.Bayley H. Current Opinion in Chemical Biology. 2006;10:628–637. doi: 10.1016/j.cbpa.2006.10.040. [DOI] [PubMed] [Google Scholar]
- 15.Bezrukov SM, Vodyanoy I, Parsegian VA. Nature. 1994;370:279–281. doi: 10.1038/370279a0. [DOI] [PubMed] [Google Scholar]
- 16.Gu LQ, Dalla Serra M, Vincent JB, Vigh G, Cheley S, Braha O, Bayley H. Proceedings of the National Academy of Sciences of the United States of America. 2000;97:3959–3964. doi: 10.1073/pnas.97.8.3959. [DOI] [PMC free article] [PubMed] [Google Scholar]
- 17.Gu LQ, Cheley S, Bayley H. Proceedings of the National Academy of Sciences of the United States of America. 2003;100:15498–15503. doi: 10.1073/pnas.2531778100. [DOI] [PMC free article] [PubMed] [Google Scholar]
- 18.Luchian T, Shin SH, Bayley H. Angewandte Chemie-International Edition. 2003;42:3766–3771. doi: 10.1002/anie.200351313. [DOI] [PubMed] [Google Scholar]
- 19.Loudwig S, Bayley H. Journal of the American Chemical Society. 2006;128:12404–12405. doi: 10.1021/ja0642818. [DOI] [PubMed] [Google Scholar]
- 20.Wanunu M, Meller A. Biophysical Journal. 2007:653A. [Google Scholar]
- 21.Tropini C, Marziali A. Biophysical Journal. 2007;92:1632–1637. doi: 10.1529/biophysj.106.094060. [DOI] [PMC free article] [PubMed] [Google Scholar]
- 22.Hornblower B, Coombs A, Whitaker RD, Kolomeisky A, Picone SJ, Meller A, Akeson M. Nature Methods. 2007;4:315–317. doi: 10.1038/nmeth1021. [DOI] [PubMed] [Google Scholar]
- 23.Gu LQ, Cheley S, Bayley H. Science. 2001;291:636–640. doi: 10.1126/science.291.5504.636. [DOI] [PubMed] [Google Scholar]
- 24.Sanchez-Quesada J, Saghatelian A, Cheley S, Bayley H, Ghadiri MR. Angewandte Chemie-International Edition. 2004;43:3063–3067. doi: 10.1002/anie.200453907. [DOI] [PMC free article] [PubMed] [Google Scholar]
- 25.Shim JW, Gu LQ. Analytical Chemistry. 2007;79:2207–2213. doi: 10.1021/ac0614285. [DOI] [PMC free article] [PubMed] [Google Scholar]
- 26.Kang XF, Cheley S, Rice-Ficht AC, Bayley H. Journal of the American Chemical Society. 2007;129:4701–4705. doi: 10.1021/ja068654g. [DOI] [PubMed] [Google Scholar]
- 27.Song LZ, Hobaugh MR, Shustak C, Cheley S, Bayley H, Gouaux JE. Science. 1996;274:1859–1866. doi: 10.1126/science.274.5294.1859. [DOI] [PubMed] [Google Scholar]
- 28.Jung Y, Bayley H, Movileanu L. Journal of the American Chemical Society. 2006;128:15332–15340. doi: 10.1021/ja065827t. [DOI] [PubMed] [Google Scholar]
- 29.Sen D, Gilbert W. Nature. 1988;334:364–366. doi: 10.1038/334364a0. [DOI] [PubMed] [Google Scholar]
- 30.Sen D, Gilbert W. Nature. 1990;344:410–414. doi: 10.1038/344410a0. [DOI] [PubMed] [Google Scholar]
- 31.Bock LC, Griffin LC, Latham JA, Vermaas EH, Toole JJ. Nature. 1992;355:564–566. doi: 10.1038/355564a0. [DOI] [PubMed] [Google Scholar]
- 32.Jing NJ, Rando RF, Pommier Y, Hogan ME. Biochemistry. 1997;36:12498–12505. doi: 10.1021/bi962798y. [DOI] [PubMed] [Google Scholar]
- 33.Hurley LH. Nature Reviews Cancer. 2002;2:188–200. doi: 10.1038/nrc749. [DOI] [PubMed] [Google Scholar]
- 34.Neidle S, Parkinson G. Nature Reviews Drug Discovery. 2002;1:383–393. doi: 10.1038/nrd793. [DOI] [PubMed] [Google Scholar]
- 35.Kerwin SM. Current Pharmaceutical Design. 2000;6:441–471. doi: 10.2174/1381612003400849. [DOI] [PubMed] [Google Scholar]
- 36.Arthanari H, Bolton PH. Chemistry & Biology. 2001;8:221–230. doi: 10.1016/s1074-5521(01)00007-2. [DOI] [PubMed] [Google Scholar]
- 37.Fletcher TM, Sun DK, Salazar M, Hurley LH. Biochemistry. 1998;37:5536–5541. doi: 10.1021/bi972681p. [DOI] [PubMed] [Google Scholar]
- 38.Simonsson T. Biological Chemistry. 2001;382:621–628. doi: 10.1515/BC.2001.073. [DOI] [PubMed] [Google Scholar]
- 39.Zahler AM, Williamson JR, Cech TR, Prescott DM. Nature. 1991;350:718–720. doi: 10.1038/350718a0. [DOI] [PubMed] [Google Scholar]
- 40.Parkinson GN, Lee MPH, Neidle S. Nature. 2002;417:876–880. doi: 10.1038/nature755. [DOI] [PubMed] [Google Scholar]
- 41.Ellington AD, Szostak JW. Nature. 1990;346:818–822. doi: 10.1038/346818a0. [DOI] [PubMed] [Google Scholar]
- 42.Tuerk C, Gold L. Science. 1990;249:505–510. doi: 10.1126/science.2200121. [DOI] [PubMed] [Google Scholar]
- 43.Hermann T, Patel DJ. Science. 2000;287:820–825. doi: 10.1126/science.287.5454.820. [DOI] [PubMed] [Google Scholar]
- 44.Breaker RR. Nature. 2004;432:838–845. doi: 10.1038/nature03195. [DOI] [PubMed] [Google Scholar]
- 45.Heyduk T, Heyduk E. Nat Biotechnol. 2002;20:171–176. doi: 10.1038/nbt0202-171. [DOI] [PubMed] [Google Scholar]
- 46.Davis JT, Spada GP. Chemical Society Reviews. 2007;36:296–313. doi: 10.1039/b600282j. [DOI] [PubMed] [Google Scholar]
- 47.Alberti P, Mergny JL. Proceedings of the National Academy of Sciences of the United States of America. 2003;100:1569–1573. doi: 10.1073/pnas.0335459100. [DOI] [PMC free article] [PubMed] [Google Scholar]
- 48.Kankia BI, Marky LA. Journal of the American Chemical Society. 2001;123:10799–10804. doi: 10.1021/ja010008o. [DOI] [PubMed] [Google Scholar]
- 49.Padmanabhan K, Padmanabhan KP, Ferrara JD, Sadler JE, Tulinsky A. Journal of Biological Chemistry. 1993;268:17651–17654. doi: 10.2210/pdb1hut/pdb. [DOI] [PubMed] [Google Scholar]
- 50.Marathias VM, Bolton PH. Nucleic Acids Research. 2000;28:1969–1977. doi: 10.1093/nar/28.9.1969. [DOI] [PMC free article] [PubMed] [Google Scholar]
- 51.Wang KY, Swaminathan S, Bolton PH. Biochemistry. 1994;33:7517–7527. doi: 10.1021/bi00190a004. [DOI] [PubMed] [Google Scholar]
- 52.Ho HA, Leclerc M. Journal of the American Chemical Society. 2004;126:1384–1387. doi: 10.1021/ja037289f. [DOI] [PubMed] [Google Scholar]
- 53.Huang CC, Cao ZH, Chang HT, Tan WH. Analytical Chemistry. 2004;76:6973–6981. doi: 10.1021/ac049158i. [DOI] [PubMed] [Google Scholar]
- 54.Shim JW, Yang M, Gu LQ. FEBS Lett. 2007;581:1027–1034. doi: 10.1016/j.febslet.2007.02.005. [DOI] [PubMed] [Google Scholar]
- 55.Montal M, Mueller P. Proc Natl Acad Sci U S A. 1972;69:3561–6. doi: 10.1073/pnas.69.12.3561. [DOI] [PMC free article] [PubMed] [Google Scholar]
- 56.Vairamani M, Gross ML. Journal of the American Chemical Society. 2003;125:42–43. doi: 10.1021/ja0284299. [DOI] [PubMed] [Google Scholar]
- 57.Lubensky DK, Nelson DR. Biophysical Journal. 1999;77:1824–1838. doi: 10.1016/S0006-3495(99)77027-X. [DOI] [PMC free article] [PubMed] [Google Scholar]
- 58.Meller A, Nivon L, Brandin E, Golovchenko J, Branton D. Proceedings of the National Academy of Sciences of the United States of America. 2000;97:1079–1084. doi: 10.1073/pnas.97.3.1079. [DOI] [PMC free article] [PubMed] [Google Scholar]
- 59.Meller A, Nivon L, Branton D. Physical Review Letters. 2001;86:3435–3438. doi: 10.1103/PhysRevLett.86.3435. [DOI] [PubMed] [Google Scholar]
- 60.Jung Y, Cheley S, Braha O, Bayley H. Biochemistry. 2005;44:8919–8929. doi: 10.1021/bi0473713. [DOI] [PubMed] [Google Scholar]
- 61.Sauer-Budge AF, Nyamwanda JA, Lubensky DK, Branton D. Physical Review Letters. 2003;90 doi: 10.1103/PhysRevLett.90.238101. [DOI] [PubMed] [Google Scholar]
- 62.Fialova M, Kypr J, Vorlickova M. Biochemical and Biophysical Research Communications. 2006;344:50–54. doi: 10.1016/j.bbrc.2006.03.144. [DOI] [PubMed] [Google Scholar]
- 63.Howorka S, Bayley H. Biophysical Journal. 2002;83:3202–3210. doi: 10.1016/S0006-3495(02)75322-8. [DOI] [PMC free article] [PubMed] [Google Scholar]
- 64.Vorlickova M, Bednarova K, Kypr J. Biopolymers. 2006;82:253–260. doi: 10.1002/bip.20488. [DOI] [PubMed] [Google Scholar]
- 65.Ying LM, Green JJ, Li HT, Klenerman D, Balasubramanian S. Proceedings of the National Academy of Sciences of the United States of America. 2003;100:14629–14634. doi: 10.1073/pnas.2433350100. [DOI] [PMC free article] [PubMed] [Google Scholar]
- 66.Zhao Y, Kan ZY, Zeng ZX, Hao YH, Chen H, Tan Z. Journal of the American Chemical Society. 2004;126:13255–13264. doi: 10.1021/ja048398c. [DOI] [PubMed] [Google Scholar]
Associated Data
This section collects any data citations, data availability statements, or supplementary materials included in this article.