Abstract
Neuronal differentiation is a tightly regulated process characterized by temporal and spatial alterations in gene expression. A number of studies indicate a significant role for histone acetylation in the regulation of genes involved in development. Histone acetylation is regulated by histone deacetylases and histone acetyltransferases. Recent findings suggest that these catalytic activities, in turn, are modulated by yet another set of regulators. Of considerable interest in this context is the possible role of the INHAT (inhibitor of histone acetyltransferase) complex, comprised of a group of acidic proteins that suppress histone acetylation by a novel “histone-masking” mechanism. In this study, we specifically examined the role of the leucine-rich acidic nuclear protein (LANP), a defining member of the INHAT complex whose expression is tightly regulated in neuronal development. We report that depleting LANP in neuronal cell lines promotes neurite outgrowth by inducing changes in gene expression. In addition, we show that LANP directly regulates expression of the neurofilament light chain, an important neuron-specific cytoskeletal gene, by binding to the promoter of this gene and modulating histone acetylation levels. Finally, we corroborated our findings in vivo by demonstrating increased neurite outgrowth in primary neurons obtained from LANP null mice, which is also accompanied by increased histone acetylation at the NF-L promoter. Taken together, these results implicate INHATs as a distinct class of developmental regulators involved in the epigenetic modulation of neuronal differentiation.
Development of the nervous system is a well coordinated process that relies on the ability of neurons to differentiate, migrate, extend neurites, and form synapses. Each of these events is regulated by a series of intracellular events that are choreographed by alterations in gene expression. It is becoming increasingly clear that gene expression is regulated not only by the transcriptional machinery per se, but also by chromatin modifications, in particular alterations in DNA methylation and post-translational modifications of histone tails (1, 2).
One of the best characterized modifications of histone tails is the dynamic acetylation of the N-terminal domains of histones on a few specific lysine residues (2). Histone acetylation has been traditionally thought to be regulated by a fine balance of two classes of enzymes: histone acetyltransferases (HATs)2 that incorporate acetyl groups into specific lysine residues of histone tails; and histone deacetylases (HDACs) that reverse these marks (2). Histone acetylation correlates remarkably well with increases in gene expression, both by altering the conformation of chromatin, and also by creating a primed platform for the docking of factors that enable gene expression.
There is considerable evidence, both pharmacologic and genetic, for the role of HATs and HDACs in normal differentiation. For instance, drugs that inhibit HDACs affect the ability of cell lines to differentiate in culture (3, 4), whereas genetically modulating the levels of HATs and HDACs in engineered mice causes significant developmental defects (5). Indeed, defects in histone acetylase enzymes such as CREB-binding protein (CBP) cause developmental syndromes typified by the Rubinstein-Taybi syndrome, where lack of even a single copy of CBP causes mental retardation and developmental delay (6). Indeed, much like human patients, mice are finely attuned to the levels of p300/CBP dosage, with haploinsufficiency and nullizygosity showing worsening degrees of pathology (7, 8).
Despite our knowledge of the importance of HATs and HDACs, remarkably little is known about proteins that regulate their activity. In this report, we have focused our studies on elucidating the role of HAT regulators by studying LANP (leucine-rich acidic nuclear protein; also known as ANP32-A, PHAPI, and pp32). LANP is a nucleocytoplasmic shuttling protein with a diverse array of functions, including an ability to modulate the cytoskeletal compartment by binding to microtubule-associated proteins (9, 10). However, in the nucleus, one of the best characterized functions of this acidic protein is its ability to inhibit HATs, such as CBP, p300, and PCAF and conceivably others by binding to the basic histones and preventing HAT access to chromatin (11, 12).
Although LANP is ubiquitously expressed, its levels of expression are under tight spatial and temporal control. For instance, in the developing brain, LANP is abundantly expressed during the early weeks of postnatal life, decreasing to adult levels as neurons extend neurites and form synapses with one another (13). This temporal expression pattern suggested to us that it might play a role in sculpting brain cytoarchitecture, by regulating gene expression. This would serve as a mechanism to fine-tune neurite outgrowth in the developing brain. To test this notion, we probed the effects of depleting LANP on gene expression, histone acetylation, and neurite outgrowth.
Using the PC12 cell line, a well established model of neuronal development, we show that depleting LANP has a remarkable ability to induce neurite outgrowth. These changes are closely aligned with robust changes in the expression of genes involved in neuronal differentiation. In addition, we examined the role of LANP in regulating the Neurofilament light chain gene (Nf-L), one of the genes that shows an early up-regulation when LANP is depleted. We show that LANP directly associates with the promoter of the Nf-L gene and regulates the acetylation of histones in the vicinity of the NF-L promoter. These results provide strong evidence that the Nf-L gene is a direct target of the INHAT activity of LANP. Finally, we have confirmed our findings in vivo by demonstrating that primary neurons derived from LANP null mice have accelerated neurite outgrowth compared with neurons derived from their wild-type littermates. Importantly, this neurite outgrowth is accompanied by increased histone acetylation at the promoter of Nf-L gene with increased NF-L expression. These novel findings demonstrate a pivotal role for HAT regulators in neuronal differentiation, and will have significant impact in understanding the epigenetic regulation of this class of proteins in neuronal development.
EXPERIMENTAL PROCEDURES
Cell Culture and Cell Lines—The rat pheochromocytoma PC12 cells were grown in Dulbecco's modified Eagle's medium containing 8% horse serum and 8% fetal bovine serum (FBS). These cells were induced to differentiate by the addition of nerve growth factor (NGF; Roche) and by reducing the serum in the media (5% FBS; no horse serum). The mouse neuroblastoma N2A cells were grown in Dulbecco's modified Eagle's medium containing 10% FBS and induced to differentiate by 0.3 mm Bt2cAMP (adenosine monophosphate) (Sigma) in the presence of 1% FBS containing Dulbecco's modified Eagle's medium.
Transfections—For immunofluorescence, PC12 or N2A cells were seeded onto coverslips in 35-mm dishes and transfected at a density of 175,000 or 125,000 cells/dish, respectively, using Lipofectamine 2000 (according to the manufacturer's instructions; Invitrogen). For optimal knockdown, transfections were performed on two consecutive days. Two days after transfection, the cells were fixed and stained with primary antibodies (anti-LANP; 3118 (10) and anti-tubulin (T-8660; Sigma)) and fluorescently labeled secondary antibodies (Jackson Immunochemicals) (10). Microscopy was performed using a Zeiss Axiovert microscope. Images were processed with Adobe Photoshop 7.0 software. Statistical analysis was performed using the unpaired t test.
For biochemical experiments, PC12 cells were seeded in the same manner, with the only difference being that they were not plated onto coverslips. For Western blots protein samples were run on a 10% polyacrylamide gel and Western blot analysis was performed using antibodies against LANP and actin (A-5441; Sigma).
RNA Interference (RNAi) Duplexes—Knockdown of LANP was induced by transfecting small interfering RNA (siRNA) at a concentration of 100 nm. For these experiments cells were transfected with siRNA 1, 5′-AAGCUGGUCCUGGAUAACUGU-3′; siRNA 3, 5′-AGAGAAAUGUCCGAACCUUA-3′;or a pool of four duplexes targeting LANP (siGENOME SMART-pool; Dharmacon). They were transfected at a concentration of 100 nm (each component duplex at 25 nm concentration to reduce the off-target effects). The sequence of four duplexes were as follows: 1) 5′-GAACUGGAAUUCCUAAGUAUU-3′; 2) 5′-GGACAAACGGAUUUAUUUAUU-3′;3)5′-GGAUAACUGUCGGUCAAUUUU-3′;4)5′-GCCUAGACCUGUUUAACUGUU-3′. For control commercial siRNA (Dharmacon) 5′-UAGCGACUAAACACAUCAA-3′ was used (this control siRNA has been engineered to have at least 4 mismatches to any human, mouse, or rat gene).
Chromatin Immunoprecipitations (ChIP)—Chromatin precipitations from cultured cells were performed using established techniques (14, 15). Briefly, 2 × 10⁶ PC12 cells/10-cm dish were plated. 24 h after plating (or in the transfection experiments, 48 h post-transfection), cells were cross-linked in 1% formaldehyde for 10 min at room temperature with gentle shaking. The reaction was stopped by adding glycine to reach a 125 mm final concentration. Cells were scraped, washed in ice-cold phosphate-buffered saline, and lysed in 400 μl of lysis buffer (50 mm Hepes-KOH, pH 7.9, 10 mm EDTA, pH 8.0, 1% SDS with protease inhibitors). For chromatin precipitations from mouse brain we instituted the following modifications (16): mouse brains were flash frozen on dry ice, cut into small cubes, and cross-linked by adding 1 ml of 1% formaldehyde per 100 mg of tissue. Tissue was washed twice with cold phosphate-buffered saline and lysed with 1 ml of lysis buffer. Lysates, both cell and tissue, were sonicated until cross-linked DNA was sheared to an average size of 0.5 kb (∼25 pulses with 10 s/pulse at 40% amplitude). Samples were centrifuged at 4 °C for 10 min at 16,000 × g, and supernatants with cross-linked DNA were diluted 1:10 in immunoprecipitation buffer (10 mm Hepes-KOH, pH 7.9, 1% Triton X-100, 150 mm NaCl, and protease inhibitors). Chromatin samples were precleared with 200 μl of a 50% slurry of Protein A-agarose/salmon sperm DNA (Upstate) for 1 h at 4 °C.
The pre-cleared lysates were then divided into three aliquots and precipitated with the indicated antibodies (5 μg of anti-LANP antibody (sc-5652, Santa Cruz), 5 μg of anti-acetyl-histone H3 (06599; Upstate), or 5 μg of anti-H3 (05928; Upstate); with 5 μg of normal IgG (Santa Cruz) used as controls). Immune complexes were further incubated with Protein G-Sepharose beads (GE Healthcare) for 2 h at 4 °C. An aliquot of 40 μl of cell lysate was taken from diluted precleared samples prior to immunoprecipitations, and processed and treated as the immunoprecipitated sample. This served as the input control for the PCR component of the chromatin precipitations.
Immunoprecipitates were washed three times sequentially with 1 ml of each: (i) immunoprecipitation buffer, (ii) wash buffer (10 mm Tris-HCl, pH 8.0, 0.25 mm LiCl, 0.5% Nonidet P-40, 0.5% sodium deoxycholate, 1 mm EDTA, pH 8.0), and (iii) TE buffer (10 mm Tris, 1 mm EDTA, pH 8.0). Pellets were resuspended in 500 μl of TE buffer and digested with 50 μg/ml RNase A at 37 °C (30 min). SDS was added to a final concentration of 0.125%, and associated proteins were digested away with 250 μg/ml proteinase K (incubating for 1 h at 37 °C). Formaldehyde cross-links were reversed by adding NaCl to a final concentration of 200 mm and by incubating at 65 °C for 4 h. DNA was extracted once with an equal volume of phenol-chloroform and once with chloroform alone. 10 μg of glycogen was added to the extracted DNA. The extracted DNA was then precipitated with ethanol, and resuspended in 30 μl of TE. 2 μl of resuspended DNA was used as a template for the PCR component of the chromatin precipitation. PCR was performed with primers to amplify the promoter region of the Neurofilament light chain gene and other control promoters using the PCR mixture (Fermentas). The following primers were used: rat NFL-F, 5′-GGTATTGACAGGCAGGATGG-3′; rat NFL-R, 5′-AAGAGGGAAAGGGAAGGATG-3′; rat GAPDH-F, 5′-CCTTAAACAGGCCCACTTGA-3′; rat GAPDH-R, 5′-CCTTCCACAATGCCAAAGTT-3′; rat actin-F, 5′-CGCCGTTCCGAAAGTTGCC-3′; rat actin-R, 5′-AAGGTTGTACTCGCGGGTGG-3′; rat β-globin-F, 5′-ACATTGCCCAATCTGCTCAC-3′; rat β-globin-R, 5′-AACACAACAGTATCAGAAGCAAAT-3′; mouse NFL-F, 5′-CAGGGAAGTTATGGGGGTCT-3′; mouse NFL-R, 5′-AGAAGAACGGGGGAGAAGAG-3′; mouse GAPDH-F, 5′-GCTCACTGGCATGGCCTTCCG-3′; mouse GAPDH-R, 5′-GTAGGCCATGAGGTCCACCAC-3′; mouse β-globin-F, 5′-TTACTTGAGAGATCCTGACTCAACAATAA-3′; and mouse β-globin-R, 5′-TCAATAACTGCCTTCAGAGAATCG-3′.2 μl of immunoprecipitated DNA was used for real time PCR employing the SYBR Green quantitative PCR kit (Applied Biosystems) using primers for NF-L and GAPDH (serving as control).
The PCR component of the ChIP was quantified by qPCR. For the analyses, we normalized the qPCR results first to GAPDH (an internal control gene) and then to input. For experiments with transfected cells, the data were presented as -fold enrichment of the PCR product in the cells transfected with siRNA targeting LANP compared with cells treated with control siRNA. For the ChIP on brain we performed a similar quantitation except the -fold enrichment was compared with ChIP from wild-type brains.
Quantitative RT-PCR—RNA was isolated from the cells using the RNeasy kit (Qiagen) and from brain tissue (TRIzol) according to the manufacturer's instruction. 1 μg of DNase (Ambion)-treated RNA and oligo(dT) primers (Invitrogen) were denatured by incubating at 65 °C for 10 min. cDNA was synthesized using a reverse transcriptase (RT) kit according to the manufacturer's instructions (Roche). RT catalytic activity was inactivated by incubating the cDNA at 85 °C for 5 min. Real time PCR was performed using the SYBR Green quantitative PCR kit (Applied Biosystems).
Microarray Analysis—The cells were collected 48 h after LANP depletion by RNAi (previously described). RNA was isolated from the cells using RNeasy kit (Qiagen) and the quality of the RNA was assessed by a Agilent 2100 Bioanalyzer (28 S/18 S ratios of ∼2.0 suggesting high quality). We synthesized biotin-labeled cRNA that we subsequently hybridized to the Affymetrix GeneChip Rat Genome 230 2.0 containing 31,042 probe sets (each probe set contains 11 pairs of perfect match and mismatch oligos that differ by a single central nucleotide). Sequences used in the design of the array were selected from GenBank®, dbEST, and RefSeq. The sequence clusters were created from the UniGene data base (Build 99, June 2002) and then refined by analysis and comparison with the publicly available draft assembly of the rat genome from the Baylor College of Medicine Human Genome Sequencing Center (June 2002).
An estimate of signal for each transcript was calculated based on the difference of the perfect match and mismatch signals at each of the probe pairs using the Microarray Suite 5.0 algorithm (Affymetrix). Raw -fold change for each transcript was calculated by taking the simple ratio of the geometric means of the signal values for each respective group. Differential expression was determined using a robust implementation of permutation testing described here (expressionanalysis.com/pdf/PADE_technote.pdf). In brief, a modified t-statistic (Δi) was calculated for each transcript when comparing groups, and a difference (Δ) was computed between Δi and the average or expected t-statistic ordered values from a reference distribution (Δ(i)) calculated by computing all possible random permutations of our samples.
Preparation of Hippocampal Cultures—We prepared primary neuronal cultures from hippocampi of perinatal mice (embryonic day E16 to postnatal day P3) using established techniques with a few modifications (17, 18). Briefly, mouse hippocampi were dissected and freed of meninges. The cells were dissociated by trypsinization in 0.25% trypsin, then gently pipetted with a 5-ml pipette and filtered through a 40-μm cell strainer to yield a single cell suspension. These hippocampal neurons were then plated onto poly-l-lysine-coated coverslips in Neurobasal media (Invitrogen) supplemented with B27 (Invitrogen) and 5% FBS (the latter for the first hour only). To monitor neurite outgrowth, neurons were fixed at days 1, 4, and 8 post-plating in vitro with 4% formaldehyde and processed for immunofluorescence with an antibody against LANP and neuron-specific tubulin antibody βIII tubulin (TuJ) (Sigma). Images were analyzed using Metamorph Image analysis software (Universal Imaging Corporation, Fryer Company Inc., Huntley, IL). Neurite outgrowth was monitored by measuring the length of the longest process in neurons of each genotype. The data represent average of those lengths by counting at least 60 neurons. Statistical comparisons were performed using the unpaired t test.
Tails of the pups or embryos were used for genotyping by PCR using one forward primer (F) and two reverse primers (R2 and R3) that were used to amplify the mutant and wild-type alleles, respectively. The sequence of the primers were as follows: primer F, 5′-ACAGCAAAGCCTACTGGATA-3′; primer R2, 5′-GAAGAACCTCTGTGTGGGTA-3′; and primer R3, 5′-ATGTTGGATAAGCACACCTC-3′.
RESULTS
RNAi to Knock Down LANP Levels Results in Increased Neurite Outgrowth—To understand the role of LANP, we focused our efforts on the PC12 cell line, a rat chromaffin cell line that is especially well suited for the study of neuronal differentiation, based on its ability to take on many of the morphological and functional characteristics of neurons upon addition of NGF (19).
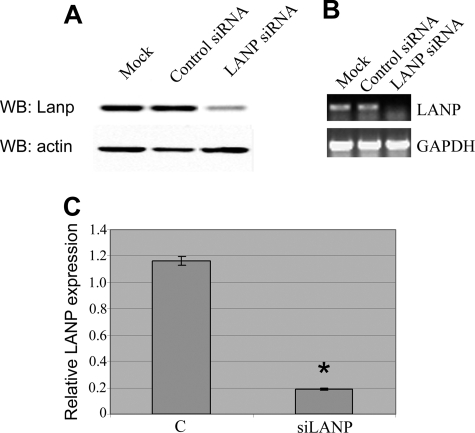
In this differentiation model, we took a loss of function approach using RNA interference to study the effects of depleting endogenous LANP. Using a commercially generated pool of four duplexes that target distinct domains of the LANP message, we could achieve at least a 75% level of knockdown of protein as estimated by Western blotting technique (Fig. 1A) and 80% knockdown of RNA as estimated by quantitative RT-PCR (p < 0.0001) (Fig. 1, B and C).
FIGURE 1.
Knockdown of LANP by RNA interference. A, PC12 cells transfected with a pool of siRNA targeting LANP show reduced expression at the protein level as demonstrated by Western blot (WB). As expected, no reduction of LANP is found with control siRNA or cells transfected in a mock manner (no siRNA). Western blot performed with an anti-actin antibody serves as a loading control. B, PC12 cells transfected with siRNA targeting LANP show reduced expression at the RNA level as demonstrated by RT-PCR. Once again, no reduction of LANP is found with control siRNA or cells transfected in a mock manner (no siRNA). In these experiments, the GAPDH message was measured as an internal control. C, quantitative RT-PCR comparing PC12 cells transfected with LANP siRNA and control (C) siRNA. Ct (threshold cycle) value of each sample is normalized to GAPDH and -fold change is relative to control transfected PC12 cells. *, p < 0.0001.
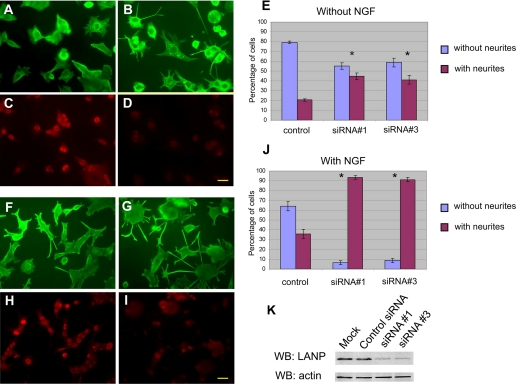
Even in the absence of NGF, PC12 cells with depleted LANP could be readily distinguished morphologically from those treated with control siRNA or cells that underwent a mock transfection. PC12 cells in the absence of NGF are typically rounded and do not extend neurites. However, when LANP is depleted, the cells were flatter and extruded short neurites (Fig. 2, A and B, tabulated in E). The data are shown for two different siRNAs targeting LANP compared with control siRNA (44.9 ± 3.3% in the case of siRNA 1 and 41.1 ± 4.5% in the case of siRNA 3; compared with 20.6 ± 1.1% of cells transfected with control siRNA; p < 0.005 in both instances). This differentiation phenotype was further exaggerated in the presence of NGF (93.3 ± 1.8% in the case of siRNA 1; and 91.2 ± 2.1% in the case of siRNA 3 of cells compared with only 64.1 ± 4.6% in cells transfected with control siRNA; p < 0.001 in both instances) (Fig. 2, F and G; tabulated in J). The typical level of knockdown with the two individual siRNA 1 and 3 are shown by semi-quantitative Western blots using an anti-LANP antibody (Fig. 2K).
FIGURE 2.
Knockdown of LANP promotes neurite outgrowth in PC12 cells. PC12 cells were transfected with either control siRNA (A, C, F, and H) or siRNA targeting LANP (panels B, D, G, and I) both in the absence (A–E) and presence (F–J) of NGF. The cells were fixed and stained with anti-tubulin to monitor the contours of the cells to evaluate neurite outgrowth (compare panels A and B, F and G). Anti-LANP immunofluorescence demonstrates significant LANP depletion (compare panels C and D, H and I). These results are quantified (histograms E and J) by counting the number of cells displaying neurites longer than one cell body length. siRNA 1 and siRNA 3 represent two different siRNA duplexes targeting LANP. Scale bar = 20 μm. Cells were counted in 3 sets of high power fields representing triplicate transfections (typically 6 fields or more were counted with total number of cells >75 per set). Error bars represent S.E. *, p < 0.001. K, PC12 cells transfected with individual siRNA 1 and 3 show reduced protein expression by Western blot (WB) analysis. No reduction of LANP is found with control siRNA or cells transfected in a mock manner (no siRNA). A Western blot performed with an anti-actin antibody serves as a loading control.
We also found similar results with the N2A mouse neuroblastoma cell line, another cell line that can be induced to differentiate, albeit with a different stimulus: the cyclic AMP analogue Bt2cAMP (supplemental Fig. S1). Using siRNA 1 that also targets mouse LANP, we can demonstrate that LANP-depleted N2A cells had significantly longer neurites than control transfected cells; p < 0.005 (supplemental Fig. S1, A–E). A Western blot shows the level of knockdown achieved in these cells (supplemental Fig. S1F). Together these results demonstrate that depleting LANP promotes neurite outgrowth in at least two well established neuronal differentiation paradigms.
Alterations in Gene Expression—In PC12 cells, NGF interacts with its cell-surface receptor (TrkA) to initiate changes in neuron-specific gene expression via the mitogen-activated protein kinase signaling module (20). One of the effects of this signaling cascade is the triggering of a HAT-mediated transcriptional module leading to a neuronal phenotype. Given that LANP is an effective inhibitor of HATs such as CBP, p300, and PCAF (11), we hypothesized that LANP serves to inhibit HAT-mediated neurite outgrowth in undifferentiated PC12 cells. Once LANP is depleted, inappropriate gene expression occurs thus enabling neurite outgrowth.
To test this hypothesis and determine which genes are misregulated when LANP levels are altered, we performed microarray experiments that query the gene expression profile of PC12 cells when LANP is depleted. Once again, we used RNAi to deplete LANP (as described in Fig. 1). RNA was isolated from LANP-depleted cells 48 h post-transfection. After the quality of the RNA was assessed by Agilent 2100 Bioanalyzer, we synthesized biotin-labeled cRNA targets that we subsequently hybridized to the Rat Genome 230.2 gene chips (Affymetrix) that contains 31,042 probe sets.
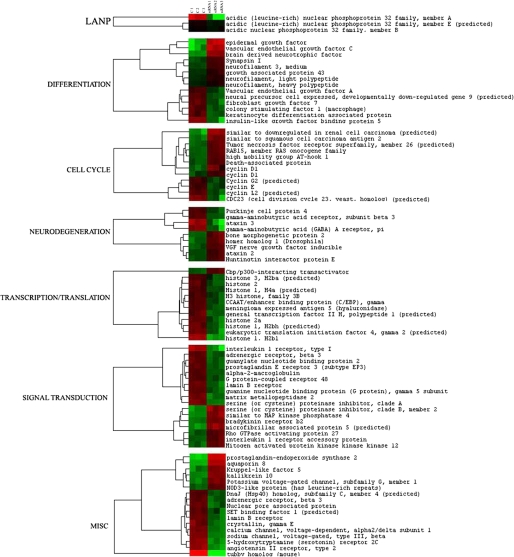
Before performing detailed statistical analysis on our microarray data, we first analyzed the level of expression of LANP on the microarray. This served as an important internal control demonstrating knockdown of LANP. We discovered that there is approximately a 6-fold decrease (85% knockdown) in the levels of LANP transcripts by microarray analysis (similar to the knockdown observed in Fig. 1). Importantly, the knockdown of LANP was not associated with significant depletion of two of its closely related family members (ANP 32 B and ANP 32 E), addressing the specificity of the RNAi-induced knockdown (see Fig. 3).
FIGURE 3.
Clustergram of the genes altered upon LANP knockdown. Each column depicts the signal from individual transfection with siRNA control (first three columns) or siRNA LANP (last three columns). Color in rows indicates relative expression level of the altered genes: red showing an increase and green depicting a decrease in LANP-depleted samples compared with control transfected samples. Genes are grouped according to their major biological functions.
We performed two-group comparison analysis to detect and estimate changes in expression between the two experimental groups, i.e. those treated with control siRNA and those treated with siRNA targeting LANP. The final data were analyzed using the Affymetrix Microarray Suite 5.0 software. We found that depleting LANP does not lead to global alterations in gene expression. Instead, only a relatively small subset, 3,187 genes, were altered (with a false discovery rate of 9.24%). This list was further narrowed by selecting for transcripts with an estimated absolute raw -fold change ≥1.50 and with a higher Δ (threshold) value to obtain 102 genes with median false discovery rate of 1.96%. Identity of transcripts was based on annotation by Affymetrix (affymetrix.com/analysis/netaffx/index.affx). Fig. 3 and Table S1 (supplementary information) shows a select set of genes with readily assignable functions.
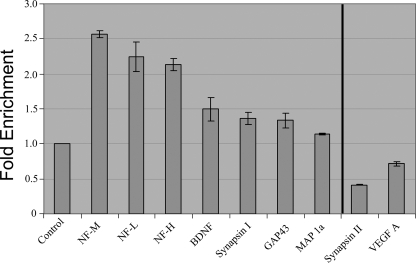
We next validated a subset of genes by qRT-PCR as an independent method to estimate the level of alteration. As shown in Fig. 4, genes that are up-regulated in the microarray are also up-regulated in quantitative reverse transcriptase assays. Likewise genes that are down-regulated are also similarly decreased. Fig. 4 shows a few examples of (a) up-regulated genes (left of vertical line): Neurofilaments light (p < 0.005), medium (p < 0.005), and heavy (p < 0.0005), BDNF (p < 0.05), Synapsin I (p < 0.05), Map1a (p < 0.005), and GAP43 (p < 0.05); and (b) down-regulated genes (right of vertical line): VEGF-A (p < 0.005) and Synapsin II (p < 0.0005).
FIGURE 4.
Knockdown of LANP results in alterations in expression of numerous genes. RNA was isolated from PC12 cells 48 h after transfection with siRNA targeting LANP and control siRNA. DNase-treated RNA was subjected to quantitative RT-PCR analysis employing primers to amplify the indicated transcripts. Ct value of each sample is normalized to GAPDH and fold-change is relative to control transfected PC12 cells.
LANP Resides at the Promoter of the NF-L Chain Gene—The microarray analyses suggested to us that the expression levels of numerous key genes involved in neuronal differentiation are indeed regulated by LANP. Next we sought to identify if LANP directly targets any of the genes that are up-regulated. Because LANP is a transcriptional repressor, we started with the assumption that genes that demonstrate an increased expression immediately after LANP is depleted are likely to be direct targets. In the course of validating genes up-regulated upon LANP depletion, we found that among the seven genes that we tested in Fig. 4, there was a consistent early up-regulation of neurofilament light and medium chain genes. The Neurofilament light chain gene, in particular, has been especially well studied as a marker of neuronal differentiation in PC12 cells (21). This up-regulation of NF-L is readily detectable at 24 h post-transfection the time point at which significant depletion of LANP is observed (supplemental Fig. S2). This led us to test the idea that the Nf-L gene might be a direct target of LANP-induced repression.
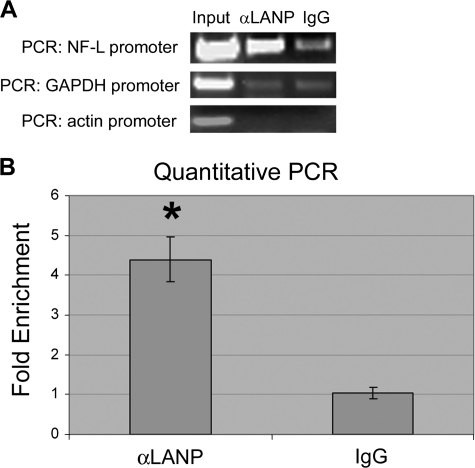
To test whether the Nf-L gene might indeed be a direct target of LANP, we performed chromatin immunoprecipitation using antibodies to LANP and IgG (as a negative control), followed by PCR using primers to the promoter region of Nf-L chain gene. We observed that the NF-L promoter was co-immunoprecipitated by an LANP antibody (Fig. 5A). Quantitative PCR represented 4-fold enrichment of the NF-L promoter with LANP antibody (p < 0.005) (Fig. 5B) suggesting that LANP resides in this region of the Nf-L gene and likely regulates its expression directly.
FIGURE 5.
LANP resides at the promoter of the Nf-L gene demonstrated by chromatin immunoprecipitation. A, chromatin bound to LANP was immunoprecipitated from PC12 cell lysates (input) with an anti-LANP antibody (or IgG serving as a control). PCR was performed to amplify the promoter regions of NF-L or two control genes, GAPDH and actin. B, the neurofilament promoter bound to LANP by ChIP was quantified by qPCR by normalizing to one of the controls (GAPDH) with the results graphed as -fold enrichment compared with pulldown by IgG. *, p < 0.005.
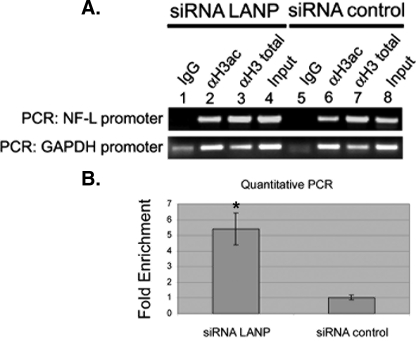
LANP Depletion Increases Histone Acetylation Status of the NF-L Promoter—Acetylation status of the histones can serve as an indicator of the transcriptionally active state of a promoter. Histones are acetylated when the gene is transcriptionally active. Because the binding of LANP as an INHAT has been best established for histone H3 (22), we performed ChIP with acetyl-H3 antibody to determine whether depletion of LANP increases the histone H3 acetylation status of the promoter of Nf-L chain (22, 23). To this end, cells transfected with siRNA targeting LANP and control siRNA were exposed to cross-linking agents, chromatin was precipitated with H3-acetyl, H3-total, or IgG (control) antibodies and the promoter region of the Nf-L chain gene was amplified. In LANP-depleted cells, ChIP using an anti-H3-acetyl antibody shows an increase in the NF-L promoter as amplified by PCR (Fig. 6A, compare lanes 2 and 6). Quantitative PCR showed 5-fold enrichment in NF-L promoter upon LANP knockdown (p < 0.01) (Fig. 6B). There is no difference in the levels of enrichment of the NF-L promoter by ChIP when a control total H3 antibody is used. We also did not detect any increase in histone acetylation on a control β-globin promoter (supplemental Fig. S3), demonstrating that depleting LANP increases histone acetylation only on promoters of genes such as Nf-L, whose expression is up-regulated upon LANP depletion. Taken together, these observations strengthen the notion that LANP directly influences the expression of the Nf-L chain gene by altering the histone acetylation status of the promoter region in PC12 cells.
FIGURE 6.
Knockdown of LANP results in hyperacetylation at the NF-L promoter. A, PC12 cells were transfected with siRNA targeting LANP or control siRNA. 48 h post-transfection, cells were processed for chromatin immunoprecipitation with anti-acetyl H3 (H3 ac), anti-H3 total antibody, or IgG (serving as a negative control). PCR was performed to amplify the promoter region of NF-L and GAPDH (control). Pre-immunoprecipitated lysate served as input. B, qPCR analysis quantified the pulldown. *, p < 0.01. This figure is representative of three individually performed transfection experiments.
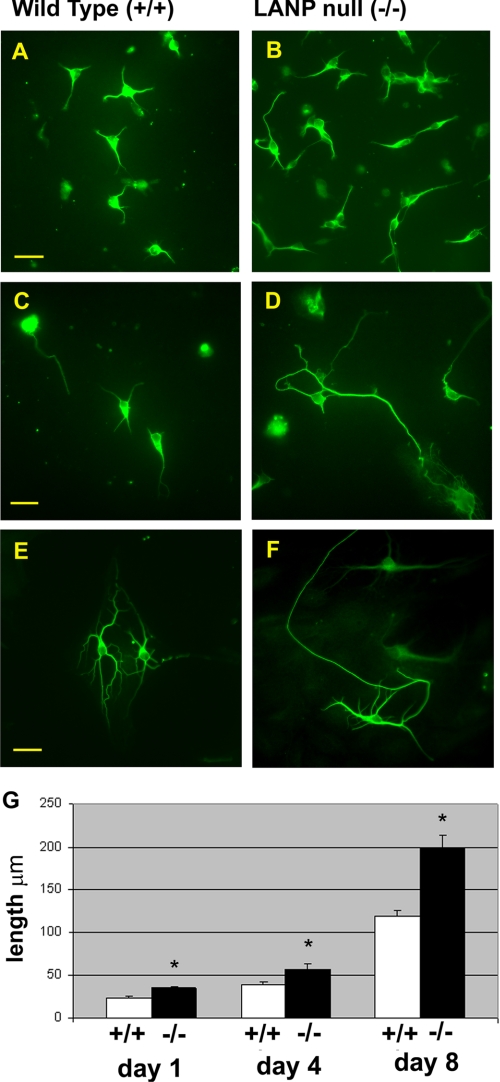
Role of LANP in Primary Hippocampal Neurons—We have recently established a colony of LANP null mice by genetic engineering (24). It is intriguing that depleting LANP does not lead to a significant adverse behavioral phenotype. However, because of the significant effects of LANP on neuritic extension we tested if primary neurons from these mice can be distinguished from those derived from wild-type littermates. For these experiments, we focused on analyzing the properties of hippocampal neurons, neurons that are relatively easy to culture and analyze by morphometric criteria (17, 18). Unlike PC12 cells, hippocampal primary neurons at baseline begin to extend neurites in culture. However, in this system as well, we found that hippocampal neurons from mice lacking LANP significantly differed from those derived from wild-type littermates. Specifically, they displayed an enhanced ability to generate neurites compared with wild-type littermates as shown in Fig. 7 (mean length: day 1 in culture, wild-type 23.6 μm ± 1.2 versus LANP null 34.9 μm ± 1.6; day 4 in culture, wild-type 39.4 μm ± 3.9 versus LANP null 57.4 μm ± 5.5; and day 8 in culture, wild-type 119.2 μm ± 7.1 versus LANP null 198.2 μm ± 14.6; p < 0.001 in all instances). These results once again substantiate the role of LANP in modulating neurite outgrowth.
FIGURE 7.
Primary hippocampal neurons from LANP null mice show enhanced neurite outgrowth. Primary hippocampal neurons were prepared from P1 pups. After days 1, 4, or 8 in culture, cells were fixed and stained for neuron-specific tubulin as a marker for neurite outgrowth. A, immunofluorescence microscopy of neurons derived from both wild-type mice (A, C, and E) and LANP null littermates (B, D, and F) (day1, A and B; day 4, C and D; day 8, E and F, inculture). Scale bar = 20μm. G, neurons from LANP null mice have longer neurites on average. Data are presented as the length of the longest neurite determined using Metamorph software. 100 cells were measured for each condition on day 1, 60 cells on day 4, and 80 cells on day 8. All LANP null-derived neurons differ from wild-type littermate-derived neurons with p < 0.001 (*). Error bars represent standard error.
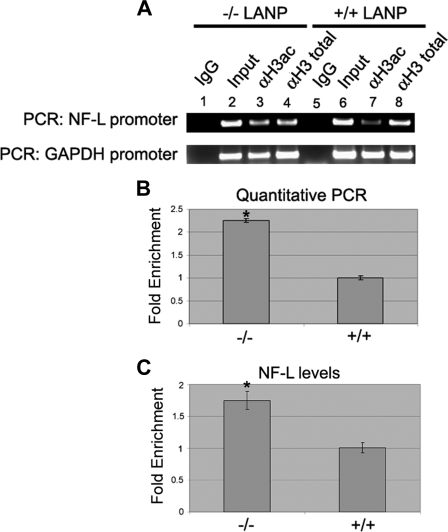
LANP Deletion in Mice Alters Histone Acetylation Status of the NF-L Promoter and Increases NF-L Expression—The altered phenotype of neurons from LANP null mice and our results in PC12 cells prompted us to investigate the histone acetylation status of the promoter of the Nf-L chain in a in vivo situation. We performed chromatin immunoprecipitation with acetyl-H3 antibody from the brains of wild-type and LANP null mice at postnatal day 2, the time at which cultured neurons depict phenotypic changes. Brain tissue was cross-linked and chromatin was precipitated with H3-acetyl, H3-total, or IgG (control) antibodies and the promoter region of the Nf-L chain gene was amplified. Similar to results obtained from PC12 cells, we observed an increased amount of NF-L promoter amplified by H3-acetyl antibody from LANP null mice (Fig. 8A, compare lanes 3 and 7). Immunoprecipitation with H3-total and IgG served as the controls. Quantitative PCR on DNA pulled down by H3-acetyl antibody showed ∼2-fold enrichment in NF-L promoter in LANP null mice (p < 0.005) (Fig. 8B). Similar to our in vitro studies, we did not observe any increase in histone acetylation at the promoter of the β-globin gene in LANP null mice (supplemental Fig. S4). Next we wished to determine whether increased histone acetylation at the NF-L promoter in LANP null mice is accompanied by an increased level of NF-L transcripts. We extracted RNA from the brains of postnatal day 2 wild-type and LANP null mice and subjected the RNA to qRT-PCR analysis. We observed a significant increase in the levels of NF-L in LANP null pups compared with wild-type littermates (p < 0.01) (Fig. 8C). These observations in vivo provide convincing evidence that LANP influences the expression of genes such as Nf-L, by altering the histone acetylation status of the promoter region.
FIGURE 8.
Deletion of LANP in mice results in hyperacetylation at the Nf-L promoter and increase in NF-L message. A and B, neurons from LANP mice demonstrate increased acetylation at the Nf-L promoter. Postnatal day 2 mice were sacrificed and brains were processed for chromatin immunoprecipitation with anti-acetyl H3 (H3 ac), anti-H3 total, or IgG (serving as control) antibody. PCR was performed to amplify the promoter region of Nf-L and GAPDH (control). Pre-immunoprecipitated lysate served as input. A, semi-quantitative PCR. B, qPCR analysis quantified the pulldown. *, p < 0.005. This figure is representative of two individually performed chromatin immunoprecipitation experiments. C, neurons from LANP null mice demonstrate an increase in the NF-L message. RNA was isolated from brains of postnatal day 2 wild type (+/+) and LANP-null (-/-) mice. DNase-treated RNA was subjected to quantitative RT-PCR analysis employing primers to amplify NF-L and GAPDH transcripts. Ct value of each sample is normalized to GAPDH and -fold change is relative to RNA from wild-type brain (*, p < 0.01).
DISCUSSION
In this study, we have established a role for LANP in regulating neuronal development, specifically neurite outgrowth both in vitro and in vivo. In addition, we have mechanistically begun to understand how LANP represses genes central to the developmental program.
These novel findings tie in well with known properties of LANP, yet open novel avenues of study. LANP is a nucleocytoplasmic shuttling protein with a propensity to move into the cytoplasm, when neurons are in the process of differentiating (10). In the past, we had related this movement to the ability of LANP to modulate cytoskeletal networks by interacting with microtubule-associated proteins (10). The current studies suggest that LANP also plays a role in suppressing expression of genes involved in neurite outgrowth.
We provide evidence to suggest that the nuclear function of LANP in developing neurons revolves around stabilizing the gene expression signature. Indeed, the ability of LANP-depleted PC12 cells to show increased neurite outgrowth in the absence of NGF points to LANP acting as a repressor of neuron-specific transcription machinery. This basal state is sufficient to be unleashed into a neuronal mode when LANP is depleted. This ability to regulate or maintain the differentiation status of cells may also explain why LANP expression levels have been correlated with the grade and tumorigenicity in a variety of cancers (25–27). These properties of LANP are also likely to play a role in pathogenesis of neurodegenerative diseases, such as Spinocerebellar Ataxia Type 1, where LANP has been implicated in pathogenesis (14, 28, 29).
In some respects our results on differentiation are reminiscent of treating neuronal cells with HDAC inhibitors that, like LANP depletion, also bring about an increase in histone acetylation and a similar pro-neuritic phenotype. It would be important to test if there exists a subset of genes jointly modulated by HDACs and INHATs, or whether there is cross-talk between these two activities to coordinate gene expression.
Although, this study was not designed to comprehensively identify the targets of the INHAT function of LANP, we envisage that like the neurofilament light chain gene, several of the genes that show an increased expression upon LANP depletion will be LANP targets. More stringent experiments using techniques such as chromatin precipitation followed by microarray-based techniques, also known as the ChIP on CHIP technique, will be required to truly delineate LANP targets in a more comprehensive manner (30). Alternatively, recent efforts to establish the transcription factors that recruit LANP might help identify gene networks regulated by LANP (14).
Although many of the genes induced by NGF treatment are up-regulated upon LANP depletion, we noticed that the changes in gene expression caused by depleting LANP do not have a direct one-to-one correspondence with treating PC12 cells with NGF (31–35). One possible explanation is that NGF regulates several signaling mechanisms with different dynamics (36, 37), whereas LANP plays a role in a subset of gene expression changes involved in differentiation.
It would be interesting to ascertain the identity of the histone acetyltransferases targeted by LANP. Because LANP inhibits HATs via a histone masking mechanism, it is not surprising that LANP inhibits the activity of a variety of HATs (11, 12). The fact that LANP regulates histone acetylation in the vicinity of the NF-L promoter and influences NF-L expression suggests that HATs modulating neurofilament light chain expression would be the candidate HATs affected by LANP in vivo. Unfortunately, the HATs regulating the neurofilament light chain acetylation are not well characterized, but CREB-binding protein (CBP) is likely to be a candidate given that the promoter of NF-L gene contains a CREB binding (CRE) element (38). Moreover, CREB appears to be important for inducing the transcription program involved in neurite outgrowth (39). Another approach to identify HATs affected by LANP might be to compare our gene expression alterations upon LANP depletion to alterations of gene expression upon modulating the levels of individual HATs.
Finally, even beyond its effects on the cytoskeleton and its nuclear functions as an INHAT, there is evidence to suggest that LANP might play a role in cell signaling by inhibiting the protein phosphatase PP2A and regulating the stability of RNA by binding to RNA-binding proteins (reviewed in Ref. 40). Our studies were not aimed at studying these properties of LANP. However, future studies will have to be designed to address the differential contributions of each of these processes to neurite outgrowth and how they are coordinated in space and time.
Supplementary Material
Acknowledgments
We thank Adriana Ferreira, Debu Chakravarti, and Kathy Rundell for constructive criticism throughout the project.
This work was supported, in whole or in part, by National Institutes of Health Grants K08 NS02246, K02 NS051340, and R21 NS060080 (to P. O.) and Training Grant 5T32 NS41234-01 (to R. K.). This work was also supported by grants from the National Organization for Rare Disorders (NORD), the National Ataxia Foundation, and the American Cancer Society, IL Division (to P. O.). The costs of publication of this article were defrayed in part by the payment of page charges. This article must therefore be hereby marked “advertisement” in accordance with 18 U.S.C. Section 1734 solely to indicate this fact.
The on-line version of this article (available at http://www.jbc.org) contains supplemental Figs. S1–S4 and Tables S1.
Footnotes
The abbreviations used are: HAT, histone acetyltransferase; HDAC, histone deacetylase; Bt2cAMP, dibutyryl cyclic AMP; qPCR, quantitative PCR; RT, reverse transcriptase; CBP, CREB-binding protein; CREB, cAMP-response element-binding protein; LANP, leucine-rich acidic nuclear protein; FBS, fetal bovine serum; NGF, nerve growth factor; RNAi, RNA interference; siRNA, small interfering RNA; ChIP, chromatin immunoprecipitation; GAPDH, glyceraldehyde-3-phosphate dehydrogenase; INHAT, inhibitor of histone acetyltransferase.
References
- 1.Robertson, K. D., and Wolffe, A. P. (2000) Nat. Rev. Genet. 1 11-19 [DOI] [PubMed] [Google Scholar]
- 2.Strahl, B. D., and Allis, C. D. (2000) Nature 403 41-45 [DOI] [PubMed] [Google Scholar]
- 3.Suzuki-Mizushima, Y., Gohda, E., Okamura, T., Kanasaki, K., and Yamamoto, I. (2002) Brain Res. 951 209-217 [DOI] [PubMed] [Google Scholar]
- 4.Lee, J. H., Hart, S. R., and Skalnik, D. G. (2004) Genesis 38 32-38 [DOI] [PubMed] [Google Scholar]
- 5.Lin, W., and Dent, S. Y. (2006) Curr. Opin. Genet. Dev. 16 137-142 [DOI] [PubMed] [Google Scholar]
- 6.Petrij, F., Giles, R. H., Dauwerse, H. G., Saris, J. J., Hennekam, R. C., Masuno, M., Tommerup, N., van Ommen, G. J., Goodman, R. H., Peters, D. J., and Breuning, M. H. (1995) Nature 376 348-351 [DOI] [PubMed] [Google Scholar]
- 7.Tanaka, Y., Naruse, I., Maekawa, T., Masuya, H., Shiroishi, T., and Ishii, S. (1997) Proc. Natl. Acad. Sci. U. S. A. 94 10215-10220 [DOI] [PMC free article] [PubMed] [Google Scholar]
- 8.Yao, T. P., Oh, S. P., Fuchs, M., Zhou, N. D., Ch'ng, L. E., Newsome, D., Bronson, R. T., Li, E., Livingston, D. M., and Eckner, R. (1998) Cell 93 361-372 [DOI] [PubMed] [Google Scholar]
- 9.Ulitzur, N., Rancaño, C., and Pfeffer, S. R. (1997) J. Biol. Chem. 272 30577-30582 [DOI] [PubMed] [Google Scholar]
- 10.Opal, P., Garcia, J. J., Propst, F., Matilla, A., Orr, H. T., and Zoghbi, H. Y. (2003) J. Biol. Chem. 278 34691-34699 [DOI] [PubMed] [Google Scholar]
- 11.Seo, S. B., McNamara, P., Heo, S., Turner, A., Lane, W. S., and Chakravarti, D. (2001) Cell 104 119-130 [DOI] [PubMed] [Google Scholar]
- 12.Seo, S. B., Macfarlan, T., McNamara, P., Hong, R., Mukai, Y., Heo, S., and Chakravarti, D. (2002) J. Biol. Chem. 277 14005-14010 [DOI] [PubMed] [Google Scholar]
- 13.Matsuoka, K., Taoka, M., Satozawa, N., Nakayama, H., Ichimura, T., Takahashi, N., Yamakuni, T., Song, S.-Y., and Isobe, T. (1994) Proc. Natl. Acad. Sci. U. S. A. 91 9670-9674 [DOI] [PMC free article] [PubMed] [Google Scholar]
- 14.Cvetanovic, M., Rooney, R. J., Garcia, J. J., Toporovskaya, N., Zoghbi, H. Y., and Opal, P. (2007) EMBO Rep. 8 671-677 [DOI] [PMC free article] [PubMed] [Google Scholar]
- 15.Christova, R., and Oelgeschlager, T. (2002) Nat. Cell Biol. 4 79-82 [DOI] [PubMed] [Google Scholar]
- 16.Braveman, M. W., Chen-Plotkin, A. S., Yohrling, G. J., and Cha, J. H. (2004) Methods Mol. Biol. 277 261-276 [DOI] [PubMed] [Google Scholar]
- 17.Banker, G. A., and Cowan, W. M. (1977) Brain Res. 126 397-425 [DOI] [PubMed] [Google Scholar]
- 18.Dawson, H. N., Ferreira, A., Eyster, M. V., Ghoshal, N., Binder, L. I., and Vitek, M. P. (2001) J. Cell Sci. 114 1179-1187 [DOI] [PubMed] [Google Scholar]
- 19.Greene, L. A., and Tischler, A. S. (1976) Proc. Natl. Acad. Sci. U. S. A. 73 2424-2428 [DOI] [PMC free article] [PubMed] [Google Scholar]
- 20.Vaudry, D., Stork, P. J., Lazarovici, P., and Eiden, L. E. (2002) Science 296 1648-1649 [DOI] [PubMed] [Google Scholar]
- 21.Schimmelpfeng, J., Weibezahn, K. F., and Dertinger, H. (2004) J. Neurosci. Methods 139 299-306 [DOI] [PubMed] [Google Scholar]
- 22.Schneider, R., Bannister, A. J., Weise, C., and Kouzarides, T. (2004) J. Biol. Chem. 279 23859-23862 [DOI] [PubMed] [Google Scholar]
- 23.Kutney, S. N., Hong, R., Macfarlan, T., and Chakravarti, D. (2004) J. Biol. Chem. 279 30850-30855 [DOI] [PubMed] [Google Scholar]
- 24.Opal, P., Garcia, J. J., McCall, A. E., Xu, B., Weeber, E. J., Sweatt, J. D., Orr, H. T., and Zoghbi, H. Y. (2004) Mol. Cell Biol. 24 3140-3149 [DOI] [PMC free article] [PubMed] [Google Scholar]
- 25.Kadkol, S. S., Brody, J. R., Epstein, J. I., Kuhajda, F. P., and Pasternack, G. R. (1998) Prostate 34 231-237 [DOI] [PubMed] [Google Scholar]
- 26.Kadkol, S. S., El Naga, G. A., Brody, J. R., Bai, J., Gusev, Y., Dooley, W. C., and Pasternack, G. R. (2001) Breast Cancer Res. Treat. 68 65-73 [DOI] [PubMed] [Google Scholar]
- 27.Brody, J. R., Witkiewicz, A., Williams, T. K., Kadkol, S. S., Cozzitorto, J., Durkan, B., Pasternack, G. R., and Yeo, C. J. (2007) Mod. Pathol. 20 1238-1244 [DOI] [PubMed] [Google Scholar]
- 28.Matilla, A., Koshy, B., Cummings, C. J., Isobe, T., Orr, H. T., and Zoghbi, H. Y. (1997) Nature 389 974-978 [DOI] [PubMed] [Google Scholar]
- 29.Orr, H. T., and Zoghbi, H. Y. (2007) Annu. Rev. Neurosci. 30 575-621 [DOI] [PubMed] [Google Scholar]
- 30.Buck, M. J., and Lieb, J. D. (2004) Genomics 83 349-360 [DOI] [PubMed] [Google Scholar]
- 31.Lee, N. H., Weinstock, K. G., Kirkness, E. F., Earle-Hughes, J. A., Fuldner, R. A., Marmaros, S., Glodek, A., Gocayne, J. D., Adams, M. D., Kerlavage, A. R., Fraser, C. M., and Venter, J. C. (1995) Proc. Natl. Acad. Sci. U. S. A. 92 8303-8307 [DOI] [PMC free article] [PubMed] [Google Scholar]
- 32.Vician, L., Basconcillo, R., and Herschman, H. R. (1997) J. Neurosci. Res. 50 32-43 [DOI] [PubMed] [Google Scholar]
- 33.Brown, A. J., Hutchings, C., Burke, J. F., and Mayne, L. V. (1999) Mol. Cell Neurosci. 13 119-130 [DOI] [PubMed] [Google Scholar]
- 34.Angelastro, J. M., Klimaschewski, L., Tang, S., Vitolo, O. V., Weissman, T. A., Donlin, L. T., Shelanski, M. L., and Greene, L. A. (2000) Proc. Natl. Acad. Sci. U. S. A. 97 10424-10429 [DOI] [PMC free article] [PubMed] [Google Scholar]
- 35.Lee, K. H., Ryu, C. J., Hong, H. J., Kim, J., and Lee, E. H. (2005) Neurochem. Res. 30 533-540 [DOI] [PubMed] [Google Scholar]
- 36.Marek, L., Levresse, V., Amura, C., Zentrich, E., Van Putten, V., Nemenoff, R. A., and Heasley, L. E. (2004) J. Cell Physiol. 201 459-469 [DOI] [PubMed] [Google Scholar]
- 37.Dijkmans, T. F., van Hooijdonk, L. W., Schouten, T. G., Kamphorst, J. T., Vellinga, A. C., Meerman, J. H., Fitzsimons, C. P., de Kloet, E. R., and Vreugdenhil, E. (2009) J. Neurochem., in press
- 38.Lonze, B. E., and Ginty, D. D. (2002) Neuron 35 605-623 [DOI] [PubMed] [Google Scholar]
- 39.Redmond, L., Kashani, A. H., and Ghosh, A. (2002) Neuron 34 999-1010 [DOI] [PubMed] [Google Scholar]
- 40.Matilla, A., and Radrizzani, M. (2005) Cerebellum 4 7-18 [DOI] [PubMed] [Google Scholar]
Associated Data
This section collects any data citations, data availability statements, or supplementary materials included in this article.


