

Abstract
In the last few years, there has been a greater appreciation by the scientific community of how separation science has contributed to the advancement of biomedical research. Despite past contributions in facilitating several biomedical breakthroughs, separation sciences still urgently need the development of improved methods for the separation and detection of biological and chemical substances. In particular, the challenging task of quantifying small molecules and biomolecules, found in low abundance in complex matrices (e.g., serum), is a particular area in need of new high-efficiency techniques. The tandem or on-line coupling of highly selective antibody capture agents with the high-resolving power of CE is being recognized as a powerful analytical tool for the enrichment and quantification of ultra-low abundance analytes in complex matrices. This development will have a significant impact on the identification and characterization of many putative biomarkers and on biomedical research in general. Immunoaffinity CE (IACE) technology is rapidly emerging as the most promising method for the analysis of low-abundance biomarkers; its power comes from a three-step procedure: (i) bioselective adsorption and (ii) subsequent recovery of compounds from an immobilized affinity ligand followed by (iii) separation of the enriched compounds. This technology is highly suited to automation and can be engineered to as a multiplex instrument capable of routinely performing hundreds of assays per day. Furthermore, a significant enhancement in sensitivity can be achieved for the purified and enriched affinity targeted analytes. Thus, a compound that exists in a complex biological matrix at a concentration far below its LOD is easily brought to well within its range of quantification. The present review summarizes several applications of IACE, as well as a chronological description of the improvements made in the fabrication of the analyte concentrator-microreactor device leading to the development of a multidimensional biomarker analyzer.
Keywords: Affinity capillary electrophoresis, Analyte concentrator, Biomarkers, Immunoaffinity capillary electrophoresis, Proteomics, Solid-phase extraction
1 Introduction
The readers of this journal and analytical chemists in general, are likely to see the challenges of biomarker research from only one vantage point; that is, an analytical chemistry point of view, which emphasizes optimizing separation science and MS.
There is another vantage point in biomarker discovery, the immunoassay point of view. Pharmaceutical companies are under increasing pressure to include biomarkers as a part of their preclinical and clinical programs. The vast majority of that work is farmed out to contract research organizations (CROs) like, Covance, Tandem Labs, and Pharmaceutical Product Development. While CROs are expert in LC-MS/MS, they use this technology for pharmacokinetic (PK), pharmacodynamic (PD), and drug metabolism studies. For biomarker research they use traditional immunoassays.
Pharmaceutical and biotechnology clinical research is obligated to have biomarkers in order to have clinical trials approved, and they are using traditional immunoassays. This is a major industry; these CROs are essential to clinical research. This is not a future industry that is waiting for separation science to develop technologies, they have questions that must be answered now, and they are relying on traditional immunoassays for the answers.
This may be lost on the analytical chemist/separation scientist who is far more focused on developing technologies than on clinical research and development. If so, the current importance and reliance on immunoassay is lost as well.
This paper attempts to bring to light the immunoassay point of view to the analytical chemist and highlight the opportunity to harness this biological power within analytical chemistry.
The goal of the analytical process is to obtain high-quality information with consistently high reliability. Significant progress has been achieved in obtaining reliable information. Analytical instrumentation, columns with unique bonded chemistries, and multiple tandem coupled detection systems capable of characterizing a wide range of chemical or biological analytes, have led this advance. Chromatography coupled to one or more detectors (e.g., UV, fluorescence, MS-MS) has achieved maturity in the last two decades and thousands of practical applications are currently used in pharmaceutical science, clinical chemistry, food science, forensic science, and environmental science [1-7]. However, the identification and the determination of the percentage composition of compounds in simple and complex mixtures have been achieved primarily by employing a fairly large concentration of the analytes of interest, or large sample volumes concentrated off-line by traditional SPE procedures. Despite decades of effort in improving detection, many compounds representative of biological phenomena (i.e., biomarkers) in biological fluids, cells and tissues have not reached the levels of sensitivity required for routine analyses or for screening clinical samples. Dealing with the isolation and characterization of analytes in complex biological matrices is one of the most urgent challenges facing bioanalytical chemists and biologists today.
The field of microfluidics and nanofluidics is developing at a rapid pace and giving rise to technologies that fabricate instruments capable of controlling the flow of minute amounts of fluids in miniaturized systems. These miniaturized instruments are well suited to carry, manipulate, concentrate, derivatize, separate, detect, and process biological molecules, organelles, and even intact cells. The fine-tuned control of the liquid is exerted primarily by the EOF, but a small amount of pressure may be used to drive the flow or fluid in some applications. The direction of the liquid flow is controlled by the integrated circuitry of the microchip. These instruments continue to develop and improve, finding new and better applications from basic research to routine biomedical analyses [8-12]. Although there are many advantages to using miniaturized analytical instruments, such as CE, the introduction of small sample volumes into the capillaries or microchannels lead to a limited loading capacity of solutions, which ultimately results in poor concentration LOD of the targeted analytes. When only nanoliter or sub-nanoliter sample volumes are introduced into the capillary or microchip channel, and the sample contains a sub-nanomolar concentration of the analyte of interest, only a few molecules are available for detection.
Researchers have developed many methods to improve CE sensitivity and selectivity of analytes found at low concentration in simple and complex matrices. Some of these sensitivity-enhancing methods are strictly chemical methods (e.g., derivatization, stacking) while others employ devices (e.g., micro-SPE) and instrument improvements (e.g., extended-path-length-detection cells), still others are a combination of both (e.g., LIF). A number of recent publications have addressed this subject in detail [13-23, 29, 42, 133, 134, 160, 162]. Among the emerging technologies to improve sensitivity, immunoaffinity CE (IACE) is perhaps one of the most promising.
Beyond sensitivity and in contrast with traditional immunoassays, IACE has the capability of performing quantification and characterization of several analytes simultaneously by serial application of the sample to an array of immunoaffinity analyte concentrators housed within a single instrument [24-29].
Historically, the techniques used for the purpose of enhancing sensitivity that were carried out by analytical chemists/biochemists (e.g., HPLC-fluorescence, CE-fluorescence, HPLC-MS, CE-MS) or by immunologists/biologists (i.e., RIA, ELISA) belonged in two different worlds. The educational background and expertise of the users of these two classes of techniques were completely different. The pressing need for major improvements in sensitivity in assays of ultra-low abundance components of biological matrices has forced these two worlds together. In the last two decades, the merging of immunochemistry and analytical chemistry has led to significant progress in the enhancement of sensitivity and selectivity by coupling immunoassays with separation techniques. In the early 1980s, Kasicka and Prusik [30, 31] reported the electrodesorption of a mouse antibody from transferrin immobilized to a solid support connected to a conventional ITP instrument. In 1985, Phillips et al. [32-34] were able to determine the amount of IgG in cerebral spinal fluid employing an anti-IgG antibody immobilized to packing particles of an HPLC column. Later on 1991, Farjam et al. [35] used an immunoaffinity sample pretreatment system on-line to a gas chromatograph to determine urinary hormones. In the last several years, a number of advances have been described employing immunoaffinity chromatography [34, 36-38].
In 1990 and 1991, Guzman et al. [39, 40, 129] were able to determine successfully the amount of methamphetamine in urine by IACE employing an antimethamphetamine IgG antibody immobilized to controlled-porous glass contained in a small device located near the inlet of the separation capillary. The authors used the term analyte concentrator-microreactor for this device. The terminology “analyte concentrator” referred to the function of isolating and concentrating the target analyte, usually present in a complex matrix [39-46]. Whereas, the terminology “microreactor” referred to the function of performing a chemical and/or biochemical reaction, such as derivatization, chemical synthesis, or enzymatic reaction [44, 132]. To date, many different models have been designed for the device known as an analyte concentrator-microreactor (see Figs. 1 and 2) using it on-line with the capillary or microchip channel for enrichment and isolation of analytes of interest present in matrices of different chemical or biological origins [24-29, 39-55].
Figure 1.
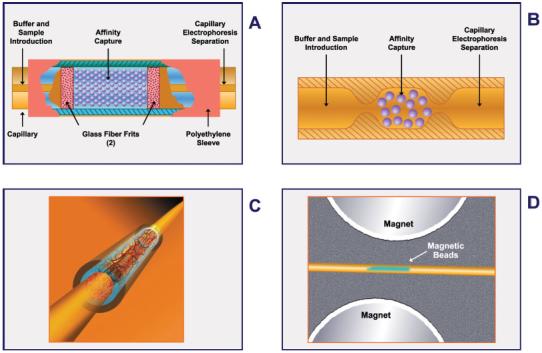
Schematic representations of four different designs of an analyte concentrator-microreactor in which the solid support holds an immobilized affinity ligand, capturing small-molecular-weight substances or biomolecules. (A) The original concept that employs a piece of capillary containing free-floating irregularly shaped or spherical glass beads. The beads (containing one or more immobilized affinity ligands to capture a selective target analyte) are retained within a restricted space by two frits or porous plugs fabricated from polymeric or glass materials, or the beads can be chemically linked to each other and to the inner walls of the capillary to avoid the use of frits. (B) The beads can be retained without frits within the capillary by tube constrictions at the interface of the concentrator capillary and the separation capillary, or the beads of the analyte concentrator may be retained without frits because they are larger than the separation capillary. (C) The solid support does not contain free-floating beads and frits, but rather a fritless analyte concentrator-microreactor containing a membrane, sol-gel, or monolithic material to which an antibody or other affinity ligand is immobilized. (D) This design contains magnetic beads to which the affinity ligand is immobilized. There are no frits, but one or two magnets are needed to hold the beads in place. Figure modified from refs. [29, 48-53, 133, 134, 161].
Figure 2.
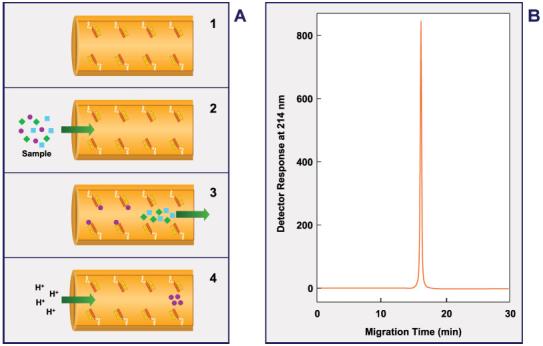
Schematic representation of a design of an analyte concentrator-microreactor in which the solid support contains an immobilized affinity ligand, capturing a low-molecular-weight substance or biomolecule, directly bound to the inner wall of the capillary. This design uses no beads, frits, sol-gel, or monolithic materials. (A) Represents the principle of immunoaffinity chromatography: 1, immobilization of an affinity capture substance; 2, binding of an antigen(s) or hapten(s) present in a simple or complex matrix to the immobilized affinity substance; 3, cleaning excess amounts of unwanted material and equilibration of the capillary system; 4, elution or release of the reversibly bound antigen(s) or hapten(s). (B) Typical electropherogram of the purified and enriched analyte extracted from a simple or complex matrix. Figure modified from refs. [54, 55, 154]. A multibore capillary with affinity ligands bound to the inner wall of each microcapillary has also been described [29, 49, 133].
Thus, a new era of immunoseparation techniques was born: immunoaffinity ITP (IAIP), immunoaffinity LC (IALC), and IACE. Unfortunately, IAIP and IALC were designed employing conventional instrumentation (e.g., bulky designs, time consuming assays, low-throughput capability, etc.), and thus the technologies have been used for several years only by a very small group of scientists. In many cases, IALC was used primarily for purification purposes. On the other hand, IACE is emerging as a powerful tool having many unique features that are extremely practical when fabricated in a miniaturized format. These features include automation, high-throughput, and parallel multiplex operations, which are compatible with MS. Furthermore, significant enhancement of sensitivity has been achieved; with increases from a factor of 102 to 103 and even higher being reported. This review will focus on the technology of IACE and the coupling to one or more detection systems for the determination of a wide range of analytes found at various concentrations in biological matrices.
2 The concepts of immunoaffinity
The concept of immunoaffinity dates back to 1897 when Paul Ehrlich compared antigen-antibody reactions to the function of a “lock and key” [56]. Today, immunology employs numerous practical applications of affinity recognition and a battery of affinity techniques and reagents are currently commercially available. The coupling of affinity recognition technologies with analytical instrumentation to produce a new generation of immunoaffinity techniques will now, and in the future, fuel biomedical research [57-61].
The hallmark of the antibody response to antigenic challenge is its remarkable specificity, which Ehrlich recognized as a biological puzzle [62]; however, it took much of the following 70 years to achieve a fuller understanding of the chemical basis of this biological puzzle [63, 64].
Antigen-antibody interaction is one of the most specific molecular recognition processes that exists in nature [65, 66]. For more than 100 years, specific biological binding (enzyme-substrate [67] and antigen-antibody [56]) was theorized to be a “lock-and-key” concept. An absolute ratio of one to one was upheld, each antibody being specific only for one epitope. The specific “lock-and-key” theory was still the immunological dogma in the 1980s when it was reported that many hybridomas produced mAb that were not mono-reactive but instead reacted with a variety of different and totally unrelated antigens [68]. Several studies in the last decade have demonstrated the existence of mAb that can bind to a variety of antigens. Such antibodies are called “poly-reactive” or “poly-specific” arising from a conformational hypothesis that the antigen-binding sites of such antibodies are flexible enough to accommodate different antigens [68, 69]. Most poly-reactive antibodies belong to the IgM class, but some are IgG and IgA and can bind to proteins, carbohydrates, lipids, and nucleic acids. In the classical mode, a mono-reactive antibody binds to its cognate antigen as a key fits to its corresponding lock; the antigen-binding pocket of the antibody fitting the electron cloud shape of the epitope on the antigen. In the case of poly-reactive antibodies, the antigen-binding pocket is believed to be relatively flexible endowing the antibody with multiple configurations [68, 69]. Alternatively, once an antigen makes contact with the antigen-binding pocket of the reactive antibody, conformational changes in the pocket take place to accommodate that particular antigen [68, 69].
3 Comparison of ELISA and IACE
Today, immunoaffinity is a crucial tool in biomedical research and clinical diagnosis mainly due to the development of RIA [70] and ELISA [71, 72], which have been extensively used for targeted protein analysis. However, RIA and ELISA are limited by the excessive time required for the primary antibody-antigen complex formation, and are “blind” beyond the specific epitopes they bind. In the majority of cases, the antibodies used in ELISA tests typically cannot distinguish among co- or post-translationally modified proteins, or degraded proteins (aggregated, fragmented, clipped or truncated, glycosylated, glycated, oxidized, deaminated, phosphorylated, etc.). One such modification of a well-known protein could be the biomarker the researcher is looking for, rather than a whole new undiscovered protein. Affinity is still the most powerful selectivity tool, but perhaps not as absolute as the word “specificity” implies and often a second dimension is required to separate the compound(s) captured in the affinity step.
The principle of the sandwich ELISA method is depicted in Fig. 3. The sandwich ELISA is the most widely used method among the immunoassay techniques, and its two-antibody format is compared with the one-antibody format of IACE. ELISA requires a primary antibody directed to the target analyte, which is immobilized to a plastic solid support usually by noncovalent physical adsorption and a secondary antibody, which is conjugated to an enzyme. The primary immobilized antibody serves to specifically capture an immune-reactive affinity target or antigen present in samples. After washing the well of excess unbound sample components, the secondary antibody conjugated with an enzyme (i.e., alkaline phosphatase, horseradish peroxidase) is introduced. Finally, a substrate of the enzyme is added to the mixture and the reaction of the substrate with the enzyme yields the signal that is measured by absorbance, fluorescence, or luminescence.
Figure 3.
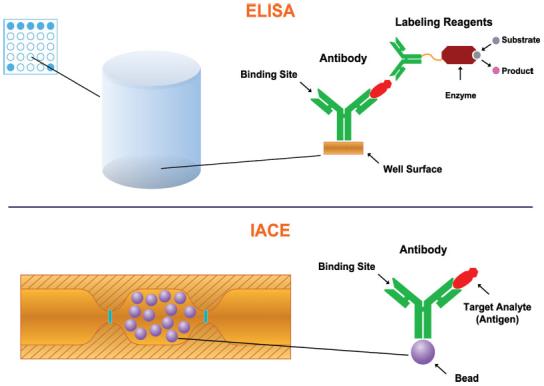
Schematic representation of the principles of ELISA and IACE.
The intensity of the reaction product is an indirect measurement of the quantity of the target antigen present in the sample. Thus, the quantitative measurement of the target antigen is an indirect determination of the material captured by the primary antibody, which could represent more than one substance isolated from the biological fluid or tissue extract under study. Accordingly, this assay may yield false-positive results and, therefore, the signal of the reaction may or may not correspond to the specificity of the antigen-antibody reaction. For example, if the primary antibody recognizes only one antigen, it is expected that the data will be a reflection of the quantity of that sole antigen present in a simple or complex mixture. By contrast, if the primary antibody recognizes more that one antigen (e.g., related substances like metabolites of the parent drug, or unrelated compounds that may only have one or two epitopes recognized by the primary antibody), the signal of the reaction may be larger than expected, due to an accumulative effect represented by more antigens or antigen-like substances bound to the primary antibody.
False positive results due to poly-reactivity/poly-specificity of antibodies have been reported in several important clinical ELISA methods [73]. For example, despite the existence of highly sensitive tests, such as ELISA and immuno-blotting techniques, inconclusive serological results are quite frequent in infectious diseases, such as Chagas disease, tuberculosis, leprosy, and West Nile virus [74]. Recently, it was reported that serum samples from patients with myco-bacterial infections (Mycobacterium leprae) crossreact with HIV structural proteins Gp41, p55, and p18 [75]. Conversely, IACE is a 2-D technology; therefore; even if an unrelated antigen or hapten is captured by the immobilized antibody in the first dimension (immunoassay), in the second dimension (separation) it will be identified as an unrelated component.
In classical immunoassays, the incubation time for antigen capture takes several hours; primarily due to an unfavorable surface-area-to-volume ratio of the antibody bound to the inner wall of the well and the sample solution filling the well. The strength and value of ELISA is its ability to detect target analytes at very low concentrations. However, it must be remembered that the lower the concentration of the target analyte in the sample, the less the probability it has of interacting with the bound antibody at the interface of the sample and the well surface. In the traditional well format, extensive incubation times are used to maximize this diffusion-driven process. The same scenario is true for both the primary and secondary antibody incubations.
Every assay must measure some signal. Some signals are directly related to the analyte, for example, a UV absorption spectrum is directly related to the physico-chemical properties of the analyte. In other techniques, the signal can be far removed from the target analyte. In ELISA, the signal is due to the addition of the substrate to the individual wells. The signal generated is dependent on several successive factors. One important factor is the quality of the enzyme linked to the secondary antibody and reacting with the appropriate substrate to produce a signal. The quality of the conjugation process of the enzyme to the antibody (e.g., aggregation is typically observed during conjugation of a protein) and the orientation of the antibody are crucial to binding to the target analyte and generation of optimal signal. The signal in an ELISA is therefore far removed from a direct relationship to the target analyte. Several consecutive steps must occur perfectly, specifically, and quantitatively to get an accurate signal. Due to the dependence on several steps, conventional ELISAs are unfortunately prone to false positive and false negative results [73].
In contrast to ELISA, IACE employs only one antibody for its corresponding antigen, which is immobilized to the analyte concentrator-microreactor device fabricated on-line with the separation capillary or microchip channel and located near the inlet of the capillary or microchip channel; interaction between the immobilized antibody and the target analyte requiring only a few minutes. This shorter interaction time is primarily due to a much more favorable surface-area-to-volume ratio of the analyte concentrator-microreactor that contains the immobilized antibody. After removing unbound material, the separation capillary is equilibrated with an appropriate separation buffer. The bound analyte is eluted and the CE separation is performed, followed by an appropriate detector.
Although ELISA has the benefit of quantifying proteins at low picogram per milliliter levels, it cannot be coupled with a separation system (e.g., HPLC, CE, or MS) to distinguish among or identify bound compounds. Such limits of quantification using various tandem detection systems (LIF and MS) are possible with IACE and permit the quantification and characterization of multiple components that would be seen as “one” component by ELISA. For example, using IACE, it was reported that a single antibody was able to capture up to four metabolites of a parent drug, when cyclosporin was used as a drug to prevent tissue rejection in a human corneal transplant operation [54]. Furthermore, the effect of the drug was tested in two scenarios; one when the treated patient tolerated the effect of the drug and did not present a toxic episode, and a patient that manifested toxicity. Interestingly, an extra metabolite (peak 1, ref. [54]) was observed only in the patient that manifested toxicity, indicating the presence of a true toxic biomarker. It is possible that this toxic biomarker could be the one responsible for the toxicity. Further, coupling the affinity step to the separation technology, and then to a suitable detector, including the identification technology of MS, constitutes a complete system able to identify each isolated and separated analyte enriched by the affinity-capture technology.
In summary, ELISA is a monodimensional technology that generates an indirect signal weakly related to the target analyte and incapable of distinguishing between multiple analytes present in a sample. IACE is a 2-D technology with multidimensional capabilities that is capable of direct detection of multiple analytes and also able to identify those analytes by MS techniques.
4 Other emerging technologies used for biomarker research
Proteomics and biomarker discovery techniques have already passed through two generations. The first generation was 2-DE, in-gel digestion, followed by MALDI-TOF MS [76-78]. The second generation was 2-D HPLC in tandem with MS-MS capabilities. This design has been termed MudPIT (multidimensional protein identification technology) [79]. MudPIT evolved to incorporate ICATs as an attempt to increase the quantitative nature of the technology [80]. The accuracy of this approach has been enhanced by the use of stable-isotope-labeled peptide internal standards to compensate for variation in recovery and the influence of differential matrix effects. Both, first and second generation, technologies provide outstanding and somewhat distinct features, and many laboratories are dedicated to their further advancement.
The complexity of protein-rich matrices, such as plasma, limits the usefulness of the MudPIT approach to quantification in the mid-nanogram per milliliter range (medium abundance proteins). The development of various proteomic methods and targeted solutions is fraught with pitfalls, many of which deal with the vast range of chemical and physical properties of different proteins. Some of these problems include the complexity of the protein-interaction map, a lack of standardization, which makes it difficult to compare or validate results from different laboratories, and a lack of protein-specific capture agents. The final goal of an ideal “biomarker technology” is to have the ability to detect and isolate signature proteins and/or peptides in a biological sample that are unique to a disease state, when compared to a normal sample. More recently, Ackermann and Berna [81] reviewed the current status of LC-MS-MS using selected reaction monitoring (SRM) for protein quantification and specifically considered the use of a single antibody to achieve superior enrichment of the protein/peptide target. Although immunoaffinity-assisted LC/MS and LC-MS-MS demonstrated quantitative analysis of low-abundance proteins in the sub-nanogram per milliliter range, it is still a low-throughput technology [81, 82]. Table 1 and [ref. 83] show the advantages and limitations of the major proteomics technologies.
Table 1.
Advantages and limitations of the major proteomics technologies
| Proteomic platform properties | 2-D MS | MudPIT | ICAT | RC-MS | Ab Arrays |
|---|---|---|---|---|---|
| Sensitivity | ●●○○○ | ●●●●○ | ●●●●○ | ●●●○○ | ●●●● |
| Direct protein ID? | Yes●●○○○ | Yes●●●●○ | Yes●●●●○ | No○○○○○ | Yes●●●●○ |
| Discovery potential | ●●●○○ | ●●●●● | ●●●●● | ●●●●● | ●○○○○ |
| Quantitative? | Yes | No | Yes | Yes | Yes |
| Serum compatibility, use | ●●●●○ | ●●●○○ | ●●○○○ | ●●●●● | ●●●●○ |
| Information density per sample | ●●○○○ | ●●●●● | ●●●●● | ●●●●○ | ●●○○○ |
| Sample needed per analysis | 100 μg | 100 μg | 100 s μg | μL | 0.5-1 mg |
| Throughput - raw data | ●●●○○ | ●●○○○ | ●●○○○ | ●●●●○ | ●●●●● |
| Throughput - data analysis | ●●●○○ | ●○○○○ | ●○○○○ | ●●●●○ | ●●●●● |
| Ease of use | ●●●○○ | ●●●○○ | ●○○○○ | ●●●○○ | ●●●●○ |
| Uses | Flexible; analyze any sample | More extensive proteome coverage | More extensive proteome coverage | Diagnostic patterns; disease classification | Multianalyte; parallel analysis |
| Commonly used? | Yes | No | No | Yes | No |
MudPIT, multidimensional protein identification technique; ICAT, isotope-coded affinity tagging; RC-MS, retentate chromatography-MS; Ab, antibody; Ab arrays, antibody arrays. Figure modified from ref. [83].
Recently, an antibody-based human protein atlas covering many organs, including four areas of the brain, has been released (www.proteinatlas.org) and is facilitating the advancement of proteomics research [84].
The scientific community is in urgent need of a dedicated protein biomarker analyzer. No technology has yet been successful in comparing disease and control samples and able to report quantitative differences that lead to rapid biomarker identification. Many protein biomarkers of clinical value are present at or below the ng/mL range in plasma and have been inaccessible to date by MS-based methods [85]. IACE has the potential to become a powerful multiplexed platform for biomarkers isolation and characterization. The analyte concentrator containing a miniaturized antibody column is first used to capture all species of molecules that contain the antibody recognition site. Next, the captured substances are eluted off the antibody column directly into the capillary column for separation by one of the several modes of CE. Finally, the separated substances are monitored by one or more detectors, such as a mass spectrometer, which can provide an extremely accurate mass determination of the entire population of captured substances.
5 Usefulness of IACE in the quantification of biomarkers in clinical conditions
The complex and interwoven pathophysiological mechanisms underlying disease make it difficult to uncover biomarkers, particularly biomarkers present at the earliest stages of the disease. Biomarkers detectable at the onset of disease would facilitate immediate treatment and possibly arrest progression of the disease to stages more difficult to treat. In addition, such putative biomarkers would lead to more accurate diagnosis, prognosis monitoring, and a guide to the development of new therapeutic agents and protocols [86-90]. Drug-induced organ injury (e.g., kidney) is a serious and not uncommon adverse event which needs to be considered during drug development. The current standards used to monitor kidney function, such as blood urea nitrogen and serum creatinine, are late indicators of kidney injury and thus do not allow for timely intervention before loss of function. Improving the diagnosis of kidney damage goes hand-in-hand with the identification of new biomarkers, hopefully identified at the very early stage of the toxicity process, and the development of technologies that enable their sensitive and specific measurements [90]. At present, there is no single technique that delivers complete biomarker identification and analysis. A combination of technologies is usually necessary to accomplish the isolation and characterization of a wide range of biomarkers [91-98], including the application of CE-MS [99-105].
A biomarker is by definition a characteristic that is objectively measured and evaluated as an indicator of normal biologic or pathogenic processes or pharmacological responses to a therapeutic intervention [106]. Today, there is an interest in all kinds of biomarkers, encompassing small molecular weight substances to much larger biomolecules, and the entire spectrum in between. Unlike genomic studies where individual changes may have no functional significance, protein expression is closely aligned with cellular activity. An increased understanding of the functional role of proteins/peptides regulating key cell processes will probably have a major impact on health outcomes. Co- and post-translational modifications of proteins/peptides can significantly alter protein/peptide function and thus the characteristics of the cell or tissue in which it is expressed. The low-molecular-weight range of the serum proteome is called the peptidome, and it might contain a rich untapped source of disease-specific diagnostic information [107]. Each modified peptide has the potential to represent an important biomarker. Diagnostic biomarker assay designed for point-of-care will have a dramatic effect on medicine going forward [108-111].
The proteome is the treasure trove for biomarker discovery. It is clear that the enormous complexity and dynamic range in protein concentration (10-5-10-11 M) creates a significant challenge for today's analytical technologies. This vast dynamic range creates a thus far insurmountable challenge to quantify all areas of the range simultaneously. The lowest reaches of this vast dynamic range of protein concentration is most likely to harbor the majority of the yet-undiscovered biomarkers. As a result, strategies to simplify and enrich target proteins in highly complex samples are being developed to dig deep enough into a proteome to characterize biologically important differences [112-117]. Because of the low abundance of the biomarkers, analytical sensitivity is the first challenge for biomarker discovery and routine measurement [24-29, 107].
Functional proteomics is a discipline dedicated to addressing critical needs in the discovery of new drug targets. The development of a single drug costs over $800 million and only less than 30% of the drugs developed are approved. Moreover, few of those that are approved are profitable enough to recover their development costs [118, 119]. Functional proteomics promises to improve target selection and qualification. Thus far, the greater complexity of proteomics relative to genomics has plagued functional proteomics on every front. Technologies capable of sorting through this complexity are the solution to make functional proteomics functional [120-123].
Candidate biomarker discovery typically requires identifying proteins found at extremely low concentrations. Often, these ultra-low-concentration proteins are masked by highly abundant proteins, such as the albumin found in blood samples [107]. In fact, researchers have found it challenging to develop ultra-sensitive detection methods that have a large dynamic range, which is the capability to measure both very large and very small protein amounts simultaneously. Also difficult, has been the task of “capturing” dilute proteins in complex mixtures. Even in the absence of interfering proteins, some candidate biomarkers are just too dilute to be measured by many conventional techniques and therefore go undiscovered. In addition, many of the best techniques for finding low-abundance biomarker candidates are not quantitative; that is, they can determine whether the protein is present or not, but not measure its concentration (Conrad, D., Nanotechnology-Based Assays for Validating Protein Biomarkers, http://www.nsti.org/news/item.html?id=140). Moreover, it must be taken into consideration that the level of individual blood-borne biomarkers can be greatly influenced by various nondisease related epidemiological factors and normal physiological conditions [107]. Therefore, capturing the “right” single biomarker or a panel of biomarkers in a constantly fluctuating environment may lead to erroneous conclusions. Consequently as with any biomarker discovery (single or as a panel), great care is needed to reduce sample bias during the discovery and validation phase of proteomics/peptidome biomarker translational research.
In order to solve such a challenging problem of isolating and concentrating perhaps the most valuable biomarkers, new platforms need to be developed. Such platforms must include capturing ligands, such as antibodies and their fragments, antigens, fused proteins, DNA/RNA aptamers, peptides, sugars, lipids, molecular imprinted polymers (MIPs) lectins, membranes, cellular and noncellular particles and subparticles, small molecules, etc. [24, 26-29, 158, 174, 175].
Nanotechnology-based versions of IACE are emerging as well, and they may become the next generation of diagnostic assays. Microchip technology has powerful microfluidic capabilities, allowing the transfer, mixing, and placement of reagents, as well as infinite multiplexing features [8-12, 124-128]. These capabilities coupled with affinity capture, ultra-high efficiency separations, and high-sensitivity direct protein measurements make nanotechnology-based IACE the obvious final format for IACE [24, 26, 27, 29, 129-138]. Some important applications have been reported using panels of antibodies immobilized into a single channel of a microchip [24]. The panels of antibodies were used in a single analysis, thus enabling the isolation and measurement of multiple analytes within the same sample. When monitoring clinical manifestations such as inflammation, the ability to measure multiple analytes becomes a distinct advantage. Careful immunochemical analysis of each antibody used to prepare the analyte capture array greatly improved the efficiency of the system. Matching the affinity association and dissociation constants ensured that (i) all analytes would bind within a given time frame and (ii) that the captured analytes would be dissociated from their captured antibodies in a similar manner. The purpose of this protocol was to guarantee that approximately equal capture and release would occur for all the analytes of interest within a given time [24]. The immobilized antibodies served both as selective capture ligands and as preanalysis clean up in the analysis of biomarkers present in complex biological matrices such as tissue extracts. However, this extensive immunochemistry is time-consuming and although essential, it considerably lengthens the preparation time required for successful IACE.
Figure 4 shows the electrophoretic profiles of inflammatory biomarkers in patients suffering from mild and chronic skin lesions. The patient samples demonstrated the presence of two distinct subclasses of biomarkers; one with relatively high concentrations of interleukin-1 beta (IL-1-β), IL-8, tumor necrosis factor-alpha (TNF-α), and substance P (SP), while the other demonstrated lower concentrations of these biomarkers, but still significantly higher than levels in the control samples. This subclassification was further proven when they were compared to the results obtained by classical histopathology (see ref. [24]). One interesting observation during the course of these studies was that the IACE technology was able to measure not only all of the analytes of interest, but also to show different patterns according to the proximity of the microdissected sample to the actual pathological lesion (see Table 2).
Figure 4.
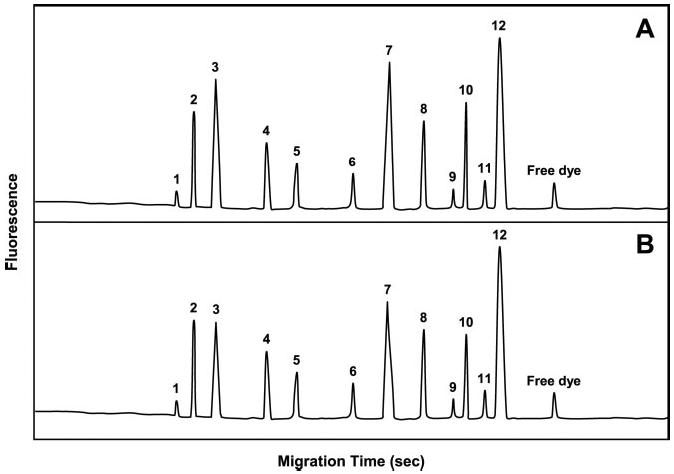
Electropherograms demonstrating biomarker concentrations in mild versus chronic skin lesions. (A) Typical electropherogram of biomarker concentrations recovered from a patient with chronic lesions. (B) Typical electropherogram of biomarker concentrations recovered from a patient with mild lesions. The peaks in the electropherogram resolved in the following order: 1, transforming growth factor beta (TGF-β); 2, interleukin 6 (IL-6); 3, IL-1-β; 4, interferon gamma (IFN-γ); 5, macrophage inflammatory protein 1 alpha (MIP-1-α); 6, macrophage chemoattractant protein 1 alpha (MCP-1); 7, TNF-α; 8, calcitonin gene-related peptide (CGRP); 9, neuropeptide Y (NY); 10, IL-8; 11, vasoactive intestinal peptide (VIP); 12, SP. A small peak of free dye was always present in the electropherogram. Figure modified from ref. [24].
Table 2.
Microchip-based IACE analysis of inflammatory biomarkers in three distinct tissue areas within the clinical biopsiesa)
| Analyte | Perivascular lesion | 5 mm from lesion | 15 mm from lesion |
|---|---|---|---|
| IL-1-α | 372.9 ± 51.3 | 116.9 ± 38.7 | 62.4 ± 21.3 |
| IL-6 | 167.8 ± 42.7 | 111.6 ± 36.9 | 53.8 ± 35.5 |
| IL-8 | 135.9 ± 26.4 | 27.2 ± 10.5 | 8.6 ± 2.4 |
| TNF-α | 427.8 ± 61.3 | 236.8 ± 45.7 | 160.2 ± 40.5 |
| IFN-γ | 118.6 ± 28.7 | 82.7 ± 36.4 | 23.3 ± 10.6 |
| TGF-β | 32.6 ± 15.4 | 8.8 ± 2.5 | 4.7 ± 1.8 |
| MIP-1-α | 85.8 ± 32.7 | 39.2 ± 10.5 | 11.3 ± 3.5 |
| MCP-1 | 62.9 ± 33.6 | 21.5 ± 13.1 | 8.4 ± 2.7 |
| SP | 511.6 ± 39.8 | 313.8 ± 47.6 | 245.5 ± 56.3 |
| CGRP | 97.9 ± 40.5 | 30.4 ± 41.1 | 18.8 ± 26.6 |
| NY | 32.3 ± 25.4 | 16.2 ± 8.5 | 9.7 ± 2.8 |
| VIP | 42.8 ± 20.6 | 7.3 ± 2.2 | 3.8 ± 2.1 |
All values represent the mean of 25 samples ± SEM. All values are expressed in ng/mL Table modified from ref. [24].
6 Other immunoaffinity capillary electrophoresis applications
Guzman et al. first reported IACE in 1990 and 1991 [39, 40, 129]. Since then, numerous applications have been published using immobilized antibodies as affinity ligands [24-29, 41-46, 49, 54, 55, 130-138]. Phillips and coworkers [139-150] have also been important pioneers in the field of IALC and IACE. Numerous applications employing IALC or IACE include potentially useful clinical-diagnosis-prognosis tests [24, 26-29, 39-46, 151]. In addition to the use of immobilized antibodies as affinity ligands on-line with CE and microchip technology, other selective and nonselective ligands have been used for the enrichment and purification of a wide range of compounds [13, 17, 29, 51, 152, 158-163] (see Table 3). Typical examples of IACE and IALC are presented in Figs. 5-7.
Table 3.
Applications on the molecular interaction, enrichment, cleaning, separation, and characterization of a wide range of analytes using IACE, immunoaffinity CEC (IACEC), IALC, and nonantibody affinity-capture CE (NAACE), such as lectin ACE (LACE), enzyme ACE (EACE), aptamer ACE (AACE), and immobilized metal chelate ACE (IMACE)
| Immobilized affinity ligand | Captured affinity target | Year | Reference |
|---|---|---|---|
| m-Antibodya) | Methamphetamine (urine) | 1990,1991,1993 | [39-41, 49, 129] |
| Protein G | IgG (serum, standard solution) | 1991, 1995, 2005, 2007 | [51, 129, 151-153] |
| Ribonuclease T1, hexokinase, adenosine deaminase | Ribonucleic acids | 1992 | [176] |
| m-Antibody | Cyclosporin (tears) | 1994 | [54] |
| p-Antibody | IgE (serum) | 1995 | [131] |
| Trypsin | Protein digestion (standard solution) | 1996 | [132] |
| p-Antibody | FITC (derivatization of peptides) | 1996 | [132] |
| m-Antibody | Atrazine (standard solution) | 1996 | [154] |
| m-Antibody | Peptides (microdialysis) | 1997 | [145] |
| p-Antibody | IgG (standard solution) | 1997 | [155] |
| Con A | Glycopeptides (urine) | 1997 | [29] |
| m-Antibody | Cytokines (body fluids) | 1998 | [146] |
| p-Antibody | Cardiac troponin I (serum) | 1998 | [156] |
| p-Antibody | FITC-biotin (urine) | 1999 | [157] |
| p-Antibody | Gonadotropin-releasing hormone (serum, urine) | 2000 | [46] |
| p-Antibody | Neuropeptides (astrocytes) | 2003 | [149] |
| p-Antibody | Neuropeptides and anti-inflammatory drugs (urine) | 2003 | [136] |
| m-Antibody | Cytokines (cerebrospinal fluid) | 2004 | [150] |
| DNA-Aptamer | Thrombin (standard solution) | 2006 | [158] |
| Metal | Phosphopeptide (standard solution) | 2006 | [159] |
| Protoporphyrin | Angiotensin (standard solution) | 2007 | [52] |
| m-Antibody | C-Reactive protein (serum, cerebrospinal fluid) | 2008 | [177] |
m-Antibody, monoclonal antibody; p-Antibody, polyclonal antibody. For nonselective ACEACE applications (e.g., use of C-4, C-8, C-18 as the immobilized ligand to the analyte concentrator) see refs. [13, 17, 29, 45, 160-162]. This Table represents only a selected number of references. For further information on IACE, IALC, or other affinity interactions, see refs. [10, 13, 25-29, 42-46, 130-151, 163, 178-205].
Figure 5.
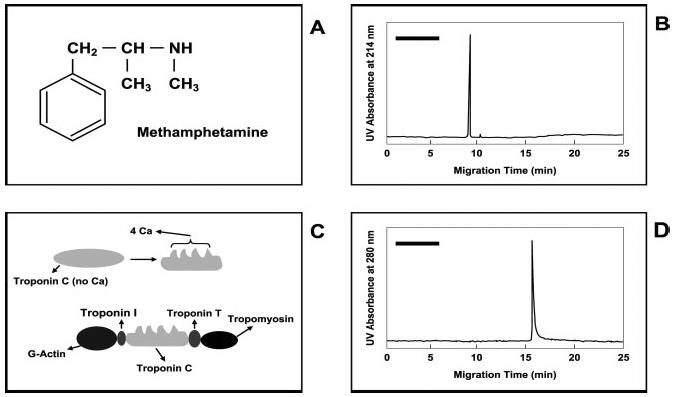
Determination of amphetamine (A) and cardiac troponin I (C) by IACE. (B) Shows an electropherogram of immunoaffinity-captured methamphetamine from a urine specimen. (D) Shows an electropherogram of immunoaffinity-captured troponin I from a serum specimen. The black bars in the upper left side of (B) and (D) represent a potential area where the components of the elution buffer may appear when using UV detection. If the target analytes carry a fluorescent label, no peaks will be observed when using fluorescence detection, except those representing the fluorescence-labeled analytes. Figure modified from refs. [39, 40, 156].
Figure 7.
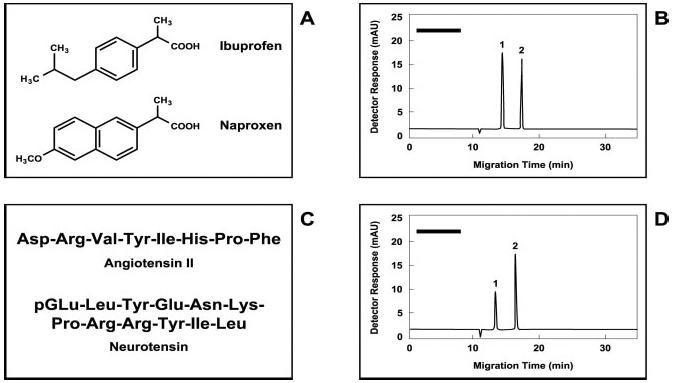
IACE studies of small-molecular-weight analytes present in urine specimens. Molecular structures of (A) the acidic drugs ibuprofen and naprofen, and (C) the neuropeptides angiotensin II and neurotensin. (B) Electropherogram of ibuprofen (1) and naproxen (2), extracted by immunoaffinity-bead technology from an aliquot of a diluted urine specimen. (D) Electropherogram of angiotensin II (1) and neurotensin (2) extracted by immunoaffinity-bead technology from a second aliquot of the same diluted urine used in (B). The urine sample used in this experiment was diluted 1:1 with 50 mM sodium tetraborate buffer, pH 9.0. The amount of sample introduced into the micro-extraction device was approximately 1 mL, a sufficient volume of solution containing enough analyte to saturate the binding sites of the immobilized antibody fragments directed against each tested analyte. In these experiments, the concentration of each analyte in the samples was 5 ng/mL. The black bars in the upper left side of (B) and (D) represent a potential area where the components of the elution buffer may appear when using UV detection. If the target analytes carry a fluorescent label, no peaks will be observed when using fluorescence detection, except those representing the fluorescence-labeled analytes. Figure modified from ref. [136].
Many more IACE applications have been reported in the literature (see references in Table 3 for specific analytes). Noteworthy is the work of Yang et al. [164], which used membranes as a sieving mechanism instead of employing affinity-capturing principles. These investigators were able to enrich and purify albumin and ovalbumin present in a complex mixture by CE (see Fig. 8). The signal enhancement was of 550-fold.
Figure 8.
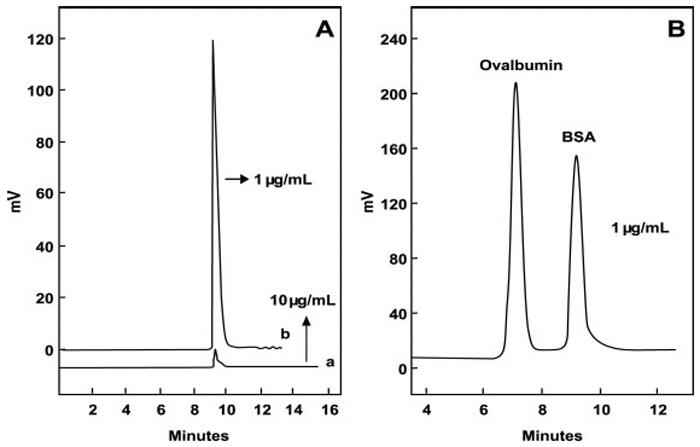
On-line preconcentration of proteins in CE employing an end-column cellulose acetate-based porous membrane as a sieving trapping system. When the protein is concentrated into the membrane, the electric field is switched and the trapped BSA is separated by CZE. (A) Electropherogram of BSA utilized as a model protein employing an electrokinetic sample introduction procedure without the use of the on-line membrane preconcentration method, at a concentration of 10 μg/mL of BSA (a); and when using the on-line porous cellulose acetate membrane preconcentration method at a concentration ten-fold diluted (1 μg/mL) (b). (B) Electropherogram depicting the separation of BSA and ovalbumin mixture at a concentration of 1 μg/mL each, employing the cellulose acetate membrane preconcentration method. Figuremodified from ref. [164].
Although many applications have been developed using selective (IACE) and nonselective (nsIACE) ligands on-line with CE, the preferred and practical way of carrying out the technology, was and still is, using a single capillary. The main reason of this procedure is that almost every user in CE has a commercial instrument designed to use a single capillary. Most multicapillary instruments have been fabricated for DNA analysis, primarily DNA sequencing.
7 Fabrication of an analyte concentrator
Since there are no commercially available analyte concentrators, they must be fabricated by the user. At this moment, this is a disadvantage of the IACE technique, and it is important to describe the various analyte concentrator fabrication designs and approaches that have been employed in several laboratories involved in preconcentration research. Traditionally, the analyte concentrator-microreactor device was fabricated by incorporating free-floating beads held in position by frits into the instrument capillary; usually the location of the device was just ahead of the inlet of the capillary [40, 41, 49, 129, 161]. In the first attempts to fabricate a functional analyte concentrator-microreactor device, one or two frit structures were used to maintain floating beads within a small restricted space, e.g., 1-3 mm in length and 75-150 μm id. The entire process of fabrication was monitored using a stereo-microscope [39-46]. However, the frit-based designs had a number of drawbacks, which included high backpressure, and when the frit-dependent analyte concentrator was coupled to longer capillaries the sample injection time was longer than usual. Additionally, in some cases the frits were able to bind sample components irreversibly. Furthermore, when complex biological matrices were used, many analytes were tightly bound to the free silanol groups present in the inner wall of the fused-silica separation capillary or separation microchip channel (this is the area after the analyte concentrator-microreactor). Therefore, after successive sample introduction, there was an increase adsorption of sample components to the free-silanol groups leading to a poor recovery and poor reproducibility.
Such problems inherent with frits prompted attempts to fabricate analyte concentrators without frits. Frit-free analyte concentrators have been fabricated using different designs: (i) those in which the beads used are smaller than the inner diameter of the capillary employed to generate the analyte concentrator device, but larger than the separation capillary, thus trapping the beads by constriction [17, 29, 49, 50, 137, 138]; (ii) those that use membranes impregnated with non-selective affinity ligands [42, 43, 47, 133]; (iii) those that use magnetic particles bound to affinity ligands and held in position by an external magnet [53, 155, 165]; (iv) those that use sol-gel polymeric structures [29, 45]; (v) those containing polymeric monolithic structures [29, 45, 51, 52, 166-168]; and (vi) those without any supporting structure, in which the affinity ligands are bound directly to the inner wall of a single capillary or a single channel [54, 55, 154], or to a multibore capillary containing multiple inner walls of multiple smaller capillaries [29, 131, 133]. Some examples of the frit-containing and frit-free concentrators are shown in Figs. 1 and 2. These figures illustrate various analyte-concentrator designs coupled to a single capillary and employing a custom built or a commercial CE instrument designed for the use of only one capillary. This major improvement (minimization of pressure resistance caused by frits) has been achieved for the fabrication of a CE instrument using a single frit-free analyte concentrator device. A frit-free design has only once been reported where a CE instrument employs an analyte concentrator made of a multibore capillary containing multiple smaller capillaries [29, 131, 133].
A 2-D design for the analyte concentrator-microreactor was invented in order to introduce the sample through means other than the separation capillary or channel. This new design requires two tubes; one is used for sample introduction and analyte concentrator flushing, and other for sample separation. At the intersection of the sample introduction tube and the sample separation tube is the area occupied by the analyte concentrator-microreactor. The sample introduction tube was termed the “transport passage” and represents a “transport tube” or “transport capillary” or a “transport channel”. Normally, the transport capillary is made of solid polymeric material (e.g., PEEK tubing) and intersects in a cruciform configuration with one or more of the separation capillaries or separation channels made of fused-silica, glass, Teflon®, or other suitable materials used in microfluidic devices [136-138].
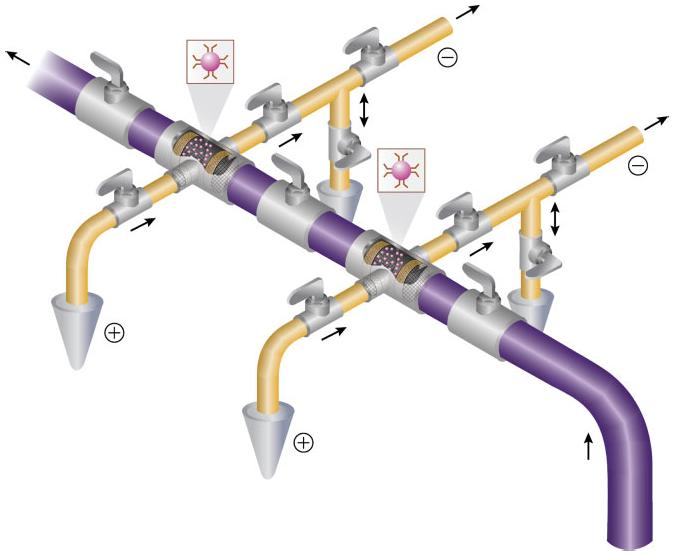
The analyte concentrator-microreactor device originally was designed as a cross, containing two entrance and two exit ports. Accordingly, it was termed the “cruciform configuration” analyte concentrator device. Eventually, a second, slightly different, design was created, which was termed the “staggered” or “zigzag” configuration [138, 169]. This new design also has two entrance and two exit ports, but the area containing the solid support containing immobilized antibodies or other affinity ligands has significantly more surface area than that of the cruciform configuration, and consequently it has the capacity to capture much more material. Figure 9 depicts model systems using the two designs.
Figure 9.
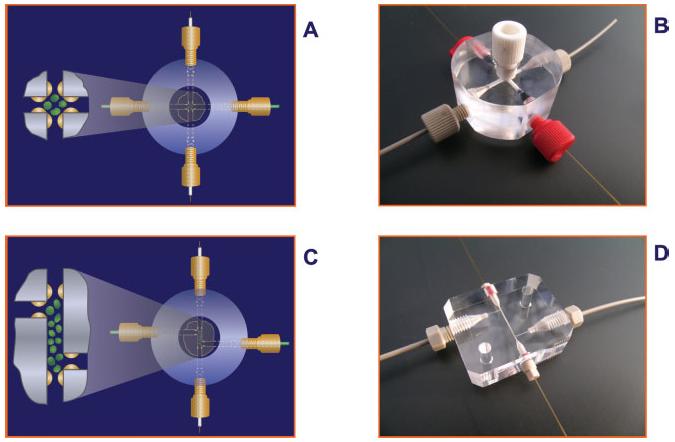
Schematic representation of the two designs of analyte concentrator devices. (A and B) Represents the cruciform configuration, and (C and D) represents the staggered or zigzag configuration. Figure modified from refs. [138, 169].
The cruciform and staggered configurations have a number of advantages when compared to the classical monodimensional analyte concentrator (sample introduction is in the same direction of sample elution and sample separation). The 2-D configuration of the cruciform and staggered designs permits the sample to be introduced into the analyte concentrator in one direction, and the process of elution and separation is in another direction. The transport passage that is made of PEEK tubing is usually much larger in internal diameter (typically 150-400 μm) than the fused-silica capillary (typically 50, 75, and 100 μm). Microchip channels are much smaller; still the transport channel can have a greater diameter than the separation channel. Although it is possible to use four frits for the cruciform and staggered configurations (one for each inlet and outlet), it is much convenient to trap beads by constriction. As expected, there is minimal backpressure during sample introduction into the analyte concentrator device because the distance between the inlet to the outlet is only 1-4 cm in the 2-D configuration rather than 20-60 cm in the monodimensional arrangement for the analyte concentrator. The internal diameter of the transport passage is also very large, allowing a continuous and uniform introduction of fluid into the analyte concentrator device. The volume of sample introduced into the device ranges from a few microliters to several milliliters.
The surface area of the staggered configuration permits several-fold concentration enhancement compared to the cruciform configuration [169]. Accordingly, it is not necessary to incubate the antigen-antibody for hours as required by the ELISA method; usually a few minutes is sufficient. In most cases, 5-10 min of incubation is more than enough to obtain maximum binding.
It is also possible to employ a series of several cruciform or staggered configurations creating a multidimensional system (see Fig. 10).
Figure 10.
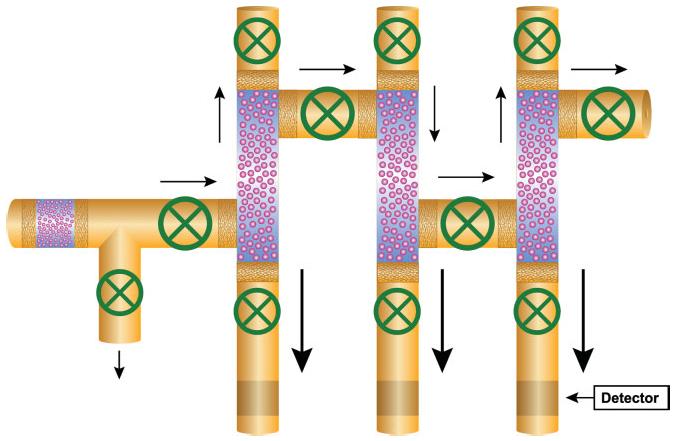
Diagrammatic representation of a multidimensional CE system equipped with an analyte concentrator-microreactor in each intersection of the transport passage and a separation capillary. In this case, the analyte concentrator has a staggered or zigzag configuration. All small arrows represent the direction of the sample introduction or the flushing buffer to remove unbound material. The larger arrows represent the direction of sample elution and sample separation. The smaller arrow in the lower right side represents the area of the location of the detector (the detector is usually located only a few centimeters from the inlet in microchip instrument, to several centimeters in conventional CE instrument). The green circles represent valves to control the direction of the flow. Figure modified from refs. [138, 169].
8 Multicapillary high-throughput IACE instrument
As the frontiers of biomedical science continue to expand, instrument developers around the world are seeking innovative new technologies for processing and analyzing biological samples. Research and diagnostic laboratories are always in need of better tools with which to generate more accurate, more informative, and more reliable data. Equally important today, these laboratories are driven by economics and need to generate this superior data faster and cheaper. These objectives cannot be achieved without automation and multiplexing. Automation and multiplexing are essential to offset the costs of the improved data via operating costs (e.g., labor, reassay, etc.). It is expected that the improved technological features of a multiplex instrument will generate a product of high quality, great functionality, superb assay performance, and favorable cost effectiveness.
Several multi-CE instruments are currently available commercially [170, 171], but none are equipped with analyte concentrators. Figure 10 shows a schematic representation of a three-capillary, high-throughput instrument fitted with three analyte-concentrator devices in the staggered configuration, each designed to have a greater surface area than previously designed concentrator devices. Many more capillaries or channels can be implemented in this configuration, creating a high-throughput platform. This instrument is intended primarily for the capturing of low-abundance biomarkers but can also be used for high-abundance material, or for capturing high- and low-abundance biomarkers simultaneously.
This in-series analyte concentrator device design permits the fabrication of a series of mountable cartridges that could be easily removed and replaced by other cartridges. For example, one mountable cartridge could be specific for the quantification of a number of biomarkers targeted to measure inflammation in the liver (“a so-called, liver cartridge device”). Another mountable cartridge could specifically quantify biomarkers of the pancreas (“a pancreas cartridge device”). There are numerous of possibilities to target the quantification of very specific biomarkers for many diseases and toxic conditions.
Another important feature to be considered in the manufacturing of a multiplex platform containing multiple-analyte concentrators-microreactors with the appropriate valves is to create controllable microenvironments. These microenvironments will lead to a better optimization of the antibody-antigen binding, release of the antigen from the immobilized antibody, and separation of the released enriched antigens in the best buffer for separation. In many instances the buffer for binding the antigen to the antibody is different from the buffer for separation of antigens of interest. Figure 11 shows a schematic of the auxiliary tube designed to have a separation capillary divided into two areas. The shorter area located near the inlet of the capillary contains the analyte concentrator-microreactor device. The longer area is actually where the separation of the released substances from the immobilized antibody occurs. The shorter capillary will contain the best binding buffer (usually greater than pH 7.0) to facilitate the binding of the antibody to the antigen. The separation capillary, referred to as the larger portion of the entire capillary, will have the best separation buffer (usually with a pH less than 7.0 and with or without the presence of additives that may help to improve resolution). The auxiliary tube provides the separation buffer and is connected by a valve at a point between the short and large parts of the capillary.
Figure 11.
Schematic representation of multidimensional design containing a series of multiple analyte concentrator-microreactor devices and auxiliary tubes. The arrows indicate the direction of the sample, flushing buffer, or separation. The double arrow indicates that the auxiliary tube can be used as an outlet or an inlet section of the tube. Figure modified from ref. [138].
9 Concluding remarks
Biomarkers have moved beyond their use merely to assuage scientific curiosity. They are investigated across many biological fields to use as indicators of diseases states in diagnostics, provide targets for therapeutic intervention in the pharmaceutical industry, provide indicators of crop qualities within the agricultural field, or as quality-control markers for the food industry. In the pharmaceutical industry, biomarkers are increasingly being used to answer specific questions that provide critical decision-support data as a compound moves down the pipeline. Compound efficacy, specificity, accuracy, and in vivo relevance are key drivers in the decision-making process for progressing drug candidates through the lead-optimization phase into clinical trials ([172], McCormick, T., Martin, K., Hehenberger, M., The evolving role of biomarkers. http://www-03.ibm.com/industries/healthcare/doc/content/bin/G510-6640-00_Biomarkers.pdf). Biomarkers are being used to measure clinical response to a drug, to quantify drug-target interactions, to demonstrate the relevance of a molecule to the pathophysiology of a particular disease, and as safety indicators that can identify subjects who might react adversely to a drug [173].
The major problem in biomarker discovery is the presence of high abundance proteins in most samples, which act as screens for the lower abundance proteins, peptides, and/or metabolites often of interest as biomarkers. It is a major challenge for the proteomics field to devise strategies for the investigation of the extremely low-abundance substances, which are so often of interest to researchers. Low-abundance biomarkers are of crucial importance in the diagnostic and pharmaceutical industry, and in the coming years we predict that IACE will become a significant and indispensable research-diagnostic tool to isolate and quantify important disease-toxicity-related biomarkers. The functionality of IACE is based on four independent but strongly related technologies (surface chemistry, detection methods, capture agents, and high-throughput instrumentation). First, a variety of surface-modification methodologies are now widely available and offer site-specific immobilization of capture agents onto surfaces in such a way as to retain the native conformation and activity. Second, sensitive, parallel detection apparatuses are being developed to provide highly engineered platforms for simultaneous data acquisition. Third, in the development of capture agents, antibodies are now probably the most prominent capture agents for analyzing protein abundances. However, alternative scaffolds, such as phage-displayed antibody and protein fragments, which provide the advantage of increasing diversity of capture agents are under development. Antibody engineering is entering a new phase, moving from mouse to humanized and fully humanized antibodies. Novel technologies such as de novo generation of human antibodies, engineering techniques to increase antigen affinity, and production of antibody fragments are replacing standard methodologies [174, 175]. Recombinant antibody fragments are expected to capture a significant share of the $6 billion (US) per year diagnostic market, from in vitro immunoassays to in vivo tumor- and clot-imaging applications [175].
9.1 Future prospects of IACE
High-throughput screening is a key link in the chain comprising the industrialized drug discovery paradigm. Today, many pharmaceutical companies are screening 100 000-300 000 or more compounds per screen to produce approximately 100-300 hits. On average, one or two of these hits become lead compound series. Larger screens of up to 1 000 000 compounds carried out over several months may be required to generate an outcome closer to five leads. Improvements in lead generation can also come from optimizing library diversity. Limited success has been achieved to date in this endeavor.
The multidimensional IACE instrumentation has the potential to make a significant contribution to drug discovery. A wide range of affinity ligands can be immobilized in the analyte concentrators with the object of capturing putative affinity target substances present in simple or complex matrices. The concept of immobilizing cell receptors for measuring bioavailability of drugs adds a new dimension to existing drug discovery and monitoring. IACE has the potential not only to analyze drug binding to a single receptor, but also to examine the binding of racemic forms of the drug to different receptors. In this way, not only would potentially crossreactive side-effects be avoided, but potential new uses for established drugs could be discovered.
Figure 6.
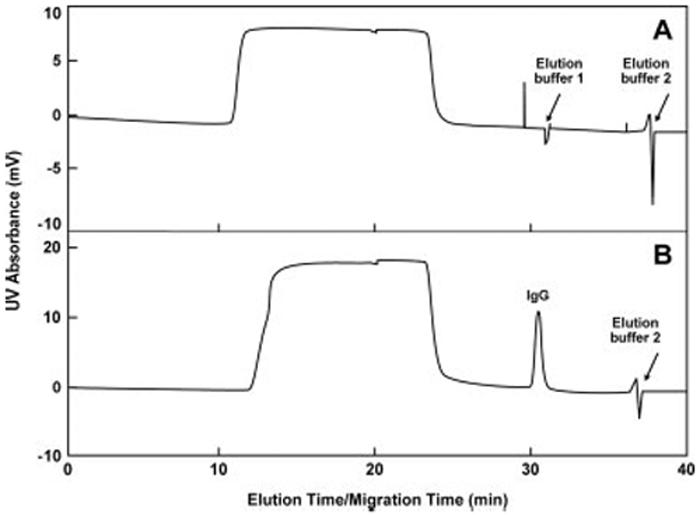
Schematic representation demonstrating the specificity of the immunoaffinity capillary LC technology. Protein G was immobilized on a monolithic column that constitutes the core of an analyte concentrator in a capillary coupled to a CE instrument, but functioning only under mechanical pressure conditions and not electrophoresis conditions. Four proteins were tested for the binding specificity to protein G: cytochrome C, lysozyme, trypsinogen A, and IgG. (A) Represents the chromatographic profile when only cytochrome C, lysozyme, and trypsinogen A were applied to the affinity column. Since none of these proteins have affinity for protein G, they did not bind to the affinity column and were present in the flow-through of the column. In contrast, (B) represents the chromatographic profile of all four proteins applied to the column. Since IgG has binding specificity to protein G, it was demonstrated that only IgG binds selectively to protein G in the presence of cytochrome C, lysozyme, and trypsinogen A. The arrows shown in the figure represent the two buffer conditions tested for elution of the bound compounds. In this case, only IgG was bound and eluted to and from the affinity column. Figure modified from ref. [51].
Abbreviations
- IACE
immunoaffinity CE
- IALC
immunoaffinity LC
- IL-1-β
interleukin-1 beta
- MudPIT
multidimensional protein identification technique
- SP
substance P
- TNF-α
tumor necrosis factor-alpha
Footnotes
The authors have declared no conflict of interest.
10 References
- [1].Hsieh Y, Fukuda E, Wingate J, Korfmacher WA. Comb. Chem. High Throughput Screen. 2006;9:3–8. doi: 10.2174/138620706775213895. [DOI] [PubMed] [Google Scholar]
- [2].Gilpin RK, Pachla LA. Anal. Chem. 2005;77:3755–3770. doi: 10.1021/ac050580o. [DOI] [PubMed] [Google Scholar]
- [3].Saz JM, Marina ML. J. Sep. Sci. 2007;30:431–451. doi: 10.1002/jssc.200600247. [DOI] [PubMed] [Google Scholar]
- [4].Cserhati T, Forgacs E, Deyl Z, Miksik I. Biomed. Chromatogr. 2005;19:183–190. doi: 10.1002/bmc.486. [DOI] [PubMed] [Google Scholar]
- [5].Vogeser M. Clin. Chem. Lab. Med. 2003;41:117–126. doi: 10.1515/CCLM.2003.020. [DOI] [PubMed] [Google Scholar]
- [6].Smyth WF, Brooks P. Electrophoresis. 2004;25:1413–1446. doi: 10.1002/elps.200305850. [DOI] [PubMed] [Google Scholar]
- [7].Narayan SS, Venkatakrishna-Bhatt H. J. Occup. Health. 2004;46:82–86. doi: 10.1539/joh.46.82. [DOI] [PubMed] [Google Scholar]
- [8].Whitesides GM. Nat. Biotechnol. 2003;21:1161–1165. doi: 10.1038/nbt872. [DOI] [PubMed] [Google Scholar]
- [9].Hansen C, Quake SR. Curr. Opin. Struct. Biol. 2003;13:538–544. doi: 10.1016/j.sbi.2003.09.010. [DOI] [PubMed] [Google Scholar]
- [10].Křenková J, Foret F. Electrophoresis. 2004;25:3550–3563. doi: 10.1002/elps.200406096. [DOI] [PubMed] [Google Scholar]
- [11].Gourley PL. Biotechnol. Prog. 2005;21:2–10. doi: 10.1021/bp0498239. [DOI] [PubMed] [Google Scholar]
- [12].Dittrich PS, Manz A. Nat. Rev. Drug. Discov. 2006;5:210–218. doi: 10.1038/nrd1985. [DOI] [PubMed] [Google Scholar]
- [13].Breadmore MC. Electrophoresis. 2007;28:254–281. doi: 10.1002/elps.200600463. [DOI] [PubMed] [Google Scholar]
- [14].Imami K, Monton MRN, Ishihama Y, Terabe S. J. Chromatogr. A. 2007;1148:250–255. doi: 10.1016/j.chroma.2007.03.014. [DOI] [PubMed] [Google Scholar]
- [15].Sobhani K, Michels DA, Dovichi NJ. Appl. Spectrosc. 2007;61:777–779. doi: 10.1366/000370207781393208. [DOI] [PubMed] [Google Scholar]
- [16].Zamfir AD. J. Chromatogr. A. 2007;1159:2–13. doi: 10.1016/j.chroma.2007.03.115. [DOI] [PubMed] [Google Scholar]
- [17].Saavedra L, Barbas C. J. Biochem. Biophys. Methods. 2007;70:289–297. doi: 10.1016/j.jbbm.2006.11.005. [DOI] [PubMed] [Google Scholar]
- [18].Viskari PJ, Landers JP. Electrophoresis. 2006;27:1797–1810. doi: 10.1002/elps.200500565. [DOI] [PubMed] [Google Scholar]
- [19].Johnson ME, Landers JP. Electrophoresis. 2004;25:3513–3527. doi: 10.1002/elps.200406086. [DOI] [PubMed] [Google Scholar]
- [20].Lin C-H, Kaneta T. Electrophoresis. 2004;25:4058–4073. doi: 10.1002/elps.200406172. [DOI] [PubMed] [Google Scholar]
- [21].Ptolemy AS, Britz-McKibbin P. J. Chromatogr. A. 2006;1106:7–18. doi: 10.1016/j.chroma.2005.11.012. [DOI] [PubMed] [Google Scholar]
- [22].Guijt RM, Evenhuis CJ, Macka M, Haddad PR. Electrophoresis. 2004;25:4032–4057. doi: 10.1002/elps.200406156. [DOI] [PubMed] [Google Scholar]
- [23].Vandaveer WR, IV, Pasa-Farmer SA, Fischer DJ, Frankenfeld CN, Lunte SM. Electrophoresis. 2004;25:3528–3549. doi: 10.1002/elps.200406115. [DOI] [PubMed] [Google Scholar]
- [24].Phillips TM, Wellner EF. Electrophoresis. 2007;28:3041–3048. doi: 10.1002/elps.200700193. [DOI] [PubMed] [Google Scholar]
- [25].Amundsen LK, Sirén H. Electrophoresis. 2007;28:99–113. doi: 10.1002/elps.200500962. [DOI] [PubMed] [Google Scholar]
- [26].Guzman NA, Stubbs RJ, Phillips TM. Drug Discov. Today: Technol. 2006;3:29–37. doi: 10.1016/j.ddtec.2006.03.009. [DOI] [PubMed] [Google Scholar]
- [27].Guzman NA, Phillips TM. Anal. Chem. 2005;77:61A–67A. doi: 10.1021/ac053325c. [DOI] [PubMed] [Google Scholar]
- [28].Guzman NA. Anal. Bioanal. Chem. 2004;378:37–39. doi: 10.1007/s00216-003-2326-y. [DOI] [PubMed] [Google Scholar]
- [29].Guzman NA, Stubbs RJ. Electrophoresis. 2001;22:3602–3628. doi: 10.1002/1522-2683(200109)22:17<3602::AID-ELPS3602>3.0.CO;2-X. [DOI] [PubMed] [Google Scholar]
- [30].Kašičká V, Prusik Z. J. Chromatogr. 1983;273:117–128. doi: 10.1016/s0378-4347(00)80928-7. [DOI] [PubMed] [Google Scholar]
- [31].Kašičká V, Prusik Z. J. Chromatogr. 1985;320:81–88. doi: 10.1016/s0021-9673(01)90482-0. [DOI] [PubMed] [Google Scholar]
- [32].Phillips TM, More NS, Queen WD, Thompson AM. J. Chromatogr. 1985;327:205–211. doi: 10.1016/s0021-9673(01)81650-2. [DOI] [PubMed] [Google Scholar]
- [33].Phillips TM, Queen WD, More NS, Thompson AM. J. Chromatogr. 1985;327:213–219. doi: 10.1016/s0021-9673(01)81651-4. [DOI] [PubMed] [Google Scholar]
- [34].Phillips TM. Adv. Chromatogr. 1989;29:133–173. [PubMed] [Google Scholar]
- [35].Farjam A, Vreuls JJ, Cuppen WJGM, Brinkman U. A. Th., de Jong GJ. Anal. Chem. 1991;63:2481–2487. doi: 10.1021/ac00021a017. [DOI] [PubMed] [Google Scholar]
- [36].Tozzi C, Giraudi G. Curr. Pharm. Des. 2006;12:191–203. doi: 10.2174/138161206775193082. [DOI] [PubMed] [Google Scholar]
- [37].Clonis YD. J. Chromatogr. A. 2006;1101:1–24. doi: 10.1016/j.chroma.2005.09.073. [DOI] [PubMed] [Google Scholar]
- [38].Waugh DS. Trends Biotechnol. 2005;23:316–320. doi: 10.1016/j.tibtech.2005.03.012. [DOI] [PubMed] [Google Scholar]
- [39].Guzman NA, Trebilcock MA, Advis JP. Paper presented at the First Annual Conference on Capillary Electrophoresis; Frederick, Maryland. October 15-16. 1990; Abstract no. 12. [Google Scholar]
- [40].Guzman NA, Trebilcock MA, Advis JP. J. Liq. Chromatogr. 1991;14:997–1015. [Google Scholar]
- [41].Guzman NA. J. Liq. Chromatogr. 1995;18:3751–3768. [Google Scholar]
- [42].Tomlinson AJ, Guzman NA, Naylor S. J. Capill. Electrophor. 1995;2:247–266. [PubMed] [Google Scholar]
- [43].Tomlinson AJ, Benson LM, Guzman NA, Naylor S. J. Chromatogr. A. 1996;744:3–15. [Google Scholar]
- [44].Guzman NA, Park SS, Schaufelberger D, Hernandez L, et al. J. Chromatogr. B. 1997;697:37–66. doi: 10.1016/s0378-4347(97)00275-2. [DOI] [PubMed] [Google Scholar]
- [45].Heegaard NHH, Nilsson S, Guzman NA. J. Chromatogr. B. 1998;715:29–54. doi: 10.1016/s0378-4347(98)00258-8. [DOI] [PubMed] [Google Scholar]
- [46].Guzman NA. J. Chromatogr. B. 2000;749:197–213. doi: 10.1016/s0378-4347(00)00410-2. [DOI] [PubMed] [Google Scholar]
- [47].Yang Q, Tomlinson AJ, Naylor S. Anal. Chem. 1999;71:183A–189A. doi: 10.1021/ac990246q. [DOI] [PubMed] [Google Scholar]
- [48].Strausbauch MA, Xu SJ, Fergunson JE, Nunez ME, et al. J. Chromatogr. A. 1995;717:279–291. doi: 10.1016/0021-9673(95)00743-6. [DOI] [PubMed] [Google Scholar]
- [49].Guzman NA. 5,202,010 US Patent. 1993 April 13;
- [50].Fuchs M, Merion M. 5,348,658 US Patent. 1994 September 20;
- [51].Armenta JM, Gu B, Humble PH, Thulin CD, Lee ML. J. Chromatogr. A. 2005;1097:171–178. doi: 10.1016/j.chroma.2005.08.050. [DOI] [PubMed] [Google Scholar]
- [52].Yone A, Rusell ML, Grasselli M, Vizioli NM. Electrophoresis. 2007;28:2216–2218. doi: 10.1002/elps.200600706. [DOI] [PubMed] [Google Scholar]
- [53].Kaneta T, Inoue J, Koizumi M, Imasaka T. Electrophoresis. 2006;27:3218. doi: 10.1002/elps.200500936. [DOI] [PubMed] [Google Scholar]
- [54].Phillips TM, Chmielinska JJ. Biomed. Chromatogr. 1994;8:242–246. doi: 10.1002/bmc.1130080509. [DOI] [PubMed] [Google Scholar]
- [55].Phillips TM, Dickens BF. Electrophoresis. 1998;19:2991–2996. doi: 10.1002/elps.1150191632. [DOI] [PubMed] [Google Scholar]
- [56].Ehrlich P. In: Histology, Biochemistry and Pathology. Himmelweit F, editor. Vol. 1. Pergamon Press; London and New York: 1956. [Google Scholar]
- [57].Landsteiner K, van der Scheer J. J. Exp. Med. 1936;63:325–339. doi: 10.1084/jem.63.3.325. [DOI] [PMC free article] [PubMed] [Google Scholar]
- [58].Pressman D, Campbell DH, Pauling L. J. Immunol. 1942;44:101–105. [Google Scholar]
- [59].Cuatrecasas P, Anfinsen CB. Ann. Rev. Biochem. 1971;40:259–278. doi: 10.1146/annurev.bi.40.070171.001355. [DOI] [PubMed] [Google Scholar]
- [60].Friedberg F. Chromatogr. Rev. 1971;14:121–131. doi: 10.1016/0009-5907(71)80005-4. [DOI] [PubMed] [Google Scholar]
- [61].Chaiken IM. J. Chromatogr. 1986;376:11–32. doi: 10.1016/s0378-4347(00)80821-x. [DOI] [PubMed] [Google Scholar]
- [62].Ehrlich P. Proc. R. Soc. 1900;66:424–448. [Google Scholar]
- [63].Mix E, Goertsches R, Zett UK. J. Neurol. 2006;253:v9–v17. doi: 10.1007/s00415-006-5002-2. [DOI] [PubMed] [Google Scholar]
- [64].Milstein C. Proc. R. Soc. Lond. B Biol. Sci. 1990;239:1–16. doi: 10.1098/rspb.1990.0006. [DOI] [PubMed] [Google Scholar]
- [65].Finkelstein AV, Ptitsyn OB. Protein Physics: A Course of Lectures. Academic Press; London, UK: 2000. [Google Scholar]
- [66].Kang J, Warren AS. Mol. Immunol. 2007;44:3623–3624. doi: 10.1016/j.molimm.2007.03.006. [DOI] [PubMed] [Google Scholar]
- [67].Behr J-P, editor. The Lock-and-Key Principle, Volume 1. John Wiley & Sons; Somerset, NJ: 1995. The State of the Art - 100 Years On. [Google Scholar]
- [68].Notkins AL. Trend Immunol. 2004;25:174–179. doi: 10.1016/j.it.2004.02.004. [DOI] [PubMed] [Google Scholar]
- [69].Davies DR, Cohen GH. Proc. Natl. Acad. Sci. USA. 1996;93:7–12. doi: 10.1073/pnas.93.1.7. [DOI] [PMC free article] [PubMed] [Google Scholar]
- [70].Yalow R, Berson SA. J. Clin. Invest. 1960;39:1157–1175. doi: 10.1172/JCI104130. [DOI] [PMC free article] [PubMed] [Google Scholar]
- [71].Engvall E, Perlmann P. Immunochemistry. 1971;8:871–874. doi: 10.1016/0019-2791(71)90454-x. [DOI] [PubMed] [Google Scholar]
- [72].van Weemen BK, Schuurs AH. FEBS Lett. 1971;15:232–236. doi: 10.1016/0014-5793(71)80319-8. [DOI] [PubMed] [Google Scholar]
- [73].Liu E, Eisenbarth GS. Clin. Immunol. 2007;125:120–126. doi: 10.1016/j.clim.2007.08.005. [DOI] [PMC free article] [PubMed] [Google Scholar]
- [74].Rawlins ML, Swenson EM, Hill HR, Litwin CM. Clin. Vaccine Immunol. 2007;14:665–668. doi: 10.1128/CVI.00480-06. [DOI] [PMC free article] [PubMed] [Google Scholar]
- [75].Hussain T, Sinha S, Katoch K, Yadav VS, et al. Lepr. Rev. 2007;78:137–147. [PubMed] [Google Scholar]
- [76].Aebersold R, Mann M. Nature. 2003;422:198–207. doi: 10.1038/nature01511. [DOI] [PubMed] [Google Scholar]
- [77].Albrethsen J. Clin. Chem. 2007;53:852–858. doi: 10.1373/clinchem.2006.082644. [DOI] [PubMed] [Google Scholar]
- [78].Cravatt BF, Simon GM, Yates JR., III Nature. 2007;450:991–1000. doi: 10.1038/nature06525. [DOI] [PubMed] [Google Scholar]
- [79].Delahunty CM, Yates JR., III Biotechniques. 2007;43:563–567. [PubMed] [Google Scholar]
- [80].MacCoss MJ, Mattews DE. Anal. Chem. 2005;77:295A–302A. [Google Scholar]
- [81].Ackermann BD, Berna MJ. Expert Rev. Proteomics. 2007;4:175–186. doi: 10.1586/14789450.4.2.175. [DOI] [PubMed] [Google Scholar]
- [82].Hess JL, Blazer L, Romer T, Faber L, et al. J. Chromatogr. B. 2005;815:65–75. doi: 10.1016/j.jchromb.2004.07.047. [DOI] [PubMed] [Google Scholar]
- [83].Wetmore BA, Merrick BA. Toxicol. Pathol. 2004;32:619–642. doi: 10.1080/01926230490518244. [DOI] [PubMed] [Google Scholar]
- [84].Mulder J, Wenerus H, Shi TJ, Ponten F, et al. Neuroscience. 2007;146:1689–1703. doi: 10.1016/j.neuroscience.2007.02.054. [DOI] [PubMed] [Google Scholar]
- [85].Keshishian H, Addona T, Burgess M, Kuhn E, Carr SA. Mol. Cell. Proteomics. 2007;6:2212–2229. doi: 10.1074/mcp.M700354-MCP200. [DOI] [PMC free article] [PubMed] [Google Scholar]
- [86].Lewin DA, Weiner MP. Drug Dis. Today. 2004;9:976–983. doi: 10.1016/S1359-6446(04)03272-6. [DOI] [PubMed] [Google Scholar]
- [87].Gregg EO, Fisher A-L, Lowe F, McEwan M, Massey ED. Regul. Toxicol. Pharmacol. 2006;44:262–267. doi: 10.1016/j.yrtph.2005.12.006. [DOI] [PubMed] [Google Scholar]
- [88].Cho-Chung YS. Biochim. Biophys. Acta. 2006;1762:587–591. doi: 10.1016/j.bbadis.2006.04.001. [DOI] [PubMed] [Google Scholar]
- [89].Granger DA, Kivlighan KT, Fortunato C, Harmon AG, et al. Physiol. Behav. 2007;92:583–590. doi: 10.1016/j.physbeh.2007.05.004. [DOI] [PubMed] [Google Scholar]
- [90].Dieterle F, Marrer E, Suzuki E, Grenet O, et al. Curr. Opin. Drug Discov. Devel. 2008;11:60–71. [PubMed] [Google Scholar]
- [91].Hu S, Loo JA, Wong DT. Expert Rev. Proteomics. 2007;4:531–538. doi: 10.1586/14789450.4.4.531. [DOI] [PubMed] [Google Scholar]
- [92].Barrott J, Topham P. Can. Med. Assoc. J. 2007;177:361–368. doi: 10.1503/cmaj.061590. [DOI] [PMC free article] [PubMed] [Google Scholar]
- [93].Rai AJ. Exp. Rev. Mol. Diagn. 2007;7:545–553. doi: 10.1586/14737159.7.5.545. [DOI] [PubMed] [Google Scholar]
- [94].Tammen H, Peck A, Budde P, Zucht HD. Exp. Rev. Mol. Diagn. 2007;7:605–613. doi: 10.1586/14737159.7.5.605. [DOI] [PubMed] [Google Scholar]
- [95].Walker EJ, Siminovitch KA. Nat. Clin. Pract. Rheumatol. 2007;3:580–589. doi: 10.1038/ncprheum0595. [DOI] [PubMed] [Google Scholar]
- [96].Jain KK. Curr. Opin. Mol. Ther. 2007;9:563–571. [PubMed] [Google Scholar]
- [97].Matt P, Fu Z, Fu Q, Van Eyk JE. Physiol. Genomics. 2008;33:12–17. doi: 10.1152/physiolgenomics.00282.2007. [DOI] [PubMed] [Google Scholar]
- [98].Dieterle F, Marrer E. Anal. Bioanal. Chem. 2008;390:141–154. doi: 10.1007/s00216-007-1688-y. [DOI] [PubMed] [Google Scholar]
- [99].Schmitt-Kopplin P, Englmann M. Electrophoresis. 2005;26:1209–1220. doi: 10.1002/elps.200410355. [DOI] [PubMed] [Google Scholar]
- [100].Stutz H. Electrophoresis. 2005;26:1254–1290. doi: 10.1002/elps.200410130. [DOI] [PubMed] [Google Scholar]
- [101].Fliser D, Wittke S, Mischak H. Electrophoresis. 2005;26:2708–2716. doi: 10.1002/elps.200500187. [DOI] [PubMed] [Google Scholar]
- [102].Pelzing M, Neusüß C. Electrophoresis. 2005;26:2717–2728. doi: 10.1002/elps.200410424. [DOI] [PubMed] [Google Scholar]
- [103].Haselberg R, de Jong GJ, Somsen GM. J. Chromatogr. A. 2007;1159:81–109. doi: 10.1016/j.chroma.2007.05.048. [DOI] [PubMed] [Google Scholar]
- [104].Sniehotta M, Schiffer E, Zurbiq P, Novak J, Mischak H. Electrophoresis. 2007;28:1407–1417. doi: 10.1002/elps.200600581. [DOI] [PubMed] [Google Scholar]
- [105].Issaq HJ, Veenstra TD. Electrophoresis. 2007;28:1980–1988. doi: 10.1002/elps.200600834. [DOI] [PubMed] [Google Scholar]
- [106].Biormarkers Definitions Working Group Clin. Pharmacol. Ther. 2001;69:89–95. doi: 10.1067/mcp.2001.113989. [DOI] [PubMed] [Google Scholar]
- [107].Petricoin EF, Belluco C, Araujo RP, Liotta LA. Nat. Rev. Cancer. 2006;6:961–967. doi: 10.1038/nrc2011. [DOI] [PubMed] [Google Scholar]
- [108].Holland CA, Kiechle FL. Curr. Opin. Microbiol. 2005;8:504–509. doi: 10.1016/j.mib.2005.08.001. [DOI] [PubMed] [Google Scholar]
- [109].Soper SA, Brown K, Ellington A, Frazier B, et al. Biosens. Bioelectron. 2006;21:1932–1942. doi: 10.1016/j.bios.2006.01.006. [DOI] [PubMed] [Google Scholar]
- [110].Jain KK. Clin. Chem. 2007;53:2002–2009. doi: 10.1373/clinchem.2007.090795. [DOI] [PubMed] [Google Scholar]
- [111].Dobson MG, Galvin P, Barton DE. Expert Rev. Mol. Diagn. 2007;7:359–370. doi: 10.1586/14737159.7.4.359. [DOI] [PubMed] [Google Scholar]
- [112].Huang L, Harvie G, Feitelson JS, Gramatikoff K, et al. Proteomics. 2005;5:3314–3328. doi: 10.1002/pmic.200401277. [DOI] [PubMed] [Google Scholar]
- [113].Feitelson JS, Simonian M, Dewald H, Chapman J. Gen. Eng. Biotechnol. News. 2006;26:12. [Google Scholar]
- [114].Zhou M, Veenstra TD. Proteomics. 2007;7:2688–2697. doi: 10.1002/pmic.200700048. [DOI] [PubMed] [Google Scholar]
- [115].Thongboonkerd V. 2007;6:3881–3890. doi: 10.1021/pr070328s. [DOI] [PubMed] [Google Scholar]
- [116].Hu L, Ye M, Jianq X, Feng S, Zou H. Anal. Chim. Acta. 2007;598:193–204. doi: 10.1016/j.aca.2007.07.046. [DOI] [PubMed] [Google Scholar]
- [117].Josic D, Clifton JD. J. Chromatogr. A. 2007;1144:2–13. doi: 10.1016/j.chroma.2006.11.082. [DOI] [PubMed] [Google Scholar]
- [118].Kessel M, Frank F. Nat. Biotechnol. 2007;25:859–866. doi: 10.1038/nbt0807-859. [DOI] [PubMed] [Google Scholar]
- [119].Trusheim MR, Berndt ER, Douglas FL. Nat. Rev. Drug Discov. 2007;6:287–293. doi: 10.1038/nrd2251. [DOI] [PubMed] [Google Scholar]
- [120].Francois P, Scherl A, Hochstrasser D, Schrenzel J. Methods Mol. Biol. 2007;391:179–199. doi: 10.1007/978-1-59745-468-1_14. [DOI] [PubMed] [Google Scholar]
- [121].Stoltenburg R, Reinemann C, Strehlitz B. Biomol. Eng. 2007;24:381–403. doi: 10.1016/j.bioeng.2007.06.001. [DOI] [PubMed] [Google Scholar]
- [122].Su Z, Honek JF. Curr. Opin. Investig. Drugs. 2007;8:140–149. [PubMed] [Google Scholar]
- [123].McClelland CM, Gullick WJ. Br. J. Cancer. 2007;96:284–299. doi: 10.1038/sj.bjc.6603544. [DOI] [PMC free article] [PubMed] [Google Scholar]
- [124].Weibel DB, Whitesides GM. Curr. Opin. Chem. Biol. 2006;10:584–591. doi: 10.1016/j.cbpa.2006.10.016. [DOI] [PubMed] [Google Scholar]
- [125].Horsman KM, Bienvenue JM, Blasier KR, Landers JP. J. Forensic Sci. 2007;52:784–799. doi: 10.1111/j.1556-4029.2007.00468.x. [DOI] [PubMed] [Google Scholar]
- [126].Toriello NM, Liu CN, Blazej RG, Thaitrong N, Mathies RA. Anal. Chem. 2007;79:8549–8556. doi: 10.1021/ac0712547. [DOI] [PubMed] [Google Scholar]
- [127].Mauk MG, Ziober BL, Chen Z, Thompson JA, et al. Acad. Sci. 2007;1098:467–475. doi: 10.1196/annals.1384.025. [DOI] [PubMed] [Google Scholar]
- [128].Herr AE, Hatch AV, Throckmorton DJ, Tran HM, et al. Proc. Natl. Acad. Sci. 2007;104:5268–5273. doi: 10.1073/pnas.0607254104. [DOI] [PMC free article] [PubMed] [Google Scholar]
- [129].Krieger J, Stinson S, Worthy W, Dagani R. Chem. Eng. News. 1991;69:28–36. [Google Scholar]
- [130].Guzman NA, Gonzalez CL, Trebilcock MA, Hernandez L, et al. Chap. 22. In: Guzman NA, editor. Capillary Electrophoresis Technology. Marcel Dekker Inc.; New York: 1993. pp. 643–672. [Google Scholar]
- [131].Guzman NA. J. Liq. Chromatogr. 1995;18:3751–3768. [Google Scholar]
- [132].Guzman NA. Chap. 4. In: Righetti PG, editor. Capillary Electrophoresis: An Analytical Tool in Biotechnology. CRC Press; Boca Raton: 1996. pp. 101–121. [Google Scholar]
- [133].Guzman NA. LCGC. 1999;17:16–27. [Google Scholar]
- [134].Guzman NA, Majors RE. LCGC. 2001;19:14–30. [Google Scholar]
- [135].Shaw CJ, Guzman NA. Chap. 7. In: Ohannesian L, Streeter AJ, editors. Pharmaceutical Analysis. Marcel Dekker; New York: 2002. pp. 313–386. [Google Scholar]
- [136].Guzman NA. Electrophoresis. 2003;24:3718–3727. doi: 10.1002/elps.200305647. [DOI] [PubMed] [Google Scholar]
- [137].Guzman NA. 6,406,604 B1 US Patent. 2002 June 18;
- [138].Guzman NA. 7,329,388 B2 US Patent. 2008 February 12;
- [139].Phillips TM. Biomed. Chromatogr. 1997;11:200–204. doi: 10.1002/(SICI)1099-0801(199707)11:4<200::AID-BMC674>3.0.CO;2-H. [DOI] [PubMed] [Google Scholar]
- [140].Phillips TM, Krum JM. J. Chromatogr. B. 1998;715:55–63. doi: 10.1016/s0378-4347(97)00675-0. [DOI] [PubMed] [Google Scholar]
- [141].Phillips TM. J. Biochem. Biophys. Methods. 2001;49:253–262. doi: 10.1016/s0165-022x(01)00202-0. [DOI] [PubMed] [Google Scholar]
- [142].Castle PE, Phillips TM, Hildesheim A, Herrero R, et al. Cancer Epidemiol. Biomarkers Prev. 2003;12:1449–1456. [PubMed] [Google Scholar]
- [143].Peoples MC, Phillips TM, Karnes HT. J. Chromatogr. B. 2007;848:200–207. doi: 10.1016/j.jchromb.2006.10.032. [DOI] [PubMed] [Google Scholar]
- [144].Peoples MC, Phillips TM, Karnes HT. J. Pharm. Biomed. Anal. 2008 doi: 10.1016/j.jpba.2007.11.036. in press. Published on-line as manuscript doi: 10.1016/j.jba.2007.11.036. [DOI] [PubMed] [Google Scholar]
- [145].Phillips TM, Kennedy LM, De Fabo EC. J. Chromatogr. B: Biomed. Sci. Appl. 1997;697:101–109. doi: 10.1016/s0378-4347(97)00132-1. [DOI] [PubMed] [Google Scholar]
- [146].Phillips TM, Dickens BF. Electrophoresis. 1998;19:2991–2996. doi: 10.1002/elps.1150191632. [DOI] [PubMed] [Google Scholar]
- [147].Phillips TM. Luminescence. 2001;16:145–152. doi: 10.1002/bio.645. [DOI] [PubMed] [Google Scholar]
- [148].Phillips TM, Smith P. Biomed. Chromatogr. 2003;17:182–187. doi: 10.1002/bmc.240. [DOI] [PubMed] [Google Scholar]
- [149].Brenneman DE, Phillips TM, Hauser J, Hill JM, et al. Neuropeptides. 2003;37:111–119. doi: 10.1016/s0143-4179(03)00022-2. [DOI] [PubMed] [Google Scholar]
- [150].Phillips TM. Electrophoresis. 2004;25:1652–1659. doi: 10.1002/elps.200305873. [DOI] [PubMed] [Google Scholar]
- [151].Delaunay-Bertoncini N, Hennion M-C. J. Pharmacol. Biomed. Anal. 2004;34:717–736. doi: 10.1016/S0731-7085(03)00559-4. [DOI] [PubMed] [Google Scholar]
- [152].Armenta JA, Gu B, Thulin CD, Lee ML. J. Chromatogr. A. 2007;1148:115–122. doi: 10.1016/j.chroma.2007.02.089. [DOI] [PubMed] [Google Scholar]
- [153].Cole LJ, Kennedy RT. Electrophoresis. 1995;16:549–556. doi: 10.1002/elps.1150160190. [DOI] [PubMed] [Google Scholar]
- [154].Ensing K, Paulus A. J. Pharm. Biomed. Anal. 1996;14:305–316. doi: 10.1016/0731-7085(95)01607-4. [DOI] [PubMed] [Google Scholar]
- [155].Rashkovetsky LG, Lyubarskaya YV, Foret F, Hughes DE, Karger BL. J. Chromatogr. A. 1997;781:197–204. doi: 10.1016/s0021-9673(97)00629-8. [DOI] [PubMed] [Google Scholar]
- [156].Dalluge JJ, Sander LC. Anal. Chem. 1998;70:5339–5343. doi: 10.1021/ac980773u. [DOI] [PubMed] [Google Scholar]
- [157].Thomas DH, Rakestraw DJ, Schoeniger JS, Lopez-Avila V, Van Emon J. Electrophoresis. 1999;20:57–66. doi: 10.1002/(SICI)1522-2683(19990101)20:1<57::AID-ELPS57>3.0.CO;2-J. [DOI] [PubMed] [Google Scholar]
- [158].Connor AC, McGown LB. J. Chromatogr. A. 2006;1111:115–119. doi: 10.1016/j.chroma.2005.05.012. [DOI] [PubMed] [Google Scholar]
- [159].Yue GE, Roper MG, Balchunas C, Pulsipher A, Coon JJ, Shabanowitz J, Hunt DF, Landers JP, Ferrance JP. Anal. Chim. Acta. 2006;564:116–122. doi: 10.1016/j.aca.2005.11.003. [DOI] [PMC free article] [PubMed] [Google Scholar]
- [160].Okanda FM, El Rassi Z. Electrophoresis. 2007;28:89–98. doi: 10.1002/elps.200600595. [DOI] [PubMed] [Google Scholar]
- [161].Benavente F, Vescina MC, Hernandez E, Sanz-Nebot V, Barbosa J, Guzman NA. J. Chromatogr. A. 2007;1140:205–212. doi: 10.1016/j.chroma.2006.11.092. [DOI] [PubMed] [Google Scholar]
- [162].Simpson SL, Jr., Quirino JP, Terabe S. J. Chromatogr. A. 2008;1184:504–541. doi: 10.1016/j.chroma.2007.11.001. [DOI] [PubMed] [Google Scholar]
- [163].Bilitewski U, Genrich M, Kadow S, Mersal G. Anal. Bioanal. Chem. 2003;377:556–569. doi: 10.1007/s00216-003-2179-4. [DOI] [PubMed] [Google Scholar]
- [164].Yang B, Zhang F, Tian H, Guan Y. J. Chromatogr. A. 2006;117:214–218. doi: 10.1016/j.chroma.2006.03.105. [DOI] [PubMed] [Google Scholar]
- [165].Okamoto Y, Kitagawa F, Otsuka K. Anal. Chem. 2007;79:3041–3047. doi: 10.1021/ac061693q. [DOI] [PubMed] [Google Scholar]
- [166].Vizioli NM, Rusell ML, Carbajal ML, Carducci CN, Graselli M. Electrophoresis. 2005;26:2942–2948. doi: 10.1002/elps.200410416. [DOI] [PubMed] [Google Scholar]
- [167].Thabano JR, Breadmore MC, Hutchison JP, Johns C, Haddad PR. J. Chromatogr. A. 2007;1175:117–126. doi: 10.1016/j.chroma.2007.09.069. [DOI] [PubMed] [Google Scholar]
- [168].Faure K, Delaunay N, Alloncle G, Cotte S, Rocca JL. J. Chromatogr. A. 2007;1149:145–150. doi: 10.1016/j.chroma.2007.03.031. [DOI] [PubMed] [Google Scholar]
- [169].Guzman NA. submitted for publication.
- [170].Altria KD, Elder D. J. Chromatogr. A. 2004;1023:1–14. doi: 10.1016/j.chroma.2003.10.054. [DOI] [PubMed] [Google Scholar]
- [171].Pang H-M, Kenseth J, Coldiron S. Drug Discov. Today. 2004;9:1072–1080. doi: 10.1016/S1359-6446(04)03293-3. [DOI] [PubMed] [Google Scholar]
- [172].Fitzgerald K. Gen. Eng. Biotechnol. News. 2008;28:16–17. [Google Scholar]
- [173].Rolan P, Danhof M, Stanski D, Peck C. Eur. J. Pharm. Sci. 2007;30:107–112. doi: 10.1016/j.ejps.2006.11.007. [DOI] [PubMed] [Google Scholar]
- [174].Tomizaki K-Y, Usui K, Mihara H. ChemBioChem. 2005;6:782–799. doi: 10.1002/cbic.200400232. [DOI] [PubMed] [Google Scholar]
- [175].Holliger P, Hudson PJ. Nat. Biotechnol. 2005;23:1126–1136. doi: 10.1038/nbt1142. [DOI] [PubMed] [Google Scholar]
- [176].Nashabeh W, El Rassi Z. J. Chromatogr. 1992;596:251–264. doi: 10.1016/0021-9673(92)85014-k. [DOI] [PubMed] [Google Scholar]
- [177].Peoples MC, Karnes HT. Anal. Chem. 2008;80:3853–3858. doi: 10.1021/ac800244n. [DOI] [PubMed] [Google Scholar]
- [178].Su P, Zhang X-X, Chang W-B. J. Chromatogr. B. 2005;816:7–14. doi: 10.1016/j.jchromb.2004.07.009. [DOI] [PubMed] [Google Scholar]
- [179].Zhang Z-X, He Y-Z. J. Chromatogr. A. 2005;1066:211–218. doi: 10.1016/j.chroma.2005.01.081. [DOI] [PubMed] [Google Scholar]
- [180].Lin S, Hsu S-M. Anal. Biochem. 2005;341:1–15. doi: 10.1016/j.ab.2005.02.023. [DOI] [PubMed] [Google Scholar]
- [181].Hennion M-C, Pichon V. J. Chromatogr. A. 2003;1000:29–52. doi: 10.1016/s0021-9673(03)00529-6. [DOI] [PubMed] [Google Scholar]
- [182].Luo Q, Gu Y, Wu S-L, Rejtar T, Karger BL. Electrophoresis. 2008;29:1604–1611. doi: 10.1002/elps.200700741. [DOI] [PMC free article] [PubMed] [Google Scholar]
- [183].Deng Q, Watson CJ, Kennedy RT. J. Chromatogr. A. 2003;1005:123–130. doi: 10.1016/s0021-9673(03)00812-4. [DOI] [PubMed] [Google Scholar]
- [184].Hammerer-Lercher A, Halfinger B, Sarg B, Mair J, et al. Clin. Chem. 2008;54:858–865. doi: 10.1373/clinchem.2007.090266. [DOI] [PubMed] [Google Scholar]
- [185].Nicol GR, Han M, Kim J, Birse CE, Brand E, et al. Mol. Cell. Proteomics. 2008 doi: 10.1074/mcp.M700476-MCP200. in press. Published on-line on April 3, 2008, as manuscript MP00476-MCP 200. [DOI] [PubMed] [Google Scholar]
- [186].Guan F, Uboh CE, Soma LR, Birks E, et al. Anal. Chem. 2008;80:3811–3817. doi: 10.1021/ac800054t. [DOI] [PubMed] [Google Scholar]
- [187].Huang L, Fang X. Methods Mol. Biol. 2008;425:41–51. doi: 10.1007/978-1-60327-210-0_4. [DOI] [PubMed] [Google Scholar]
- [188].Gao M, Deng C, Yu W, Zhang Y, et al. Proteomics. 2008;8:939–947. doi: 10.1002/pmic.200600099. [DOI] [PubMed] [Google Scholar]
- [189].Peoples MC, Karnes HT. J. Chromatogr. B. 2008;866:14–25. doi: 10.1016/j.jchromb.2007.08.030. [DOI] [PubMed] [Google Scholar]
- [190].Shimura K, Koyama Y, Sato K, Kitamori T. J. Sep. Sci. 2007;30:1477–1481. doi: 10.1002/jssc.200700015. [DOI] [PubMed] [Google Scholar]
- [191].Mechref Y, Madera M, Novotny MV. Methods Mol. Biol. 2008;424:373–396. doi: 10.1007/978-1-60327-064-9_29. [DOI] [PubMed] [Google Scholar]
- [192].Kubota K, Sato Y, Goto-Inove N, Toda T, et al. Anal. Chem. 2008;80:3693–3698. doi: 10.1021/ac800070d. [DOI] [PubMed] [Google Scholar]
- [193].Hutanu D, Remcho VT. Adv. Chromatogr. 2007;45:173–196. doi: 10.1201/9781420018066.ch4. [DOI] [PubMed] [Google Scholar]
- [194].Mairal T, Özalp VC, Lozano-Sánchez, Mir M, et al. Anal. Bioanal. Chem. 2008;390:989–1007. doi: 10.1007/s00216-007-1346-4. [DOI] [PubMed] [Google Scholar]
- [195].Connor AC, McGown LB. J. Chromatogr. A. 2006;1111:115–119. doi: 10.1016/j.chroma.2005.05.012. [DOI] [PubMed] [Google Scholar]
- [196].Jmeian Y, El Rassi Z. J. Proteome Res. 2007;6:947–954. doi: 10.1021/pr060660o. [DOI] [PubMed] [Google Scholar]
- [197].Herrero M, Ibañez E, Cifuentes A. Electrophoresis. 2008;29:2148–2160. doi: 10.1002/elps.200700404. [DOI] [PubMed] [Google Scholar]
- [198].Geiser L, Eeltink S, Svec F, Fréchet JM. J. Chromatogr. A. 2008;1188:88–96. doi: 10.1016/j.chroma.2008.02.075. [DOI] [PMC free article] [PubMed] [Google Scholar]
- [199].Tsukagoshi K, Jinno N, Nakajima R. Anal. Chem. 2005;77:1684–1688. doi: 10.1021/ac040133t. [DOI] [PubMed] [Google Scholar]
- [200].Toriello NM, Liu CN, Blazej RG, Thaitrong N, Mathies RA. Anal. Chem. 2007;79:8549–8556. doi: 10.1021/ac0712547. [DOI] [PubMed] [Google Scholar]
- [201].Hardouin J, Lasserre JP, Sylvius L, Joubert-Caron R, Caron M. Ann. N. Y. Acad. Sci. 2007;1107:223–230. doi: 10.1196/annals.1381.024. [DOI] [PubMed] [Google Scholar]
- [202].Sun X, Yang W, Pan T, Woolley AT. Anal Chem. 2008;89:5126–5130. doi: 10.1021/ac800322f. [DOI] [PMC free article] [PubMed] [Google Scholar]
- [203].Govorukhina N, Horvatovich P, Bischoff R. Methods Mol. Biol. 2008;484:67–77. doi: 10.1007/978-1-59745-398-1_5. [DOI] [PubMed] [Google Scholar]
- [204].Uhlén M, Hober S. J. Mol. Recognit. 2008 doi: 10.1002/jmr.891. in press. Published on-line as manuscript doi: 10.1002/jmr.891. [DOI] [PubMed] [Google Scholar]
- [205].Uhlén M. BioTechniques. 2008;5:649–754. doi: 10.2144/000112803. [DOI] [PubMed] [Google Scholar]