

Abstract
We present multiple native and denaturation simulations of the B and E domains of the three-helix bundle protein A, totaling 60 ns. The C-terminal helix (H3) consistently denatures later than either of the other two helices and contains residual helical structure in the denatured state. These results are consistent with experiments suggesting that the isolated H3 fragment is more stable than H1 and H2 and that H3 forms early in folding. Interestingly, the denatured state of the B domain is much more compact than that of the E domain. This sequence-dependent effect on the dimensions of the denatured state and the lack of correlation with structure suggest that the radius of gyration can be a misleading reaction coordinate for unfolding/folding. Various unfolding and refolding events are observed in the denaturation simulations. In some cases, the transitions are facilitated through interactions with other portions of the protein—contact-assisted helix formation. In the native simulations, the E domain is very stable: after 6 ns, the Cα root-mean-square deviation from the starting structure is less than 1.4 Å. In contrast, the native state of the B domain deviates more and its inter-helical angles fluctuate. In apparent contrast, we note that the B domain is thermodynamically more stable than the E domain. The simulations suggest that the increased stability of the B domain may be due to heightened mobility, and therefore entropy, in the native state and decreased mobility/entropy in the more compact denatured state.
Protein A is a membrane-bound protein from Staphylococcus aureus that binds to the Fc fragment of IgG. It contains five homologous domains, and each domain is a three-helix bundle consisting of 57–60 residues. These domains are stable as fragments and are designated E, D, A, B, and C, proceeding from the N to the C terminus (1). These domains have been used to purify fusion proteins by binding to IgG (2). Wells and co-workers (3) have engineered deletion mutants, or structurally pared down versions, of protein A that still bind to IgG. This approach is termed protein minimization (4). One minimized fragment, consisting of approximately half the residues, folds cooperatively with stability comparable to that of the entire domain (5). This fragment also displays native-like NMR chemical shift dispersion and binding affinity to IgG.
The structures of the native states of the B and E domains (Fig. 1) have been reviewed in depth by Starovasnik et al. (6) and by Tashiro and Montelione (7). The B and E domains share 67% sequence identity overall, and the identity rises to 71% for the helical segments. In addition, there is an NMR structure of the Z domain, which differs from the structured part of the B domain only by a G30A mutation (9). In all the domains, we term the three helices H1, H2, and H3, proceeding from the N to the C terminus. The orientation of H1 with respect to the other two helices is tilted by 10–15° in the E and Z domains; that is, the angles are approximately 170° (6, 9, 11). The H1–H2 angle for the free B domain is 30° by NMR (8). It is not clear why the highly homologous B and Z domains have different tilt angles, whereas those angles are similar in the sequentially dissimilar E and Z domains. The B and Z domains are more stable than the E domain as measured by solvent and temperature denaturation experiments. The E domain has a thermodynamic stability extrapolated from solvent denaturation of only 2 kcal/mol (E. A. Zhukovsky, L. G. Presta, and M. A. Starovasnik, personal communication), whereas the B and Z domains are more stable, 7 kcal/mol (12, 13). The melting temperature of the Z domain is 27° higher than that of the E domain (ref. 5 and E. A. Zhukovsky, L. G. Presta, and M. A. Starovasnik, personal communication).
Figure 1.
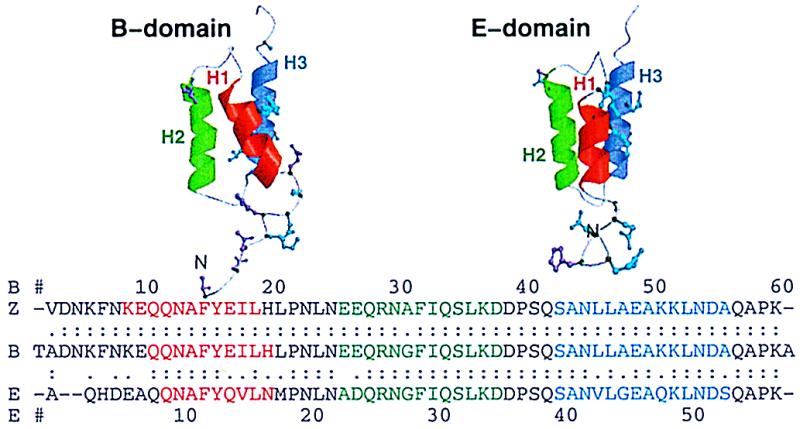
Ribbon diagrams of the B and E domains and sequence alignment of the B, E, and Z domains of protein A. The helices are colored red, green, and blue for H1, H2, and H3, respectively, in both the structures and sequences. The helices in the E domain are as reported by Starovasnik et al. (ref. 6, Protein Data Bank ID 1edk): H1 (residues 8–15), H2 (22–34), and H3 (39–52). The helices in the B-domain NMR structure (ref. 8, 1bdd) are as follows: H1 (10–19), H2 (27–37), and H3 (42–55). The helices in the Z domain are as given by Tashiro et al. (ref. 9, 1spz): H1 (7–17), H2 (24–36), and H3 (41–54). Alignment was with the fasta algorithm (10). Identity is indicated with “:”. Conservative mutations are displayed in cyan and indicated with “.”. Nonconservative mutations are displayed in magenta and left blank in the alignment.
The stabilities of the individual helices and their contributions to stability are relevant both to protein minimization strategies and to studies of protein folding pathways. In truncation studies, H3 is required for the stability of the B domain, and its deletion eliminates the helical CD signal and binding to Fc (3, 4). The H3 fragment from the B domain forms the most stable isolated helix (12). H1 and H2 are unstable as isolated helices, whereas H3 contains approximately 30% helix as estimated by CD spectroscopy. An H2-H3 fragment contains 50% helix. H2 and H3 are also more stable in the native state of protein A, as assessed by hydrogen exchange experiments (12). Bottomley et al. (14) came to similar conclusions based on denaturation studies of the B domain: “H1 unfolded first followed by H2 and H3 together.” Overall, the available experimental evidence indicates that H3 and H2 are more stable than H1.
Protein A has also been the subject of theoretical folding studies by several groups. Skolnick and co-workers (15, 16) studied protein A to develop folding algorithms based on successively finer lattice Monte Carlo simulations. Zhou and Karplus (17) used a simple model to investigate the equilibrium states available to the B domain and the temperature dependence of the transitions between those states. Onuchic et al. (18) used a cubic lattice to predict a folding funnel surface and applied their results to protein A. Protein A has also been the subject of detailed high-resolution simulations of Brooks and co-workers (19, 20). In pioneering work, they used a weighted histogram sampling of 79 different 300-ps molecular dynamics (MD) simulations in water to predict a folding surface as a function of pairs of coordinates taken from the following list: radius of gyration, native contacts, total hydrogen bonds, and helical hydrogen bonds. The results of Guo et al. (20) predict that the native state is the free energy minimum and that there is an initial collapsed state with few native contacts, followed by a transition between that collapsed state and the native basin. They also predict that H3 forms only after H1 and H2 along the folding pathway. Specifically, their order of folding events can be summarized as follows: (i) formation of the H1-H2 turn interface and the first few adjacent contacts; (ii) formation of stable helix in H1 and H2; and (iii) H3 forms only after making contact with H1 and H2.
We became interested in protein A to test the feasibility of MD simulations for predicting folding cores to aid in structural minimization. Our initial efforts focused on the E domain investigated at Genentech (6). However, recent experimental results made the theoretical study of helix stability, native state dynamics, and the unfolding pathways in different protein A domains attractive subjects, as well. We have now simulated the B and E domains under native and denaturing conditions. We also simulated a model based on the Z domain under native conditions. The native simulations provide controls for the denaturation simulations and information about sequence-dependent differences within the native state. From the thermal denaturation simulations in water, we can follow continuous trajectories between the native and unfolded states and the disappearance and transient reformation of helices as the protein denatures. We assume that segments that persist longer as helices form helical structure earlier along folding pathways and/or are more likely to be helical in nonnative states. Similarly, persistent contacts under extreme conditions identify residues that one might want to conserve during structural minimization attempts.
Methods
The B-domain simulations started from the minimized average NMR structure of Gouda et al. (8) (1bbd). The E-domain simulations started from the minimized average NMR structure of Starovasnik and co-workers (6) (1edk). The BZ model used the structure of the Z domain and the sequence of the B domain. The BZ domain was constructed from the Z-domain structure [structure 9, 1spz, Jendeberg et al. (11)] with residues Thr-1 and Ala-60 added in extended conformations, and the V2A and A30G mutations were made to yield the B-domain sequence.
Simulations were performed by using the program encad (21) and a previously described force field (22, 23). All atoms were explicitly present. All starting structures underwent the following preparation protocol prior to the MD simulations. The protein was initially minimized 1,000 steps in vacuo. Because of the relatively high root-mean-square deviation (rmsd) of a preliminary native B-domain simulation, 3,000 steps of in vacuo minimization were employed with that domain. However, the rmsd from the starting structure did not depend appreciably on the initial minimization procedure. The minimized protein was then solvated with water in a box (approximately 1 g/ml) extending a minimum of 10 Å from the protein in the case of the E1(498), B1(498), and Bfrag1(498) simulations and extending 8 Å in E2(498), B2(498), Bfrag2(498), E(298), B(298), and BZ(298). The box dimensions were then increased uniformly to yield the experimental liquid water density for the temperature of interest (0.997 g/ml at 298 K and 0.829 at 498 K) (24, 25), leading to water layers of at least 12 and 10 Å. The systems were then equilibrated by minimizing the water for 2,000 steps, minimizing water and protein for 100 steps, performing MD of the water for 4,000 steps, minimizing the water for 2,000 steps, minimizing the protein for 500 steps, and minimizing the protein and water for 1,000 steps. Production MD simulations were then run using a 2-fs time step; the nonbonded list was updated every 2–5 steps; and the nonbonded cut-off was 8 Å. Structures were saved every 0.2 ps for analysis, yielding 30,000 structures per simulation.
Results
We performed one native and two denaturation simulations of the B and E domains of protein A for a total of six simulations (Table 1). In addition, we performed two denaturation simulations of the 10–55 fragment of the B domain studied by Brooks and co-workers (19, 20), and one native simulation of the B-domain sequence modeled on the NMR structure of the Z domain, which we term the BZ domain. To check our initial BZ structure, we compared the B and BZ domains. The BZ domain had a lower in vacuo minimized energy (−1100 kcal vs. −700 kcal), fewer steric clashes, and fewer buried unsatisfied hydrogen bonds [as determined by using prove in the EMBL Heidelberg Evaluations Package (26–28)]. Unfortunately, the NMR constraint lists for the B domain are not available.
Table 1.
Overall properties of various protein A domains under various conditions
| Simulation* | 〈rmsd〉3-6 ns,† Å | 〈rmsd〉Final,† Å | 〈Rg〉3-6 ns,‡ Å | Rgmax,‡ Å | Helix stability§ |
|---|---|---|---|---|---|
| Native simulations | |||||
| E(298) | 1.7 (0.3) | 1.4 (0.1) | 11.2 (0.2) | 11.7 | All stable |
| B(298) | 2.5 (0.3) | 2.5 (0.2) | 12.0 (0.2) | 12.6 | All stable |
| BZ(298) | 2.2 (0.2) | 2.3 (0.2) | 11.3 (0.2) | 12.0 | All stable |
| Denaturation simulations | |||||
| E1(498) | 10.1 (1.9) | 14.0 (0.8) | 15.0 (1.5) | 19.7 | 3 ≫ 1 > 2 |
| E2(498) | 12.1 (1.9) | 12.9 (0.8) | 15.1 (2.0) | 20.7 | 3 ≫1 > 2 |
| B1(498) | 7.7 (1.0) | 7.5 (0.6) | 12.5 (0.8) | 14.7 | 3 ≫ 2 > 1 |
| B2(498) | 7.2 (0.5) | 7.8 (0.4) | 12.1 (0.2) | 13.9 | 3 > 2 > 1 |
| Bfrag1(498) | 6.5 (0.9) | 8.2 (0.4) | 10.6 (0.5) | 12.2 | 3 > 1 > 2 |
| Bfrag2(498) | 5.5 (0.8) | 4.9 (0.5) | 11.5 (0.8) | 16.4 | 3 ≫ 1 = 2 |
All simulations were performed for 6 ns. Numbers in parentheses are the thermodynamic temperature.
† rmsd from the starting structure, averaged between 3 and 6 ns, for the α carbons of residues 5–52 for the E domain and 8–57 for the B domain. The final value was averaged between 5.8 and 6.0 ns. Values in parentheses are SD.
‡ Radius of gyration was based on the positions of the α carbons and averaged between 3 and 6 ns. Values in parentheses are SD.
§Qualitative assessment of helix stability based on Fig. 2.
The Native State.
The E domain was well maintained at 298 K (Table 1, Fig. 6 in supplemental data at www.pnas.org). The rmsd from the minimized NMR starting structure averages 1.4 Å over the last 5.5 ns. Only the N and C termini (residues 1–6 and 54–56) and the loop between H2 and H3 displayed deviations along the sequence greater than 2 Å during that time period. In contrast, the loop between H1 and H2 deviated little from the starting structure. Similarly, the fluctuations about the mean structure were below 1 Å with the exception of the termini and the H2-H3 loop. The relative orientations of the helices were maintained.
The B domain deviated more from the starting structure than did the E domain, with an average rmsd of 2.4 Å over the last 5.5 ns. The largest deviations occurred in the loop between H2 and H3, and the (φ, ψ) angles of residues 38 and 39 changed by more than 60°. The rmsd in the BZ simulation was slightly lower, 2.0 Å. The difference between B and BZ was caused by lower values in H1 and in the aforementioned H2-H3 loop. It is worth noting that one of the major differences between the structures of the B and Z domains is within the H2-H3 loop.
The interhelical angles in the B and BZ domains fluctuated by approximately ±5° on a short time scale (0.5 ns) and drifted by 20–30° over the course of the simulation. This mobility has also been seen in the native basin of the free energy surface determined by Guo et al. (20). In contrast, the short-term fluctuations were smaller in the E domain and there was no obvious drift over the course of the simulation.
Denaturation Simulations.
Simulations under conditions where the protein is unstable (i.e., high temperature) can provide a gauge of the relative kinetic stabilities of different regions of the protein. Contour plots of fractional helical structure plotted against time and residue provide a graphical representation of helix stability (Fig. 2). The native helices are depicted as blue bands spanning a continuous segment of residues (along the y-axis). These bands tend toward magenta and then white with time (x-axis) as the helices unfold. For perspective, backbone traces of structures are presented in Fig. 3. There were common features to the behavior of the helices in all the denaturation simulations. H3 (the bottom of each individual plot in Fig. 2) had a noticeably higher percentage of helix. All of the helices partially unfold and refold over time (Figs. 2 and 3).
Figure 2.
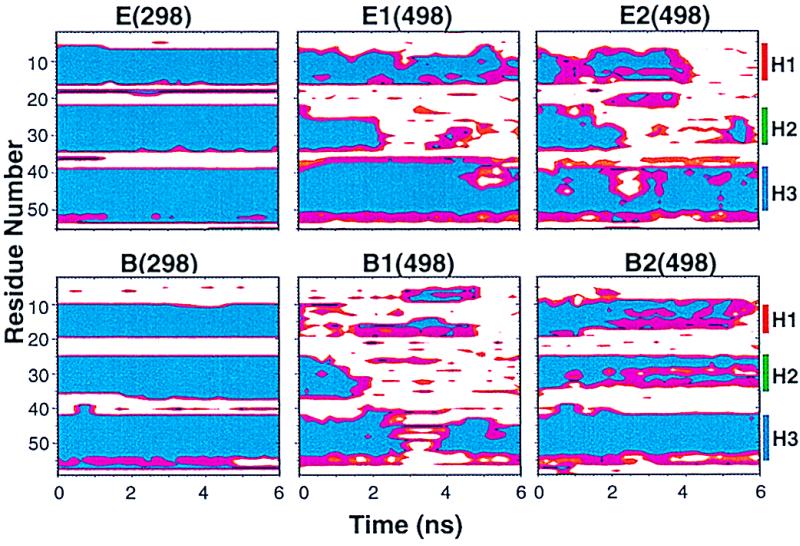
Local helical structures as a function of time during the simulations. The regions are colored according to helical content: blue, 80–100% α-helix; magenta, intermediate helicity, 50–80%; red, 30–50% α, white, 0–30% α. The time points were averaged over sequential 200-ps ranges, and the helicity was based on (φ, ψ) values (29). Note that the residue numbers increase going down the plot so that H1 is on the top.
Figure 3.

Ribbon diagrams of sequential 1-ns snapshots along the denaturation trajectories. Coloring is as in Fig. 1. The helical segments, shown as ribbons, were determined for each structure by using the Kabsch and Sander algorithm (30).
The unfolding process.
There was a progressive loss of helical structure first by H2 then by H1, while H3 retained helicity with some fluctuations throughout both of the E-domain simulations (Figs. 2 and 3). H2 regained helicity over time but only in the presence of contacts with other parts of the protein. H3 also had the highest helix content in the B domain. Unlike the E domain, however, H1 lost helicity at the same time or before H2. Simulations were also performed of a B-domain fragment (residues 10–55, Bfrag1 and -2), which provided results that were very similar to the full-length version: H3 persisted longer than H1 and H2 and the denatured state was compact (Table 1, Fig. 3). The simulations of the full-length proteins are discussed below to illustrate some of the important interactions observed.
E1(498).
Specific native tertiary contacts were replaced by more diffuse tertiary contacts early in the simulation, and the helices began to move independently (see the 2-ns structure in Fig. 3). Between 0.6 and 2.2 ns, H2 and H3 maintained helicity, but they separated and lost almost all side-chain contacts. Contacts remained between H1-H2 and H1-H3, but they were shifting and nonnative. H2 unfolded between 2.0 and 2.4 ns, unraveling from the N terminus. It regained two helical turns between 3.5 and 4.5 ns, aided by an interaction between Asp-4 and Lys-33. Forces exerted on the α carbon through the tertiary side-chain interactions facilitated (φ, ψ) transitions during the formation of those turns. The decrease in helicity of H1 between 5.2 and 5.5 ns was accompanied by H1 pulling away from H2. All the while H3 remained helical (Fig. 2).
E2(498).
As described above, specific native tertiary contacts were replaced by more diffuse contacts and the helices lost their native interhelical orientations and began to move independently in E2(498) (Fig. 3). H1 was more exposed to solvent in the early part of the trajectory, in contrast to its behavior in E1(498) (Fig. 3). The small gap seen in the contour plot of H3 (Fig. 2) at 1 ns occurred when the solvent-exposed residues Gly-44 and Glu-45 switched to β conformations. The conformational change results from the flexibility of the Gly, and the residues quickly switched back to helical conformations. The 1-ns E2(498) structure was similar to the 2.2-ns E1(498) structure in that the helices were mostly intact with similar orientations (Fig. 3).
At 1.5 ns, the movement of H1 with respect to H2 caused a turn to be lost from the N terminus of H2, but at the same time, some of the residues in the loop between H1 and H2 adopted helical character. A single turn of a helix formed in the loop by 2.5 ns, as the carbonyl oxygens of residues 18 and 19 hydrogen bonded to the HN groups of residues 22 and 23. Steric interactions between Val-42 and Leu-43 caused the gap in H3 at 2.5 ns.
The reformation of H2 around 5 ns (Figs. 2 and 3) was accompanied by dramatic conformational changes. The protein refolded to a compact state, in which H2 and H3 were almost completely intact (Figs. 3 and 4). In contrast, H1 was less helical, and the (φ, ψ) angles of successive residues in that segment alternated between α and β conformations. The helical segments were aligned similarly to the native state but with different topology (Fig. 4). When one looks at the native state from the N terminus, H1, H2 and H3 follow a clockwise path, whereas the path runs counterclockwise in the 5.3-ns compact state. The overall sequence of events in the formation of that compact state can be summarized as follows. Initially, only H3 was relatively intact. When polar side-chain contacts formed between residues 30 and 38, the nonhelical H2 segment was brought close to H3. These segments were held together by a dynamic cluster of side chains (see side-chain contact map for 4.6 ns, Fig. 4). The interactions between H3 (helical) and the H2 segment aided in the formation of helical structure in H2 by facilitating (φ, ψ) transitions, yielding ≈75% reformation of H2 (Fig. 4) over the next 0.7 ns. As a result, a larger hydrophobic core formed, including residues from the H1 segment. This compact structure subsequently expanded, and H1 and H2 unraveled between 5.4 and 6 ns.
Figure 4.
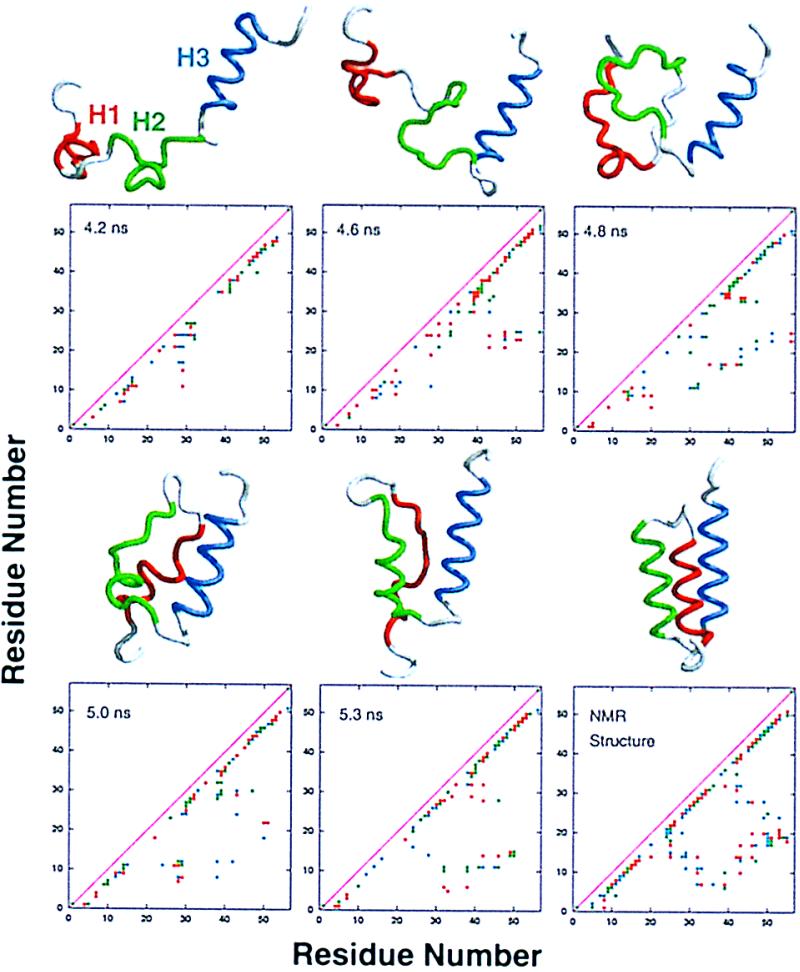
Structures and side-chain contact maps for the collapse sequence and contact-assisted helix formation between 4.2 and 5.3 ns of the E2(498) simulation. The contact maps are colored as follows: 1–3 contacts per residue, green; 4–10 contacts per residue, red; >11 contacts per residue, blue. A contact cutoff distance of 6.4 Å was used and is based on the frequencies of carbon–carbon side-chain contacts in the crystal structures of 1bpi, 1hcr, 1slt, and 1ubq, which had a maximum at 5.8 Å and a minimum at about 6.4 Å (data not presented).
B1(498).
By 0.2 ns of the B1(498) simulation the helices began to separate and H1 was lost. The native salt bridge between Glu-16 and Lys-50 was important in this early disruption of H1; as the helices began shifting, the attachment of residue 16 to H3 put strain on the central residues in H1. This effect was compounded by a nonnative electrostatic interaction between Glu-9 and Lys-50, which caused a bulge in H1 between residues 9 and 16. Interestingly, this effect was specific to the B domain, since the salt bridges were not possible in the E domain, where both residues 9 and 50 are Gln (Fig. 1). Around 1.1 ns, H2 lost a turn from its N terminus. This fraying relieved some of the tension on the C terminus of the H1 segment, allowing one turn of H1 to reform. The turn at the N terminus of H3 also reformed at ≈1.7 ns as the C terminus of H2 was able to approach H3. From 2–3 ns, H3 lost most of its helical structure and H1 regained some helicity at its N terminus. From this time on, two clusters of charged residues formed, consisting of (i) Lys-8, Glu-9, Glu-16, and Lys-50 and (ii) Asp-3, Lys-5, Glu-48, and Lys-51. Most of these residues are not conserved between the B and E domains (Fig. 1).
B2(498).
H2 lost a turn from its C terminus almost immediately, and by 1.5 ns, H2 pulled away from H1 and H3, but H1 and H3 remained in contact. At this time, a dynamic cluster of ionic residues (involving residues 1–5 and 37–39) formed and persisted the duration of the simulation. The native salt bridge between Glu-16 and Lys-50 also persisted except for two brief time periods (1.0–1.2 ns and 4.0–4.2 ns), in which a maximum separation of 13 Å occurred. H1 finally lost helix content after 4 ns while it was still in contact with H3. Although H3 was distorted, it remained partially helical throughout. In addition, a third B-domain simulation was performed that is entirely consistent with these two simulations (data not presented).
Bfrag(498).
The results of the simulations of the 10–55 fragment are very similar to those for the full-length protein (Fig. 3, Table 1). The unfolded states were constrained to small radii of gyration by interactions between residues near the N and C termini, and H3 was persistent. Residues Phe-14, Glu-16, His-19, and Leu-45, Leu-46, Lys-50, and Lys-51 all contributed to long-lived tertiary contacts, and most of those residues differ in the B and E domains.
The unfolded states.
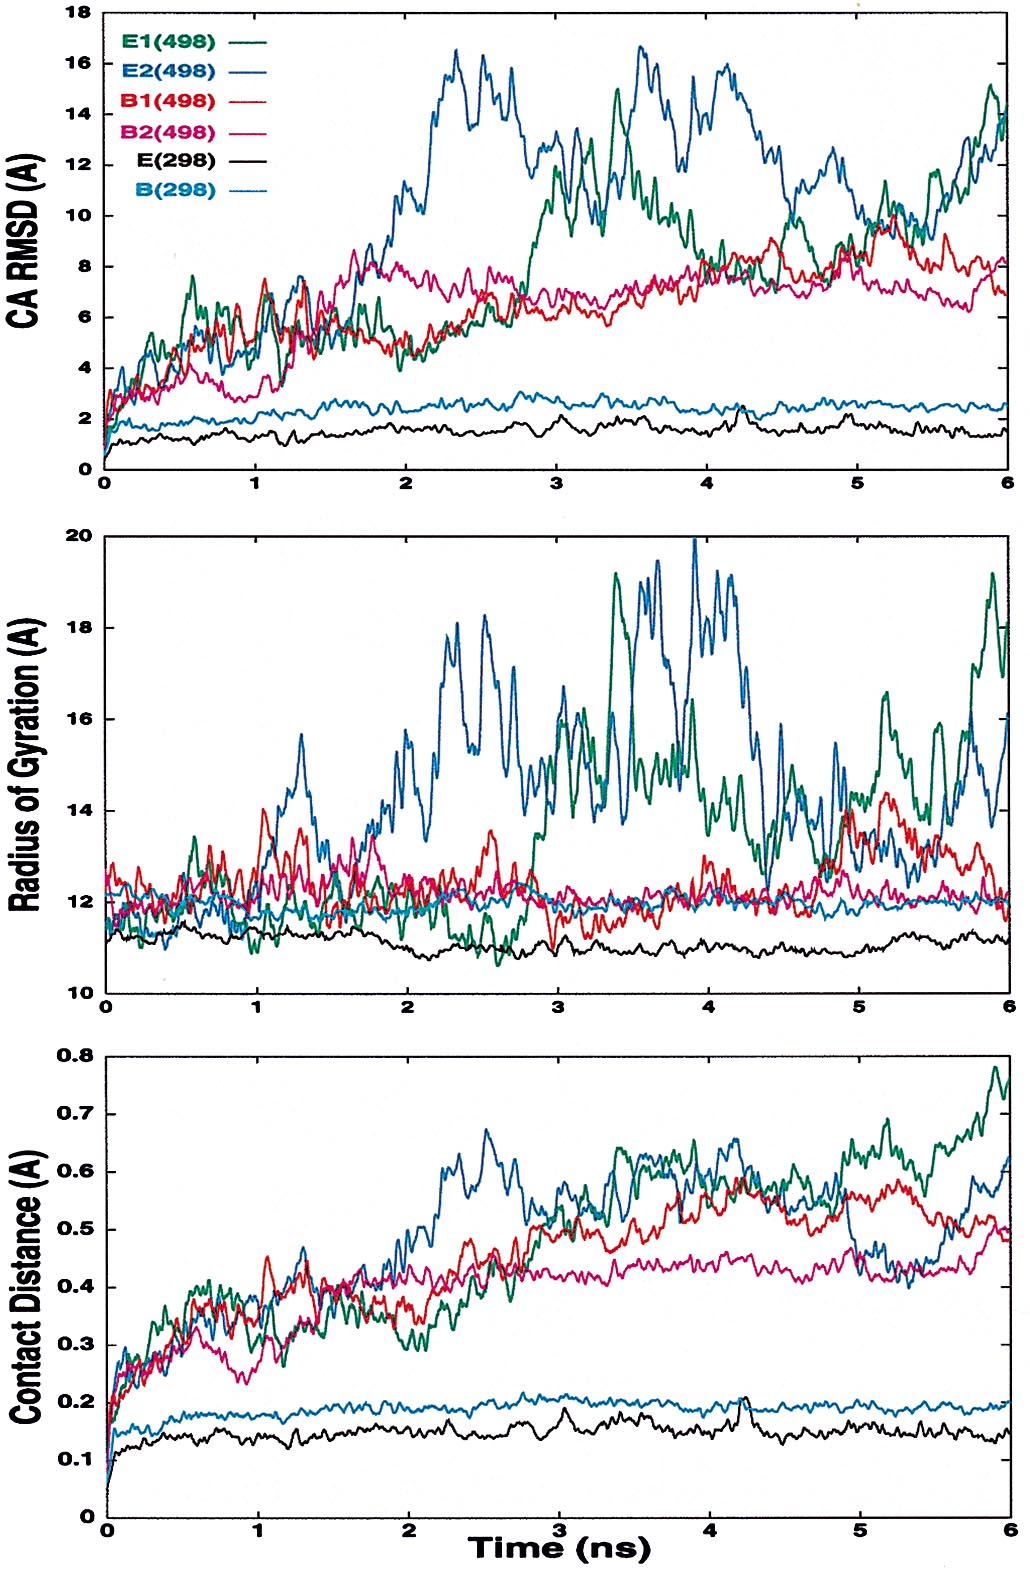
Both B-domain denaturation simulations remain more compact than the corresponding E-domain simulations (Table 1 and Table 2, which is in supplemental data at www.pnas.org). However, the B domain is very nonnative, as judged by rmsd to the starting structure and a contact-based distance (32) (Fig. 6 in supplemental data at www.pnas.org). Because of the compact nature of the unfolded state of the B domain and the lack of correlation with helical content, the radius of gyration is a poor reaction coordinate for folding/unfolding, and it is only marginally better for the more expanded E domain (Fig. 5).
Figure 5.

Relationship between radius of gyration and helical structure (29). All 30,000 structures for each simulation are plotted.
The transition state of unfolding.
We identified transition states in the simulations by using a conformational clustering procedure described previously (33–35). Calculated properties for the transition state ensembles are given in Table 2 (in supplemental data at www.pnas.org). The identified transition states for the E domain are native-like; more than 70% of the native contacts are present, and all the helices are greater than 80% intact as determined by either hydrogen bonding or (φ, ψ) analysis. There are lower percentages of native contacts in the B domain (63%), but the comparable percentage of total contacts reflects the tendency of the B domain to remain compact. The behavior of the helices in the transition state ensemble of the B domain is more heterogeneous than the E domain. Although two helices are intact and one is unfolded in both B-domain simulations, in one simulation H1 is disrupted whereas in the other simulation H2 is unfolded (Table 2 in supplemental data).
Discussion
Four conclusions can be drawn from the results presented here: the B, E, and BZ domains of protein A are stable in simulations at 298 K; H3 is the most persistent helix under denaturing conditions; the relative stabilities of H1 and H2 depend on which domain is considered; and the B domain adopts a more compact unfolded state than does the E domain.
The stability of the native state of the E domain is illustrated by the low Cα rmsd from the starting structure over the 6 ns of simulation, with an average value of 1.4 Å between 5.8 and 6.0 ns. The rmsd was significantly higher in the native simulation of the B domain (2.4 Å), but it is still comparable to many “good” native simulations. Other authors have commented on the differences between the NMR structures of the 93% homologous Z and B domains (10). Our results suggest that the published structure for the Z domain represents a reasonable, if not better, structure for the B domain under these conditions. However, the native state of the B domain may be highly dynamic, and thus both structures might be consistent with the native ensemble.
Experimentally the B domain is more stable than the E domain, and in our simulations the B domain had a more dynamic native state and more compact denatured state than the E domain. The difference in native dynamics could result from different quality starting structures, but the BZ domain was also more mobile. The B domain samples unfolded states as different from the native state as those sampled by the E domain (Fig. 6 at www.pnas.org); however, the B domain is constrained by interactions between residues not present in the E domain (e.g., residues 8, 9, 16, 19, 48, 50, and 51). These observations suggest that the native B domain is stabilized entropically by the increased dynamics of the native state and the decreased conformational entropy of the unfolded state.
H3 clearly persisted longer in all of the high-temperature simulations, leading to the conclusion that it is the most stable helix (Fig. 2). The relative stability of H3 is consistent with experiments showing that the H3 fragment forms the most stable helix in isolation (12). H2 and H3 are more stable to hydrogen exchange than H1 in equilibrium experiments of the full-length protein (12), which is also consistent with experimental results of Bottomley et al. (14) on the full-length protein. In truncation experiments, H3 is also required for the stability of the B domain, and its deletion eliminates the helical CD signal and binding to Fc (3). On the basis of the simulations, we predict that H3 is present as fluctuating residual structure in the unfolded state.
Experimental studies of the B domain have failed to detect a folding intermediate, and native-like protection of the protein is observed within the 6-ms mixing time (12). These experimental results do not support the premise that a particular segment (i.e., H3) of the protein has special importance along the folding pathway. However, these experiments cannot distinguish events that occur faster than the dead time (6 ms), and no investigation of residual structure in the denatured state was reported. Considering the stability of H3 in simulations and experiment and the formation of the collapsed nonnative topomer in the E1(498) simulation, H3 is probably present in unfolded states or forms most rapidly during refolding but is fluctuating enough not to be protected from hydrogen exchange. This incipient nucleus can serve as a structural scaffold upon which other portions of the molecule may then interact with concomitant formation of additional helical structure (Fig. 4). During this phase of structure formation, transitions in (φ, ψ) angles in one portion of the molecule can be facilitated by tertiary interactions with other portions of the molecule. Thus, the (φ, ψ) search rate may be faster than the (φ, ψ) search rate of an isolated amino acid. This provides a mechanism for contact-assisted helix formation, as observed for barnase (36, 37). In the particular example of this effect presented here, H3 aided in the refolding of H2 (Fig. 4). Interestingly, experiment also suggests that there may be synergy between these regions. For example, H3 is 30% helical as an isolated fragment probed by CD, whereas H1 and H2 are 0% helical (12). An H2-H3 fragment contains 50% helix, but the H1-H2 fragment remains at 0%.
Our results confirm the structural importance of H3 to the stability of the protein, but this leads to a paradox with respect to protein design. H3 is the most important helix structurally; however, in this specific case, biological activity resides in the other two helices (3). H3 seems to exist as a scaffold for those helices. Previous all-atom simulations of the B-domain fragment predict that: H3 forms only after the H1 and H2 helices, H3 is unfolded in the transition state, and only 30% of the native contacts are formed in the transition state (ref. 20; note that actual contacts were not calculated and instead are based on side-chain center-of-mass separation). In contrast, the results presented here predict that: H3 forms early and is partially structured in the denatured state; and 63–76% of the native contacts, depending on the domain, are made in the transition state. For comparison, Wolynes and co-workers predict that 60% of the native contacts are made in a low-resolution model of the protein A transition state (18). In agreement with Brooks and co-workers, Zhou and Karplus (17) obtain a transition state with 30–50% of the native tertiary contacts when they use an off-lattice model of protein A. However, they also predict a small free energy barrier near the native state with 87% of the native contacts. The experimental stability of H3 as a fragment and the work of Bottomley et al. (14) on the full protein suggest that H3 forms early in folding. The discrepancy between the work of Brooks and co-workers and the overall picture provided by the simulations presented here and the experimental results call to light an important question. Among other possible explanations, the differences could arise because protein folding is more sequential at a molecular level than a path predicted by a sparsely sampled thermodynamic surface. In general, all-atom MD of folding/unfolding is better suited to investigating kinetic as opposed to thermodynamic properties, which require much more extensive sampling. Also, our studies indicate that the radius of gyration (and therefore contacts, as well) is a poor reaction coordinate (Fig. 5). Thus, the use of this reaction coordinate for their free energy calculations could contribute to discrepancies. But, we also note that there are similarities between our work and that of Brooks and co-workers (19, 20), and further more detailed experimental studies would help to shed light on the origin of the differences.
Supplementary Material
Acknowledgments
We thank Drs. M. Starovasnik, W. Fairbrother, and J. Wells for providing the E-domain NMR structure and for helpful comments. We thank Drs. C. Brooks and M. Karplus for comments on the manuscript. We are grateful for financial support from the Office of Naval Research (N00014-95-1-0484, N00014-96-1-1093, and N00014-98-1-0477).
Abbreviations
- MD
molecular dynamics
- rmsd
root-mean-square deviation
Footnotes
This paper was submitted directly (Track II) to the PNAS office.
References
- 1.Moks T, Abrahamsen L, Nilsson B, Hellman U, Sjoquist J, Uhlen M. Eur J Biochem. 1987;156:637–643. doi: 10.1111/j.1432-1033.1986.tb09625.x. [DOI] [PubMed] [Google Scholar]
- 2.Stahl S, Nygren P A. Pathol Biol. 1997;45:66–76. [PubMed] [Google Scholar]
- 3.Braisted A C, Wells J A. Proc Natl Acad Sci USA. 1996;93:5688–5692. doi: 10.1073/pnas.93.12.5688. [DOI] [PMC free article] [PubMed] [Google Scholar]
- 4.Cunningham B C, Wells J A. Curr Opin Struct Biol. 1997;7:457–463. doi: 10.1016/s0959-440x(97)80107-8. [DOI] [PubMed] [Google Scholar]
- 5.Starovasnik M A, Braisted A C, Wells J A. Proc Natl Acad Sci USA. 1997;94:10080–10085. doi: 10.1073/pnas.94.19.10080. [DOI] [PMC free article] [PubMed] [Google Scholar]
- 6.Starovasnik M A, Skelton N J, O'Connell M P, Kelley R F, Reilly D, Fairbrother W J. Biochemistry. 1996;35:1558–15569. doi: 10.1021/bi961409x. [DOI] [PubMed] [Google Scholar]
- 7.Tashiro M, Montelione G T. Curr Opin Struct Biol. 1995;5:471–481. doi: 10.1016/0959-440x(95)80031-x. [DOI] [PubMed] [Google Scholar]
- 8.Gouda H, Torigoe H, Saito A, Sato M, Arata Y, Shimada I. Biochemistry. 1992;31:9665–9672. doi: 10.1021/bi00155a020. [DOI] [PubMed] [Google Scholar]
- 9.Tashiro M, Tejero R, Zimmerman D E, Celda B, Nilsson B, Montelione G T. J Mol Biol. 1997;272:573–590. doi: 10.1006/jmbi.1997.1265. [DOI] [PubMed] [Google Scholar]
- 10.Myers E W, Miller W. Comp Appl Biosci. 1988;4:11–17. doi: 10.1093/bioinformatics/4.1.11. [DOI] [PubMed] [Google Scholar]
- 11.Jendeberg L, Tashiro M, Tejero R, Lyons B A, Uhlen M, Montelione G, Nilsson B. Biochemistry. 1996;35:22–31. doi: 10.1021/bi9512814. [DOI] [PubMed] [Google Scholar]
- 12.Bai Y, Karimi A, Dyson J, Wright P E. Protein Sci. 1997;6:1449–1457. doi: 10.1002/pro.5560060709. [DOI] [PMC free article] [PubMed] [Google Scholar]
- 13.Cedergren L, Andersson R, Jansson B, Uhlen M, Nilsson B. Protein Eng. 1993;6:441–448. doi: 10.1093/protein/6.4.441. [DOI] [PubMed] [Google Scholar]
- 14.Bottomley S P, Popplewell A G, Seawen M, Wan T, Sutton B J, Gore M G. Prot Eng. 1994;7:1463–1470. doi: 10.1093/protein/7.12.1463. [DOI] [PubMed] [Google Scholar]
- 15.Kolinski A, Skolnick J. Proteins Struct Funct Genet. 1996;18:338–366. [Google Scholar]
- 16.Olszewski K, Kolinski A, Skolnick J. Proteins Struct Funct Genet. 1996;25:286–299. doi: 10.1002/(SICI)1097-0134(199607)25:3<286::AID-PROT2>3.0.CO;2-E. [DOI] [PubMed] [Google Scholar]
- 17.Zhou Y, Karplus M. Proc Natl Acad Sci USA. 1997;94:14429–14432. doi: 10.1073/pnas.94.26.14429. [DOI] [PMC free article] [PubMed] [Google Scholar]
- 18.Onuchic J N, Socci N D, Luthey-Schulten A, Wolynes P G. Folding Des. 1996;1:441–450. doi: 10.1016/S1359-0278(96)00060-0. [DOI] [PubMed] [Google Scholar]
- 19.Boczko E M, Brooks C L. Science. 1995;269:393–396. doi: 10.1126/science.7618103. [DOI] [PubMed] [Google Scholar]
- 20.Guo Z, Brooks C L, Boczko E M. Proc Natl Acad Sci USA. 1997;94:10161–10166. doi: 10.1073/pnas.94.19.10161. [DOI] [PMC free article] [PubMed] [Google Scholar]
- 21.Levitt M. encad, Energy Calculation and Dynamicsa. Stanford Univ. Stanford, CA, and Yeda, Rehovat, Israel: Molecular Applications Group; 1990. [Google Scholar]
- 22.Levitt M, Hirshberg M, Sharon R, Daggett V. Comput Phys Commun. 1995;91:215–231. [Google Scholar]
- 23.Levitt M, Hirshberg M, Sharon R, Laidig K E, Daggett V. J Phys Chem. 1997;101:694–698. [Google Scholar]
- 24.Kell G S. J Chem Eng Data. 1967;12:66–69. [Google Scholar]
- 25.Haar L, Gallagher J S, Kell G S. NBS/NRC Steam Tables. Washington, DC: Hemisphere; 1984. [Google Scholar]
- 26.Pontius J, Richelle J, Wodak S J. J Mol Biol. 1996;264:121–136. doi: 10.1006/jmbi.1996.0628. [DOI] [PubMed] [Google Scholar]
- 27.Vriend G. J Mol Graph. 1990;8:52–56. doi: 10.1016/0263-7855(90)80070-v. [DOI] [PubMed] [Google Scholar]
- 28.Hooft R W W, Vriend G, Sander C. J Appl Cryst. 1994;27:1006–1009. [Google Scholar]
- 29.Daggett V, Kuntz I D, Kollman P A. Biopolymers. 1991;31:1115–1134. doi: 10.1002/bip.360310911. [DOI] [PubMed] [Google Scholar]
- 30.Kabsch W, Sander C. Biopolymers. 1983;22:2577–2637. doi: 10.1002/bip.360221211. [DOI] [PubMed] [Google Scholar]
- 31.Hubbard S J, Thornton J M. naccess. University College, London: Dept. Biochem. and Mol. Biol.; 1993. [Google Scholar]
- 32.Yee D, Dill K A. Protein Sci. 1993;2:884–899. doi: 10.1002/pro.5560020603. [DOI] [PMC free article] [PubMed] [Google Scholar]
- 33.Li A, Daggett V. Proc Natl Acad Sci USA. 1994;91:10430–10434. doi: 10.1073/pnas.91.22.10430. [DOI] [PMC free article] [PubMed] [Google Scholar]
- 34.Li A, Daggett V. J Mol Biol. 1996;257:412–429. doi: 10.1006/jmbi.1996.0172. [DOI] [PubMed] [Google Scholar]
- 35.Daggett V, Li A, Fersht A R. J Am Chem Soc. 1998;120:12740–12754. [Google Scholar]
- 36.Bond C, Wong K, Clarke J, Fersht A R, Daggett V. Proc Natl Acad Sci USA. 1997;94:13409–13413. doi: 10.1073/pnas.94.25.13409. [DOI] [PMC free article] [PubMed] [Google Scholar]
- 37.Wong, K.-B., Clarke, J., Bond, C. J., Neira, J. L., Freund, S. M. V., Fersht, A. R. & Daggett, V. (2000) J. Mol. Biol., in press. [DOI] [PubMed]
Associated Data
This section collects any data citations, data availability statements, or supplementary materials included in this article.