

Abstract
Brain-mapping techniques have proven to be vital in understanding the molecular, cellular, and functional mechanisms of recovery after stroke. This article briefly summarizes the current molecular and functional concepts of stroke recovery and addresses how various neuroimaging techniques can be used to observe these changes. The authors provide an overview of various techniques including diffusion-tensor imaging (DTI), magnetic resonance spectroscopy (MRS), ligand-based positron emission tomography (PET), single-photon emission computed tomography (SPECT), regional cerebral blood flow (rCBF) and regional metabolic rate of glucose (rCMRglc) PET and SPECT, functional magnetic resonance imaging (fMRI), near infrared spectroscopy (NIRS), electroencephalography (EEG), magnetoencephalography (MEG), and transcranial magnetic stimulation (TMS). Discussion in the context of poststroke recovery research informs about the applications and limitations of the techniques in the area of rehabilitation research. The authors also provide suggestions on using these techniques in tandem to more thoroughly address the outstanding questions in the field.
Keywords: DTI, EEG, fMRI, MEG, NIRS, PET, poststroke recovery, rehabilitation, SPECT, stroke, TMS
Stroke affects over 780,000 people each year in the United States. Further, in 1999 more than 1,100,000 Americans reported negative impact of stroke on their daily lives including significant functional limitations.1 Major efforts are underway to find better ways to improve the outcomes of stroke in the motor and cognitive arenas. Despite these efforts, many patients experience insufficient or only partial recovery; they are left with significant functional and/or cognitive deficits. Recent developments in neuroimaging have shed light on the reasons why some patients recover well while some do poorly. Although major progress in poststroke recovery research has been made with help from brain-mapping techniques, there are many obstacles that need to be addressed before we can develop better and more effective strategies that address the needs of stroke victims.
There is no consensus on the exact mechanisms involved in regaining the functions lost due to stroke. Major routes that have been implicated include changes at the molecular and cellular levels in the periinfarct and remote brain areas, involvement of the contralateral homologues via unmasking of the previously inhibited connections, and recruitment of other compensatory brain areas.2–12 This review will focus on neuroimaging techniques that can be used to study these cellular and functional mechanisms of poststroke recovery.
In the healthy brain, mechanisms that inhibit axonal sprouting predominate. Inhibition of axonal sprouting is controlled by myelin-associated proteins, extracellular matrix proteins, and growth cone inhibitors. These growth-inhibiting factors continue to be expressed in traumatic brain injury but not in stroke. However, ischemic neuronal injury induces axonal sprouting.6,10 In rodent models of stroke, ischemia initiates the formation of a glial scar directly adjacent to the damaged area in which numerous neurotrophic factors are expressed.2,4,13–15 Bordering this glial scar is a larger “growth-permissive zone” of the periinfarct cortex that expresses reduced levels of growth-inhibiting factors.4,5 In some human neuroimaging studies, increased signal in the periinfarct zone correlates with good functional recovery.16 According to experimental models of stroke, this improved recovery may be due to axonal sprouting.5
Variability in poststroke recovery has been suggested to be due, in part, to the influence of the directionality of axonal sprouting through activation of task-specific cortical areas. These experiences may help determine the destination of newly sprouting axons.2,3 For example, ischemic lesions in the adult rat cortex induce axonal sprouting that follows a specific biological time course; sprouting is “triggered” at 1–3 days after insult, “initiation and maintenance” of the sprouting response occurs between 7–14 days after insult, and at 28 days after stroke formation of new patterns of connections can be observed.4,5
Most evidence indicates that functional recovery after stroke occurs primarily through reorganization of cortical activity in the vicinity of or connected to the infarct.4 Recent studies also suggest that recovery of motor function may involve alteration of intracortical wiring patterns. One potential role of these novel wiring patterns may be the recruitment of compensatory areas or areas of the brain that are not directly related to the damaged area. For example, Dancause et al. found evidence not only of axonal sprouting but also of the establishment of novel connections distant to the lesion and intracortical connections with the site of cortical injury.2,10 Further, Chen et al. have shown purine nucleoside inosine-stimulated projections from undamaged cortex into denervated regions of the mid-brain and spinal cord. This expansion coincides with improved behavioral performance.11 The results of human neuroimaging studies mirror the results of animal studies suggesting the formation of new connections between the periinfarct cortex and the premotor, motor, and somatosensory cortical areas.17–20 Further, in patients with subcortical stroke, the pattern of recovery first involves activation of both hemispheres of the cortex to sensory or motor stimulation of the affected limb, followed by reorganization and restriction of the activation pattern to the infarcted hemisphere, contralateral to the affected limb.21 This reorganization is accompanied by increased activity in the supplementary motor areas of the damaged side.
Mechanisms of poststroke language recovery appear to be similar to the recovery after motor stroke; there is evidence of periinfarct zone and contralateral homologue contributions to language recovery. Saur et al. suggest that language reorganization after stroke occurs in three phases.9 First, there is reduced activation of remaining areas followed by upregulation of the entire language network, including contralesional homologues, and eventual “normalization of activation” or re-shifting of activation to the hemisphere affected by stroke. It is not clear if this finding is affected by the size of the lesion, because larger areas of damage were found to be associated with increased activation of the contralateral cortex. However, in some patients, improvement in language function after stroke relates to contralateral shift and not periinfarct zone recovery.22 Recent studies in younger patients who suffered peri- or prenatal stroke in the dominant left hemisphere show that recovery of language functions after stroke may result from transfer of these functions to the contralesional, healthy homologues.12,23 For example, Tillema et al. show that activation of anatomically identical areas in the unaffected hemisphere follows perinatal left middle cerebral artery stroke.12 This mechanism may be specific to children; adults do not recover after stroke as well as children and are usually left with more deficits24 despite reliable shifts of the language-related functional magnetic resonance imaging (fMRI) signal to the contralateral homologues.25,26 In the case of adults, the recovery of function may depend more on the periinfarct areas than in children.16 Further support for this age difference arises from functional neuroimaging studies showing that language in children becomes more left-hemispheric with age.27–29
As this brief overview suggests, multiple mechanisms may exist for recovery of function after stroke. Evidence shows that recovery depends on the involvement of areas unaffected by stroke, either proximal to the damaged areas or in contralateral homologues. Among the many variables that influence recovery, the ones discussed here include the age at the time of the stroke, the size of the stroke, and the poststroke environment, including training or therapy.
Brain-mapping techniques have dual roles in tracking recovery after stroke. They provide information about the cellular and molecular processes arising naturally during stroke recovery and allow for the investigation of poststroke brain plasticity that may result from therapeutic interventions. Although functional changes are likely an expression of underlying cellular changes, here we define functional changes to be those that are observed either by manipulating behavior during brain mapping or by measuring regional brain metabolism if no task is being performed. The cellular and molecular mechanisms discussed previously – dendritic sprouting, axonal regrowth, and cell migration – would change the microscopic structure of brain tissue. Magnetic resonance spectroscopy (MRS), diffusion-tensor imaging (DTI), and ligand-based positron emission tomography (PET) or single-photon emission computed tomography (SPECT) techniques can provide insight into these cellular processes. DTI enables the visualization of white matter fiber tracts and the quantification of fiber tract integrity.30 MRS allows for the detection and quantification of specific biochemicals in the brain, including a limited number of compounds with either a hydrogen (proton) or phosphorus spectroscopic signature. Finally, PET and SPECT offer the opportunity to investigate the binding of specific neurotransmitter-like ligands to cell surface proteins, such as the GABA receptor or the dopamine transporter.
Brain-mapping techniques that measure brain function during recovery and rehabilitation include regional cerebral blood flow (rCBF), regional metabolic rate of glucose (rCMRglc) PET or SPECT, fMRI, near infrared spectroscopy (NIRS), electroencephalography (EEG), magnetoencephalography (MEG), and transcranial magnetic stimulation (TMS). The word function, as used here, implies either the manipulation of a person’s behavior in order to influence signal amplitude or the measurement of regional blood flow or metabolism in the absence of behavioral manipulations. In either case, the signal is assumed to relate to the ability of nearby neurons to process information, that is, to function. The way in which brain function is assessed depends upon the technique in question. For fMRI, function is assessed by measuring changes in blood flow that vary with the changing metabolic demands of neurons nearby. PET can measure not only blood flow but also oxygen and sugar metabolism directly. TMS can be used to determine the electrical excitability of brain tissue by measuring the muscular response to stimulation. EEG and MEG measure an electrical or magnetic signature of cortical pyramidal neuron excitation. NIRS senses the variation in intracranial absorption and reflectance of two specific near-infrared wavelengths of visible light, which are differentially absorbed by oxy- and deoxy-hemoglobin. Roughly speaking, fMRI, PET, and NIRS measure blood flow–related signals, whereas EEG and MEG record brain electrical activity and TMS directly induces brain electrical activity.
The specific research question dictates the experimenter’s choice of technique. Brain condition can be examined at one or more points during rehabilitation or recovery; three basic approaches exist. The first approach involves assessing the severity of brain injury at the outset of the experiment as a predictor of recovery or rehabilitation success. For example, TMS resting motor threshold at 24 hours following a stroke has been shown to predict the degree of recovery, with normal resting thresholds predicting good outcome and abnormal thresholds predicting poor outcome.31 The second approach assesses brain function at study termination to define attributes associated with better or worse outcomes, that is, markers of recovery.19 In the third approach, by combining before and after measurements, one can identify longitudinal changes that track recovery.29,32 The study of stroke rehabilitation is relatively new, having suffered from the longstanding view that lost functions were not recoverable. The field is rapidly evolving, but there are few standardized approaches to the use of brain-mapping methods. This article is intended to illustrate ways in which several widely used brain-mapping techniques may aid stroke rehabilitation research.
Details of Cellular and Molecular Techniques
DTI
DTI allows for the visualization of white matter fibers and the quantification of white matter tract integrity. In essence, this technique estimates the directional structure of white matter fiber tracts, that is, the restriction to free diffusion of water in all directions (Figure 1). This relatively new MRI technique can be used to investigate poststroke brain plasticity by assessing structural changes in white matter fiber tracts following stroke and the relationship of these changes to functional recovery. The premise of this technique is based on the fact that, in an unobstructed sphere, water diffuses equally in all directions or isotropically. DTI quantifies the difference in directionality of the diffusion experienced by water molecules with respect to the white matter fiber tracts or the degree of diffusion anisotropy. Water molecules diffuse more freely along white matter fiber tracts and through the nerve cell axons than orthogonal to the tracts, where neuron and glial cell walls obstruct passage (high diffusion anisotropy; Figure 1A).30,33,34 The tensor theory is used in DTI to characterize the molecular diffusion of water in white matter. A tensor is a mathematical construct describing the three-dimensional properties of an ellipsoid (Figure 1B). In DTI, diffusion measurements are taken in multiple directions, and tensor decomposition is used to calculate the diffusivities that are parallel and orthogonal to the white matter fibers. These diffusivity measures are expressed using various indices such as the mean diffusivity, also referred to as trace, apparent diffusion coefficient (ADC), or trace apparent diffusion coefficient (trADC). trADC reflects average level of water diffusion in all directions in a voxel; fractional anisotropy (FA) reflects the directionality of water diffusion or the degree of anisotropy in a voxel.33,35,36 In white matter, diffusion anisotropy is high (high FA values); but in gray matter and cerebrospinal fluid (CSF), diffusivity is similar in all directions and diffusion anisotropy is low (low FA values). A reduction of a previously high fractional anisotropy reflects a decline in white matter tract integrity.37
Figure 1.
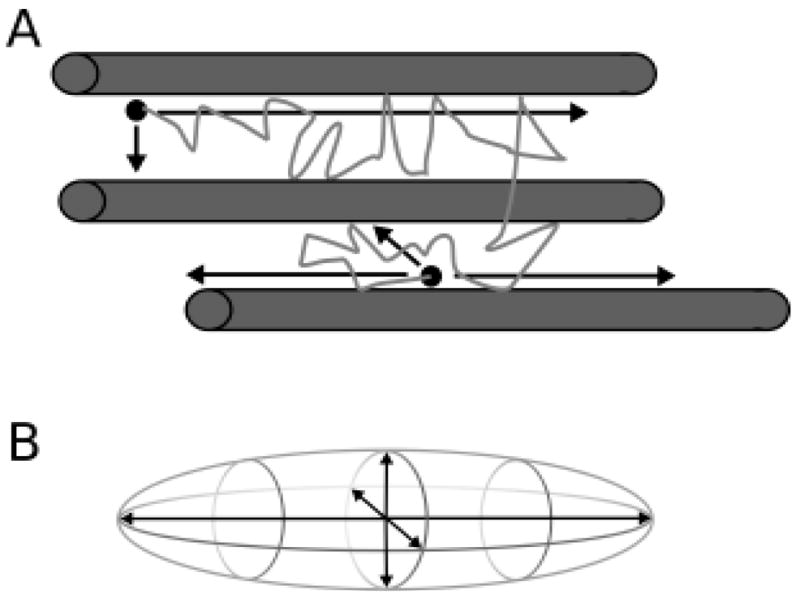
Depiction of water molecule movement. (A) Water molecule (black dots) diffuse more freely along white matter tracts (gray cylinders) than across them, where passage is less restricted, as represented by the black arrows and path of the water molecule. (B) Diffusion of water molecules can be quantified using the three-dimensional properties of an ellipsoid.
Following stroke, focal reductions in white matter tract integrity result in FA value asymmetries between the two hemispheres38–44 and in reduced FA values in patients compared to matched regions in control subjects.45–48 Observations of poststroke reductions in diffusion anisotropy are used to investigate axonal damage and its ability to predict functional recovery. DTI studies performed at multiple times following stroke report retrograde and/or anterograde degeneration within the corticospinal tract, as indicated by the progressive decrease in FA.38,42,44,47 Reductions in FA are negatively correlated with reductions in neurological deficits and improved motor functions.38,42,47 Furthermore, reduced FA values in the affected hemisphere (compared to the unaffected hemisphere) within 2–4 weeks of stroke onset are associated with poor motor recovery 3 months post stroke, indicating that the degree of FA reduction may be predictive of motor function outcome.38,41,44,45,49
Thalamic hypometabolism and cortico-spinal tract integrity also are associated with poststroke motor recovery.50 Herve et al. performed DTI at 1 week and 6 months following stroke to investigate changes in thalamic metabolism associated with infarcts of the middle cerebral artery.51 They report increased mean diffusivity in the ipsilateral thalamus located away from the infarct site but no corresponding change in FA, which may be due to a lack of fiber bundles oriented in parallel within the thalamus. These authors also note a trend toward reduction in ipsilateral thalamic volume,51 consistent with previous investigations reporting progressive atrophy of the ipsilateral thalamus.52,53 However, future studies are necessary to elucidate the role that poststroke alterations in thalamic diffusivity have in relation to motor recovery.
A handful of studies have also used DTI to study poststroke aphasia, which occurs in about 20%–50% of stroke patients.54,55 A case study by Selnes et al. reports no impairments in language repetition or comprehension in a patient with a left arcuate fasciculus lesion as determined by DTI 2 years following stroke.56 However, in a larger study of 27 patients who had suffered from left hemisphere stroke, Breier et al. finds that lower FA values in the superior longitudinal and arcuate fasciculi of the left hemisphere correlate with decreased ability to repeat spoken language and that lower FA values in the left arcuate fasciculus also correlate with deficits in comprehension.57 Given the high prevalence of language dysfunction that occurs following stroke, the relationship between DTI measures and poststroke aphasia warrants further investigation.
In addition to quantifying the architectural integrity of white matter tracts and other brain tissues, DTI tractography allows for the visualization of the directionality of different fiber systems in two dimensions by using a color convention such as red, green, and blue to represent fibers crossing from left to right, anterior to posterior, and inferior to superior, respectively,58 as well as the three-dimensional reconstruction of white matter tracts (see refs. 35 and 57 for review). Researchers use DTI tractography to investigate different types of fiber tract damage resulting from stroke and how different types of damage can affect or predict functional recovery. Cho et al. performed DTI within 7–30 days following stroke and used DTI tractography to categorize corticospinal tract (CST) damage into four types: (A) CST is preserved around the infarct and originates from the primary motor cortex; (B) CST is preserved around the infarct but does not originate from the primary motor cortex; (C) CST is interrupted at the infarct, losing its cortical connections; and (D) extended CST degeneration such that the CST does not reach the site of infarct.59,60 Motor function was tested 6 months after stroke, and patients with type D damage exhibited the least amount of recovery, whereas those with type A damage recovered the most. These results are consistent with previous findings that patients with disrupted white matter tracts, in which the CST fibers descending from the motor cortex to the site of infarct are undetectable or the CST does not reach the infarct site, have worse clinical prognosis than patients with white matter tracts that are displaced but otherwise preserved.40,61,62
Similar to the studies investigating FA reductions in poststroke white matter tract degeneration and increased mean diffusivity in the thalamus after stroke, DTI tractography at multiple time points provides insight into the evolution of structural changes during recovery. Jang et al. show that at 3 weeks post stroke, the affected regions of the internal capsule and corona radiata have lower FA and higher ADC values compared to controls, and the corticospinal tract descending from primary motor cortex in the affected hemisphere is either disrupted or faint. At 5 months post stroke, motor function is markedly improved, and there are no significant differences in FA or ADC values compared to controls.63 In addition, corticospinal tract fibers descending from primary motor cortex are observed on the affected side (at the more stringent threshold), demonstrating the capacity of the CST to recover from damage.63
Although DTI is a relatively new technique, it can make important contributions to poststroke recovery research by providing quantitative information regarding structural integrity. The application of DTI tractography in the localization of stroke lesions relative to motor, sensory, and cognitive pathways and in the assessment of axonal degeneration allows for more accurate prognosis of long-term recovery and/or disability. In combination with other techniques (e.g., fMRI), DTI can provide a clearer understanding of the how tissue integrity allows for functional recovery. Complementary use of DTI and other brain-mapping techniques in future studies will further our understanding of the role of fiber tract integrity in poststroke recovery and allow for advancements in providing targeted and more effective stroke therapies.
Limitations of DTI
As with any MRI technique, the use of DTI is limited to individuals who do not have ferrous metal objects in their bodies. Presence of even non-ferrous metal objects in the head, such as a titanium aneurism clip, would interfere with the DTI signal and exclude a person from this type of imaging. The DTI signal is also susceptible to distortion due to head movement. The quality of the DTI image is therefore dependent on the ability of an individual to keep his or her head as motionless as possible during image acquisition. This ability varies with each individual and is limited by his or her tolerance for discomfort and immobility. There is also the issue of improving the signal-to-noise ratio to obtain more precise measures of anisotropy and more accurately track white matter fibers. Unfortunately, methods for improving the signal-to-noise ratio lengthen the image acquisition time providing an increased opportunity for head movement and discomfort. DTI tractography is only as accurate as permitted by image resolution and the algorithms for calculating fiber orientation, and fiber orientation may be heterogeneous inside a single voxel at low resolution. Because of these technical limitations, there is ongoing development of methods to account for head movement, efficiently improve signal-to-noise ratio, and refine fiber tracking algorithms to better resolve fiber orientation heterogeneity. Despite its limitations, DTI has very relevant applications in the area of stroke recovery and rehabilitation, allowing for noninvasive investigations of brain tissue integrity and white matter fiber tract structure following stroke.
MRS
MRS is a noninvasive imaging technique that allows for measurements of specific brain metabolites. In stroke research, MRS can be used to investigate biochemical changes in the brain during acute, subacute, and chronic stages, as well as to measure potential markers of recovery. [1H]-MRS and [31P]-MRS are commonly used in human research. [31P]-MRS is able to measure high-energy phosphates in living tissue, for example, phosphocreatine (PCr), phosphomonoesters (PME; e.g., phosphocoline), phosphodiesters (PDE; e.g., glycerophosphocholine), inorganic phosphate (Pi), and ATP. [31P]-MRS is also able to measure intracellular pH using the pH-dependent Pi chemical shift. These high-energy phosphates can be used as indicators of altered bioenergetics associated with stroke or poststroke recovery. [1H]-MRS is able to measure a variety of marker compounds that can indicate loss or damage to a specific cell type. These marker compounds include N-acetyl aspartate (NAA), lactate (Lac), choline (Cho), creatine and phosphocreatine (Cr/PCr), myo-inositol (mI), and amino acids such as glutamate (Glu) and glutamine (Gln) and the neurotransmitter -amino butyric acid (GABA). [1H]-MRS is most commonly used in stroke research, largely due to its clinical availability and increased sensitivity over [31P]-MRS. [31P]-MRS also presents some additional technical challenges over [1H]-MRS.
MRS can measure pathophysiological processes consequent to a stroke or other brain damage. These processes include a failure of energy metabolism, edema, and breakdown of neuronal membranes. In ischemic stroke, a reduction of oxygen availability to brain tissue triggers a failure of energy metabolism (decreased PCr levels in [31P]-MRS), failure of ATP-dependent pumps followed by lactate surge (increased Lac levels in [1H]-MRS), and acidosis (decreased Pi chemical shift vs. PCr in [31P]-MRS) in the affected tissue. These processes induce a cascade of events including a decrease in intracellular calcium concentration, free radical formation, membrane breakdown, and, ultimately, cell death. Spectroscopic techniques including [1H]-MRS and [31P]-MRS are able to detect this failure of energy metabolism as well as its direct (acidosis and increases in lactate levels) and indirect (membrane breakdown and demyelination) effects, particularly during the acute stages following a stroke. These techniques are valuable tools to investigate the metabolic changes induced by rehabilitation in poststroke recovery.
[1H]-MRS
N-acetyl aspartate (NAA) is predominantly found in the axons and nerve processes in the human brain.64 The exact function of NAA remains unknown, but it is thought to be a marker of neuronal integrity. Specifically, NAA levels may provide markers for energy storage or indicate mitochondrial function.65,66 Decreased NAA levels usually indicate neuronal loss or damage to neuronal mitochondria. Longitudinal studies of stroke in humans demonstrate an initial decline in NAA in the affected area followed by a continuing fall of NAA during the first week after stroke onset.67–69 This work suggests ongoing ischemia even at 1 week after stroke onset,69 which may be important for the timing of therapeutic interventions. Therefore, NAA may become a valuable biomarker for correlating poststroke recovery with neuronal viability in the ischemic penumbra.
Creatine (Cr) and phosphocreatine (PCr) have overlapping spectra when measured by [1H]-MRS and therefore are usually indicated as a total creatine (Cr+PCr). Total creatine acts as an energy buffer and phosphate transport system in both neurons and glial cells in the brain. Because Cr/PCr cannot be easily distinguished using [1H]-MRS, this technique is rarely used to study phosphocreatine metabolism directly and is instead used as a marker of energy availability. However, the use of higher field MRI scanners (≥3T), and the development of advanced software such as LCModel,70 may provide an avenue to individually quantify total creatine using [1H]-MRS. Today, [31P]-MRS techniques are more commonly used to study phosphocreatine and its relationship to energy metabolism.71 It has been suggested that the complete absence of total creatine measured by [1H]-MRS indicates necrotic tissue, although findings of reduced total creatine levels are difficult to interpret.72 Reductions in total creatine have been found following infarction and continue to decline up to 10 days following stroke onset.69 Changes in the total creatine peak may be due to changes in the equilibrium of the creatine kinase metabolic reaction or a change in cell population. Specifically, glial cells have been shown to have higher levels of creatine than neurons.73 Therefore, changes in total creatine may reflect a change in the proportion of neurons and glia in a particular region (e.g., formation of a glial scar). Finally, total creatine has been shown to be greater in gray matter as compared to white matter.74 Thus, for clinical applications such as stroke recovery, it is important that the tissue content is determined in order to properly correct the metabolite ratios.
Choline (Cho) has been proposed as a marker of cell membrane integrity. In healthy brain tissue, the choline peak is thought to reflect the levels of two compounds involved in membrane synthesis and degradation: glycerophosphocholine and phosphocholine.75 Changes in the choline peak have been noted after brain infarction,67–69 although the direction of these changes is inconsistent. Increases in the choline peak are thought to be reflective of the breakdown of cell membranes. For example, demyelination is associated with an increase in choline-containing metabolites. The neurobiology behind the decreases in choline metabolites remains unclear.76
Although lactate (Lac) is not normally detected in the brain, it is an excellent indicator of metabolic status. Lactate concentration rises in a tissue when it is produced at a rate that exceeds the tissue’s ability to degrade it or remove it from the blood stream. A rise in brain lactate following cerebral ischemia has been noted in several studies and continues to persist weeks or even months after a stroke.67–69 Elevated lactate levels are found in regions adjacent to infarcted areas and even in the contralateral hemisphere of patients with very large infarcts.77
Neurotransmitters such as gamma-aminobutyric acid (GABA), glutamate (Glu), and its substrate glutamine (Gln) play an important role in the pathophysiology of stroke and stroke recovery. These amino acids are excellent targets for study with [1H]-MRS due to their role in neurotransmission (both excitatory and inhibitory), metabolism, and excitotoxicity. However, their concentration of GABA is low in the human brain, and the considerable overlap of Glu and Gln signals have made the measurement of GABA and GLU in stroke patients difficult with current [1H]-MRS methods. The measurement of Glu and GABA is possible with advanced MRS methods such as spectral editing, multiple-quantum filter methods, and the echo time (TE averaged method).78,79 Because these advanced MRS methods require a great degree of technical expertise, most neurotransmitter research in stroke to date has been limited to animal or cell models. New MRS techniques have been developed to better detect these low concentration metabolites,78,79 which may open further avenues for research into the role of these neurotransmitters in poststroke recovery.
[1H]-MRS can be used as a predictor of clinical outcome
One of the best measures of clinical outcome from stroke is the volume of the infarct, as determined by T2-weighted MR imaging.80 However, it has been found that the combination of NAA concentration and infarct volume is a better predictor of poor poststroke outcome than either NAA concentration or infarct volume alone.81 Preliminary evidence suggests that the best clinical recovery is seen in patients with relatively normal NAA, Cr/PCr, and Cho peaks.82
Stroke is frequently associated with various comorbidities, including depression. Although, it affects 16%–72% of stroke survivors,83 the etiology of poststroke depression is poorly understood. [1H]-MRS can and has been used to study this comorbidity of stroke. [1H]-MRS studies suggest that early onset (within 10 days) poststroke depression is associated with increased glutamate levels in the frontal lobes.84 This may reflect abnormalities in glutamatergic transmission during the early poststroke period and have implications in the development of new therapeutic interventions. [1H]-MRS has also been used to study diaschisis, a common occurrence after infarction that results in brain dysfunction from interregional disconnection. Diaschisis is commonly defined as reduced regional brain functioning due to deafferentation or interruption of normal inputs to a region not directly affected by the stroke. The resolution of diaschisis is an important component of recovery from stroke.85 The presence of diaschisis is associated with increased Cr/NAA ratio and reduced rCBF, which may serve as useful markers for assessing the benefit of therapeutic interventions.86
[1H]-MRS in stroke rehabilitation
Little work has been done to directly measure the effects of rehabilitation and therapeutic interventions on metabolic changes during stroke recovery. However, the available [1H]-MRS studies have demonstrated that metabolite concentrations can be used as a marker of future clinical outcomes, as well as an indicator of cerebral reorganization and recovery. For example, it has been shown that Cr/NAA ratio is increased in the ipsilateral hemisphere 6 weeks after stroke.87 At 1 year after stroke, there is an increase in rCBF and Cho/Cr ratio in the contralateral hemisphere and a reduction of the previously elevated Cr/NAA ratio in the ipsilateral hemisphere.87 Although it is unclear how these findings directly relate to degree of recovery, they provide insight into how neurochemistry in infracted regions changes over time. These findings may be used as markers of cerebral reorganization and neural plasticity, though further study must be done to better characterize the relationship between changes in these compounds and changes in cell membrane, synaptic integrity, and, ultimately, functional recovery.
[31P]-MRS in stroke research
As illustrated in Figure 2, [31P]-MRS is well suited for investigations of key players in energy metabolism that may change as a function of stroke and poststroke recovery including ATP, phosphocreatine (PCr), and inorganic phosphate (Pi). PCr has been recognized as an important buffer to maintain stable levels of ATP in the brain and other tissues. Because the synthesis of PCr in the mitochondria is very sensitive to the supply of blood to the tissue, reduced PCr/ATP ratios (due to depleted PCr and unchanged ATP levels) can be used as an indicator of ischemic severity. Additionally, decreased ATP/Pi and increased PCr/Pi ratios have been proposed as markers for the severity of cerebral damage and may be useful indices of clinical outcomes.88–91 In general, it has been found that subacute and chronic infarcted regions show a dramatic reduction in overall levels of phosphorous metabolites.76
Figure 2.
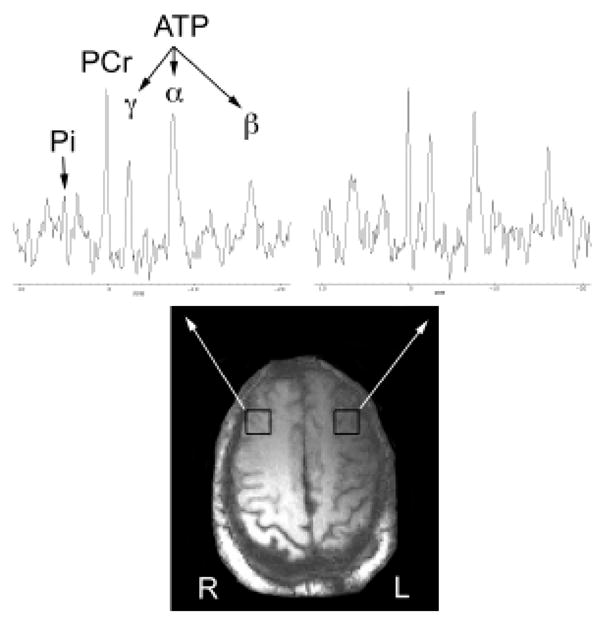
Phosphorous spectra from two brain locations. Representative [31P]-MRS spectra from a patient with a left internal capsule stroke. The single voxel (voxel size 13.8 cc) [31P]-MRS spectra are selected from the voxels indicated by the white boxes. Major [31P]-MRS metabolites such as inorganic phosphate (Pi), phosphocreatine (PCr), and adensosine triphosphates (γ-, α-, and β-ATP) are labeled. Reductions in gamma- and beta-ATP levels are evident in the spectrum from the left hemisphere.
In addition to the ability to measure bioenergetic molecules, [31P]-MRS can also be used to study phospholipids. Commonly studied phospholipids present in neuronal and glial membranes include the phosphodiesters (PDE) and phosphomonoesters (PME). Changes in phosphodiester and phosphomonoester ratios may be an index of phospholipid turnover or metabolism.92 Finally, [31P]-MRS investigations have demonstrated that acidosis is present in infarcted regions in the subacute stage, whereas alkalosis is present at a more chronic stage.76 Persistent alkalosis is a common finding in chronic stroke93 and is thought to result from damage to pH regulatory systems94,95 or proliferation of phagocytes in the infarcted region.96 Further research is needed to characterize the effects of stroke on pH levels and the implications of poststroke acidosis/alkalosis for stroke recovery and rehabilitation.
[31P]-MRS in stroke recovery and rehabilitation
Although we are not aware of any published reports of poststroke rehabilitation research utilizing [31P]-MRS, this technique has demonstrated promise for the study of the brain’s resting-state metabolism. [31P]-MRS allows for the assessment of membrane breakdown, demyelination processes, and intracellular energy metabolism and may prove to be a sensitive marker of recovery and plasticity in the brain. For example, we suspect that poststroke recovery relies on the return of neuronal activity, a process that depends on efficient ATP synthesis and availability. The ATP/ADP ratio may be an indicator of the normalization of neuronal function in the affected brain regions, such as the ischemic penumbra. Although ADP levels cannot be directly measured by [31P]-MRS techniques, they can be determined by using a combination of [31P]/[1H]-MRS. Future studies combining these two techniques would allow for further characterization of recovery processes following stroke. These markers could prove useful in assessing the effects of rehabilitation on brain metabolism and vice versa.
Limitations of MRS in Stroke Recovery
Although MRS techniques show great promise in clarifying the neurochemical changes that occur with stroke and stroke recovery, technical limitations affect its widespread applicability. One particular challenge with MRS research as it is applied to stroke is that baseline neurochemistry, especially as it relates to healthy aging, is not fully understood. Furthermore, acquisition and analysis of MRS data require considerable technical expertise and equipment. For example, the use of higher field MRI systems (≥3 Tesla) is required for more accurate metabolite quantification. In addition, although whole-brain MRS measurements can be acquired (e.g., 2D CSI [1H]-MRS), many MRS studies to date utilize a region of interest (ROI) approach for data collection and/or analysis. This ROI approach requires technicians with good knowledge of neuroanatomy for proper ROI placement and limits data collection to regions hypothesized to have been directly affected by stroke (e.g., the penumbra) or regions thought to be involved in poststroke recovery (e.g., downstream cortical areas). This ROI approach limits generalizability of results to a larger population and is unable to examine changes in other regions of the brain. Voxel-wise approaches (such as those used in fMRI techniques) that can examine whole-brain chemistry will greatly aid in the advancement of this field. Nevertheless, MRS remains a sensitive measure of neurochemistry in vivo and should continue to provide valuable information on how neurochemistry in the brain changes with stroke recovery and rehabilitation.
Ligand-based PET and SPECT
Conducting PET and SPECT imaging studies using radioactively labeled neurotransmitters or transporter ligands allows the examination of the density and regional distribution of specific cell surface proteins in the brain. Information on receptor and transporter distribution or density can indicate the signaling viability of nerve cells in a given brain region. Thus, ligand-based nuclear medicine techniques enable quantitative description of cellular neurotransmitter systems. Currently, ligand-based nuclear medicine techniques are not in widespread use in rehabilitation research but appear to have a niche for examining acute stroke. For example, a search of PubMed for “(PET OR SPECT) AND (binding OR ligand) AND brain AND stroke” yields 119 citations as of February 2008. Adding “AND (rehabilitation OR recovery)” decreases that number to four, all PET studies, of which two used rCBR or rCMRglc (discussed below), one examined [18F]-fluoromisonidazole binding to “hypoxic but viable tissue,”97 and one reviewed human and cat literature on, among other things, flumazenil, “a marker of neuronal integrity” that binds the GABA receptor.98 Although this simplistic search approach suggests that few researchers use ligand-based PET or SPECT to examine stroke recovery or rehabilitation, there is a substantial body of stroke research. Arguably, these techniques will contribute to stroke rehabilitation research as interest increases in the cellular processes these ligands characterize. Therefore, we will discuss the questions these techniques could address.
A wide variety of PET and SPECT ligands are available to the research community. Even though diagnostic and treatment monitoring procedures are the primary clinical uses, a significant number of ligands have been developed to bind structures of interest in the brain (cf., ref. 99). PET ligands are most commonly labeled with 18F or 11C depending upon the chemical makeup of the molecule to be labeled, whereas SPECT ligands are often labeled with 123I or 99Tc. All major neurotransmitter systems can be examined with one or more ligands. The gamma-aminobutyric acid (GABA) receptor, which has been useful in studies of epilepsy and stroke, has been labeled with 123I-iomazenil or 18F-flumazenil and used to visualize stroke extent.100, 101 Moreover, evidence exists that the prognosis of aphasia recovery is related to the density of GABA receptor binding in language areas.102 Both dopamine D1 and D2 receptors can be visualized with PET and SPECT.99 The D2 form selectively binds 11C-raclopride,10318F-fallypride,104 and 123I-iodobenzamide.105 The serotonin (5HT)-2A receptor selectively binds 18F-altenserin, 18F-setoperone, or 123I-2-ketanserin, while PET ligands exist for the 5HT-1A receptor.99 PET and SPECT ligands also exist for the dopamine and serotonin transporters. For the 5HT transporter, these include 123I-ADAM,10611C-MADAM,107 and 11C-DASB.108 For the dopamine transporter, examples include 99Tc-TRODAT,109123I -βCIT,110 and 18F FPCIT.111,112 Ligands also exist for a variety of other receptors, including nicotinic and muscarinic acetylcholine receptors, adenosine receptors, opioid receptors, and many others.99 Dopamine function, being important to movement coordination in the striatum, could be affected by stroke, and dopamine imaging might provide a measure of improvements with rehabilitation. GABA has been suggested as a marker of neuronal integrity as it may be neuron-specific.113 Ligand-based imaging is likely to become more widespread in rehabilitation research, because it indicates the functionality of brain tissue with respect to specific neurotransmitter systems. In addition to GABA and potentially dopamine, other ligands may inform stroke research, although the role of other neurotransmitter systems in recovery is not yet clear.
Details of Functional Techniques
The next section discusses the brain-mapping techniques that measure function through their dependence upon, influence over (e.g., TMS), or assumed relationship to behavior (resting state metabolic measures). PET, fMRI, NIRS, MEG, and EEG all assess changes in brain function by determining changes in signal amplitude that result from experimenter-directed manipulations of behavior or resting state metabolism. TMS, by contrast, affects behavioral output directly by stimulating brain tissue with a rapidly fluctuating magnetic field that induces electrical activity in the underlying neurons. Approaches that depend on behavioral manipulation usually compare relative signal changes between a control and an active condition, whereas metabolic measures can indicate absolute levels of function in a particular condition.
PET and SPECT
In addition to their uses for detecting neurotransmitters, PET and SPECT also can be used to measure neurophysiological processes that relate to metabolism. These include regional cerebral blood flow (rCBF), regional metabolic rate of glucose (rCMRglc), and regional metabolic rate of oxygen (rCMRO2). Two methods for measuring cerebrovascular stress reactivity also exist, CO2 inhalation or acetazolamide (Diamox) challenge. These challenge methods increase CO2 partial pressure globally leading to widespread vasodilation and can be used to distinguish continued ischemia in the penumbra from diaschisis or to determine whether tissue can respond to increased metabolic demand.87,114 Cerebral perfusion can be examined indirectly with the lipophilic SPECT radiopharmaceuticals 123I-IMP, 99mTc-HMPAO, and 99mTc-ECD,115 which cross the blood–brain barrier and diffuse into healthy brain tissue at a rate proportional to regional blood flow.87
The various SPECT and PET tracers interact with the brain differently but share the principles of radioactive decay as their detection method. Some tracers accumulate in the brain over time, and others pass through the brain only briefly. For instance, a widely used PET radiopharmaceutical is the radioactive sugar analogue 2-deoxy-2-18F-D-glucose (FDG), which assesses rCMRglc. Active cells in the body (e.g., neurons) take up FDG, but it is only partially enzymatically digested and accumulates within active cells over time. The more active the cell, the more FDG it accumulates over time (Figure 3). 18F is radioactive and decays into oxygen with a half-life of 109 minutes. The decaying fluorine atom emits a positron (antimatter electron) that, upon collision with real matter, releases two gamma rays that are detected by the PET “camera.” In an analogous manner, rCBF changes can be assessed using oxygen-15 labeled water or inhaled oxygen with PET or 133Xe inhalation and SPECT. 15O has a short half-life of 2 minutes, restricting its use to medical centers with an on-site cyclotron. 133Xe has a much longer half-life of 5 days, but it has rapid clearance from the brain. Once injected or inhaled, these radiotracers enter the blood and travel in greater quantity to active brain regions. The radioactive decay events are then detected in greater number coming from active brain regions.
Figure 3.

Effects of stroke on FDG PET. Anatomical MRI and [18F]-FDG PET in a patient with left internal capsule infarction. Panels A and D show the stroke location (arrows) in axial and coronal slices, respectively. Although the premotor region (shown in B and E) appears structurally normal, the [18F]-FDG images (C and F) show a region of hypermetabolism in the premotor cortex of the contralesional hemisphere. [18F]-FDG images were acquired 10 months after infarct. All images are in radiological convention, as labeled in panel A, with the left side of the brain on the right side of each image.
Metabolically based techniques define brain activity irrespective of cognitive manipulations that might engage or disengage particular brain regions. Because of tissue damage, brain regions within or near a stroke, as well as distant to it, exhibit reduced metabolism. The stroke region exhibits reduced signal due to cell death, while nearby regions, like the penumbra, may exhibit reduced metabolism for other reasons. Acutely, the penumbra can suffer from ischemia, albeit less severe than the region of the stroke. In the longer term, the penumbra may exhibit reduced metabolism due to the loss of cellular inputs from the stroke region. Distant cortical sites may also exhibit metabolic decreases due to a reduction in inputs from the stroke region (i.e., diaschisis). For instance, cortical hypometabolism resulting from thalamic stroke appears in PET images but resolves with behavioral recovery.116,117 Contralateral hemisphere oxygen metabolism in regions homologous to the stroke can be reduced, possibly as a result of degeneration of inputs from the damaged hemisphere.118 In addition, the degree of reduced cortical perfusion, in one case due to striatal or capsular strokes, correlates with aphasia severity.119 In a 6-month longitudinal study of natural aphasia recovery, the authors initially observed widespread depression of rCMRglc with 18FDG PET in both cortical hemispheres up to 2 weeks after stroke. After 6 months, this metabolic reduction reversed significantly, suggesting that metabolic increases correlate with aphasia recovery.120
In addition to measuring basal metabolic function, which has a presumptive relationship to brain function, rehabilitation paradigms often use neuroimaging to relate brain activity changes to therapeutic success. Rehabilitation studies using rCBF, rCMRglc, or rCMRO2 take generally similar approaches. An experimenter administers the tracer to a patient and allows that patient to perform a motor or language task. For rCBF or rCMRO2, the task would be performed concurrently or immediately following tracer administration. Successive tracer administrations can be performed while the experimenter systematically varies the behavioral task (i.e., alternating blocks of rest and active movement). For rCMRglc, there is less of a time constraint. The behavioral paradigm may take several minutes and then images can be taken of the accumulated FDG throughout the brain. Following a washout period, this cycle can be repeated. With blood flow and oxygen metabolism measures, repetitions can be greater in number and much quicker. In a rehabilitation paradigm, the question of interest would be whether the patterns of rCBF, rCMRglc, or rCMRO2 in the brain change systematically as a function of treatment. Early studies provided some evidence that therapy was correlated with behavioral improvement and a corresponding metabolic recovery.121,122 Current approaches actively manipulate behavior during scan acquisition. Researchers can relate activation changes to specific behavioral improvements. This approach has enabled the demonstration of homologous nondominant hemisphere participation in language rehabilitation,123 bilateral sensory and motor cortex reorganization following specialized arm movement training but not a control rehabilitation paradigm,124 and the effect of constraint-induced movement therapy in chronic stroke patients.125 The number of PET and SPECT imaging studies of the effects of rehabilitation have increased enough in recent years to warrant review of therapeutic findings, which also include fMRI research.126
Limitations of PET and SPECT
PET and SPECT both have advantages in that the degree of radioactivity of the injected sample often can be precisely measured and quantified allowing for a precisely defined rate of glucose metabolism, blood flow, or oxygen consumption to be determined. Quantifying the rate may involve arterial blood sampling, which elevates the invasiveness of the technique. On the other hand, these techniques involve low doses of radiation and may include vascular catheterization. Both PET and SPECT are limited in their temporal resolution by the sensitivity of the radiation detectors. For PET, the acquisition time may be as little as 40 seconds with some rCBF techniques, while SPECT and rCMRglc take longer because of the need to accumulate tracer before imaging takes place. 15O paradigms require an on-site cyclotron owing to the 2-minute half-life of this isotope. 18F, 99Tc, and 123I all have longer half-lives allowing for more flexibility in the image acquisition timing. In general, however, PET and SPECT techniques have very low temporal resolution and have medium spatial resolution on the order of 5–10 mm.
Functional MRI
MRI is based on the absorption and emission of radio waves by tissues placed into the magnetic field of the MRI scanner. When materials are placed in a magnetic field, protons in the material line up with the field like tops spinning in a gravitational field. Once the protons line up with the magnetic field, they are able to absorb radio waves. Like a playground swing where one pushes at the rate the swing oscillates, protons in a magnetic field only absorb radio waves at their resonant frequency, which depends upon the magnetic field strength (63 MHz for a 1.5 Tesla MRI, 172 MHz for a 4 Tesla MRI). Because the predominant sources of protons in the human body are water and fat, MRI mainly measures how water and fat protons behave in different tissues.
The tissue of interest for fMRI is blood. It was discovered in the early 1990s that water in blood behaves differently, from an MRI standpoint, near oxygenated compared to de-oxygenated hemoglobin.127 fMRI developed from the combination of this technique and the adaptation of suitable mathematics.128 fMRI is now a widely used brain-mapping technique. The fMRI signal measures something akin to rCBF. A change in blood oxygenation leads to a change in blood oxygenation level dependent (BOLD) signal. Regional cerebral blood flow, blood volume, and oxygen extraction rate all affect the BOLD signal,129 so the BOLD signal is not a pure measure. Although increased blood flow increases the BOLD response, the fMRI signal is not absolutely quantifiable in the same sense that SPECT and PET measures may be. fMRI is quantifiable only in a relative sense (e.g., percent signal change), which indicates the degree of difference between an active and a resting state. For instance, brain activation during right-hand finger tapping must be calculated relative to a comparison behavior like rest or left-hand finger tapping. Early fMRI studies used extended blocks of time for active and resting periods (~30 seconds) for comparison.128
Experimenters using fMRI must create behavioral paradigms that activate particular brain regions, for example, motor cortex or language areas. In the simpler paradigms, activation is measured by comparing the MRI signal obtained while a patient is resting with the signal during movement or language production, mathematically subtracting one set of images from the other. More recent fMRI paradigms can identify brain activation in response to brief cognitive, perceptual, or motor events lasting a few seconds or less. Such events can include conditions as minimal as tapping a finger once, twice, or three times.130 The adaptation single-trial averaging and related techniques, similar to the approach for event-related potentials, and the relatively high temporal resolution of fMRI have allowed event-related designs to flourish in the past decade.131 Also, in human studies, the spatial resolution with fMRI is much better than with PET or SPECT, with images of a typical resolution of 3 mm and often less.132 A BOLD image of the whole brain can be obtained in about 3 seconds, although the actual time will vary inversely with resolution and coverage. Because of the relative speed of image acquisition, behavioral paradigms for fMRI experiments can be more versatile than simple active-resting block paradigms. Event-related fMRI paradigms are increasingly common for imaging studies where successive behavioral events may differ from one another. For instance, a researcher studying language wants to know the difference in brain activation between deciding if a letter string is a real word or a pseudo-word. A block design would require the researcher to present blocks of real words and blocks of pseudo-words together. Because a subject recognizes which block is taking place as soon as the first word is presented, decision-making does not require verbal processing throughout the block. An event-related design can randomize the presentation order, thus requiring participants to read each letter string before deciding.
Language and movement representations change with recovery and rehabilitation therapy. Natural recovery studies are prevalent using both nuclear medicine and fMRI techniques. Because fMRI is noninvasive, multiple rounds of data acquisition can take place within a session and multiple sessions can take place over the course of therapy. For these reasons, we focus here on multisession therapy studies. Differences in fMRI measures before and after therapy indicate the location and degree of change with time with a greater degree of spatial precision than other brain-mapping techniques (Figure 4). Over that last decade, rehabilitative strategies have been increasingly studied with fMRI. Initial individual patient case studies were followed by larger group studies. In a block design study of metacarpal-phalangeal flexion-extension movements, one study reports that after constraint-based therapy there was increased activation in the ipsilesional premotor area, secondary somatosensory cortex, and bilateral superior posterior cerebellum, where changes correlated with improved grip strength.133 Activation in the undamaged hemisphere has also been reported to result from constraint-induced motor therapy.20,134 Aphasia therapy also induces changes in fMRI brain activation. The high temporal resolution of fMRI allows investigation of brain activation timing. For example, the time to peak fMRI activation in aphasic subjects decreased following therapy, which is consistent with a reduction in verbal processing time.135 Only more recently have randomized controlled clinical trials been conducted on larger numbers of patients in a head-to-head comparison of exercise versus arm training.136
Figure 4.
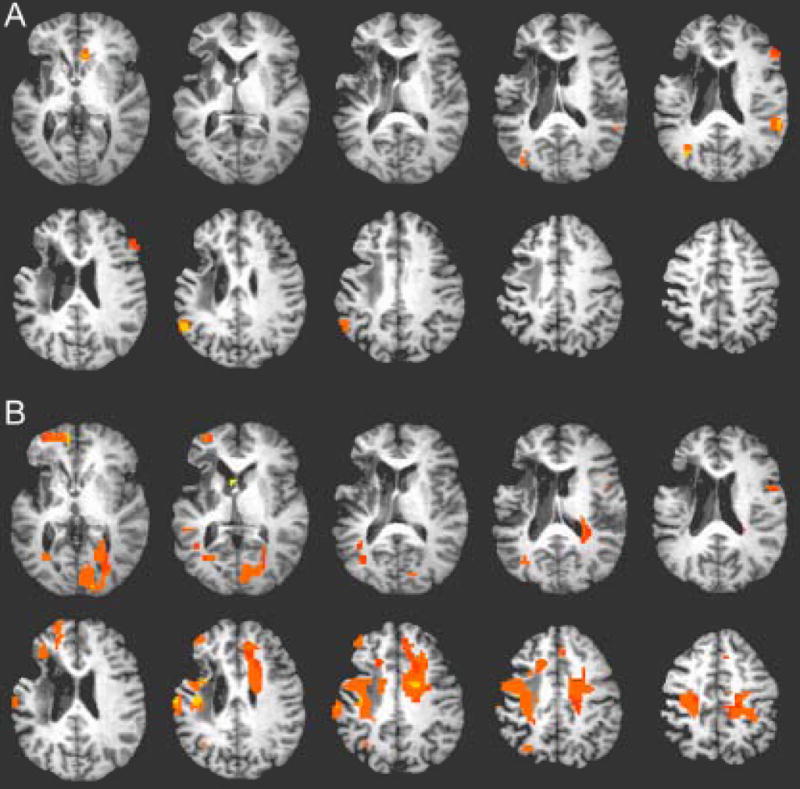
Representative fMRI activation map. Changes in fMRI brain activation during wrist flexion/extension following 8 weeks of electrical stimulation with a neuroprosthetic device. Subject is a 52 year-old woman, 4 years after left hemisphere infarct. (A) Pretherapy scan with right (affected) wrist flexion/extension. (B) Posttherapy scan with right wrist flexion/extension showing increases in brain activation in bilateral motor regions. Posttherapy scan was conducted 13 weeks after the pretherapy scan. p < .01; n = 25 voxels. All images are in neurological convention with the left side of the brain on the right side of each image.
Limitations of fMRI
fMRI research requires careful behavioral paradigm design. Even apparently similar motor or language tasks may activate appreciably different brain regions. Consider this purely hypothetical example. In a rehabilitation protocol, dorsolateral prefrontal cortex (PFC) is engaged by performance of an arm-movement tracking task during therapy and its engagement changes during rehabilitation. If researchers use a finger-tapping task to assess brain activation with fMRI, and finger-tapping does not activate dorsolateral PFC, one cannot tell how therapy may have altered dorsolateral PFC function. This example exposes one confounding aspect of neuroimaging. One cannot assume that all the brain regions that participate in behavioral improvements will be identified by fMRI unless the fMRI task is exactly the same as the therapy, in which case, the generalizability of training effects could be questioned. This contrived example illustrates the possibility that therapy may engage brain regions whose roles in recovery may not be understood, and the effects of therapy could be missed by poor task design. Also, fMRI and any other behavioral activating paradigm cannot distinguish between excitatory and inhibitory activity because both generate metabolic increases that are met with increased blood flow. Research with fMRI, therefore, requires consideration of what brain regions might be recruited to restore function and what their roles could be in the rehabilitation process.
Despite potential task design dilemmas, fMRI represents a reasonable method for examining brain activation, especially because it is noninvasive. Unfortunately, reasonably large costs also are associated with the enterprise as a whole, including significant image-processing demands, information storage needs, and data management commitments. Like PET and SPECT, image processing is complex, but fMRI data sets also can be larger; each patient represents 500 or more megabytes per visit. fMRI activation is not quantifiable in metabolic terms, only in relative terms of signal intensity change. MRI scanners are loud, and the enclosed space can make some patients uncomfortable. Because completely motionless subjects provide the best images, limb movement and vocalization paradigms may degrade image quality, and patients’ tolerance for discomfort and immobility also affects the caliber of activation.
NIRS
Similar to PET and fMRI, NIRS measures blood flow changes. NIRS is sensitive to the differential absorption of near-infrared light (650–950 nm) by oxy-hemoglobin (HbO2) and deoxy-hemoglobin (HbR).137 Near-infrared wavelengths are only weakly attenuated by the scalp and skull and can penetrate several centimeters into the cranium.138 NIRS uses an interdigitated array of near-infrared sources and detectors placed on the scalp allowing a resolution roughly equivalent to the source-detector separation, typically 3 cm or less.138 As the concentrations of HbO2 and HbR fluctuate during cognitive activity, the detector signals also fluctuate. NIRS is noninvasive and portable and does not require the expense of an imaging system such as MRI. NIRS systems also can be implemented as wearable devices potentially allowing brain activity monitoring under completely ecological conditions.139 The behavioral paradigms and uses are similar to those for fMRI. In addition to HbO2 and HbR, the combined signals produce total Hb, which is an estimate of regional cerebral blood volume.138 Also, the fast response to neuronal activation can be obtained with related techniques such as event-related optical signals, which derive from the near-infrared light-scattering properties of active neurons.140
The attraction to NIRS derives from its ability to monitor moving patients. Both gait and hand movement studies have been conducted with ataxic patients in rehabilitation. Generally these findings agree with other imaging findings. For example, NIRS activation level in prefrontal cortex oscillates between the acceleration and steady phases of gait in healthy subjects but remains sustained throughout both phases for ataxic patients.141 In hand movement and gait studies, early poststroke activation is bilateral142 but reverts to unilateral or asymmetrical activation with recovery.143,144
NIRS limitations
NIRS ability to ascribe signal changes to brain functions depends upon the ability to map the infrared signal to the appropriate underlying tissue. NIRS itself provides no anatomical information but, like EEG and MEG, must use scalp anatomy to estimate where in the brain the signals arise. The spatial resolution is typically coarse, at 3 cm or more, but may improve with technical advancements, whereas the temporal resolution can be quite high. Like with fMRI, inhibitory and excitatory activity cannot be discriminated. The obvious advantage of NIRS is that ambulatory and proximal limb movement studies can be conducted in natural living environments.
MEG and EEG
MEG and EEG techniques work in a completely different manner than the image or blood-flow– based brain-mapping methods already discussed in this article. Active neurons generate small electrical currents across their cell membranes, specifically along the dendrites, as they process incoming signals from other neurons. These small electrical currents generate fluctuating electrical voltages that are detectable by means of surface electrodes placed on the scalp (EEG). These fluctuating electrical signals also generate small magnetic field oscillations at right angles to the current flux, which can be detected by the magnetometers that are part of an MEG array. MEG and EEG detect signals that arise predominantly from the dendritic fields of cortical pyramidal neurons. EEG and MEG detect this signal from a large area on the order of several square centimeters. Although largely similar in what kind of information they detect, MEG and EEG differ in several important ways. With EEG, the tissue between the scalp electrode and the cortex attenuates the strength of the signal and the signal strength decreases with the square of the distance between them. On the other hand, tissues do not attenuate the MEG signal, but the magnetic fluctuations drop off as the cube of the distance between source to detector increases. Additionally, EEG picks up stronger signals from electrical sources that point straight out of the scalp, such as the tops of cortical gyri. MEG picks up stronger signals from sources oriented parallel to the scalp, that is, sulcal walls. Because tissues do not affect the MEG signal, MEG typically enables better signal source localization than EEG.
As with fMRI, EEG and MEG techniques may use an event-based approach to identify the characteristics of brain activity in response to specific behaviors, evoked or event-related potentials (EPs/ERPs), and event-related magnetic fields (ERFs). The presence of EPs in response to upper limb sensory stimulation145 and the magnitude of ERPs in response to spoken words146 can predict the quality of language recovery. As observed with other techniques, a higher degree of asymmetry in ERPs when compared to standard EEG signals such as coherence or delta-wave amplitude also appear to provide information about recovery and rehabilitation. For example, researchers have observed that the degree of signal synchrony was greater between medial and lateral motor areas in stroke patients than in healthy subjects but reduced with recovery.147 In another study, the degree of reduction in delta-wave signals from perilesional brain tissue correlated with the amount of language recovery following rehabilitation.148 In addition, by co-registering the electrode or magnetometer positions to the head, complex source localization calculations can be used to estimate where in the brain particular signals arise. Using this technique, a study has shown that an asymmetric localization of the magnetic sources responsive to contralateral median nerve stimulation is associated with better recovery than a symmetric localization in the two hemispheres.149
EEG and MEG limitations
As with NIRS, no anatomical information is collected by EEG and MEG. There are template brain spaces available to approximate where signals arise in the brain based on the electrode or magnetometer position. Acquisition of an anatomical MRI scan can allow for individualized assessment of source localization. MEG offers somewhat better localization than EEG because the intervening tissue does not attenuate magnetic fields, although this better localization comes at a significant price differential. Advanced EEG systems may cost a few to tens of thousands of dollars, whereas MEG systems cost in the millions.
TMS and EMG
TMS influences ongoing brain and muscle activity by stimulating weak electrical currents in brain tissue through electromagnetic induction. These electrical currents can disrupt mental processes like visual perception150 or stimulate muscle contraction. TMS is delivered through a small paddle placed near the scalp. Inside this paddle is a coil of copper wire wound around a figure-of-eight or doughnut-shaped ring to form an inductive loop. Electric current is passed quickly through the wire coils by discharging a capacitor to produce a strong but transient magnetic field. The rapid fluctuation of this magnetic field induces weak electrical potentials in the underlying brain tissue. These electrical potentials are strong enough to depolarize neurons and affect normal electrical processes in nearby brain tissue. Based on the ability of TMS to produce muscle responses, TMS must cause action potentials directly or indirectly in descending corticospinal motor neurons.151 The effects of TMS can be measured by recording electromyograms (EMG) in arm, hand, or finger muscles or by measuring changes in behaviors like reaction time or response accuracy. TMS is delivered typically in one of three ways: as a single pulse, as a paired pulse, or as a rapidly repeating train of stimulation. There has been recent interest in determining whether TMS itself can be used as a therapeutic intervention. This article does not consider that aspect of TMS but only its use in brain mapping to understand changes in cortical electrophysiology.
TMS techniques can be used to measure several aspects of cortical electrophysiology. For single- pulse TMS over motor cortex, these measures include the size (EMG amplitude) and timing of muscle contractions, called motor-evoked potentials (MEPs). Some studies have demonstrated that arm or hand muscle MEP amplitudes measured soon after a stroke can predict the degree of behavioral recovery weeks to months later.152–156 Moreover, MEP amplitudes increase as a result of therapeutic behavioral training.157 For paired pulse TMS, the presence of a conditioning pre-pulse at, for example, 80% of a muscle’s MEP threshold followed by an above-threshold stimulus can affect MEP amplitude to the second pulse. A 3- to 5-ms delay reduces MEP amplitude (intra-cortical inhibition; ICI), whereas a 10- to 15-ms delay increases MEP amplitude (intra-cortical facilitation; ICF).156 Some work suggests that stroke alters intra-cortical excitability (ICI and ICF),156 and successful recovery is associated with normalization of these measures.158 Repetitive TMS (rTMS) can be used to determine whether a particular region participates in a recovered function by assessing whether focal stimulation there alters behavior. In one study of aphasia, it was demonstrated that some stroke patients use the right inferior frontal gyrus homologue of Broca’s area to process language. Repetitive TMS over this site disturbed performance of a linguistic task in these patients.159,160 Determining the scalp area from which one obtains an MEP in a particular muscle produces a two-dimensional activation map for that muscle. Several studies have used this approach to show the effects of natural recovery and rehabilitation. In a study of chronic stroke patients, increases in map size and displacement of the map correlated with better functional recovery.161 Constraint-based therapies all appear to increase map size for limb muscles in correlation with improved behavioral function.17,18,162,163
Limitations of TMS
Although specific limitations affect the interpretations of TMS, it must be noted that this is one of few and certainly most widely used techniques to directly stimulate the brain. Used as a mapping technique, TMS provides only two-dimensional maps of the brain surface. Used only for MEP magnitude measurements at a single point, no map is produced. Like NIRS and EEG/MEG, no anatomical information can be collected with this technique. Localization of the stimulation site must be approximated from scalp landmarks or can be estimated by collecting an anatomical MRI image and placing suitable MRI-visible landmarks, such as Vitamin E capsules, during stimulation. The difficulty in interpreting TMS results arises, for the most part, from the variety of measurements that can be made and how individual investigators interpret these measurements.
Summary and Discussion
According to the National Stroke Association, there are almost 5 million stroke survivors in the United States.164 Approximately 780,000 people each year experience a new or recurrent stroke, of which approximately 600,000 are first attacks.1 Our current understanding of how the brain repairs itself after a stroke needs to keep pace with the increasing need for treatment of stroke in the chronic recovery stage. Brain-mapping techniques provide an important set of tools for the study of how brain function changes after a stroke. However, the neurophysiological mechanisms that support natural recovery and rehabilitation of function are poorly understood. Because the view that therapeutic interventions can restore lost abilities has recently regained acceptance, the mechanisms by which therapy enables functional recovery necessitate further study. Researchers, therefore, need a clear understanding of what brain-mapping tools exist and how they can be used to investigate stroke recovery and rehabilitation. In this review, we have tried to provide a summary of what brain-mapping techniques exist, what they measure, how they have been or may be used in stroke research, and their limitations.
Stroke rehabilitation research could benefit from a unifying theoretical framework. Frameworks have been proposed for quantifying the process of recovery156,165 or for distinguishing whether metabolic impairments arise from diaschisis or ischemia.87,114 In what follows, we describe some existing concepts that might be useful in further shaping the theoretical backdrop of stroke rehabilitation research. Such a framework, we hope, will help in explaining how patterns of injury and recovery relate to one another. Why, for instance, does engagement ipsilateral to the stroke cortex lead to worse recovery in some cases but not others? There appear to be some similarities between stroke recovery patterns and models of behavioral intereference that are useful to describe. Kinsbourne and Hicks describe the concept of functional cerebral distance.166 When two tasks share processing resources or when they interfere with one another, they are close in functional cerebral distance. Tasks that are easily performed simultaneously are far apart in functional cerebral distance. In one conceptualization, close functional cerebral distance arises from significant anatomical interconnection between regions.167 Interconnected regions may process similar kinds of information.168 Thus, engagement of a region by one task may interfere with simultaneous engagement of a functionally close region by a similar task.167
This concept might be loosely adapted to explain why certain regions are recruited to restore lost abilities during recovery and rehabilitation. For instance, if motor cortex was partially damaged from stroke, remaining motor cortex is close in functional cerebral distance and might be expected to support recovery processes. As stroke volume increases or encompasses larger areas, residual motor cortex may be insufficient to take on lost functions. In this case, more distant regions would be predicted to participate in the recovery process, for example, ipsilateral premotor or supplementary motor area or contralateral motor cortex. As strokes become larger or damage an area more completely, regions with greater functional distance are recruited to support recovery processes. What we lack in this conceptualization is a way to determine functional distance or, alternatively, to determine the order in which regions will be recruited (i.e., which regions come first, second, etc.).
To give a specific example, functional distance might be measured by quantifying diaschisis.169 By comparison with a quantitative PET170 or SPECT template of rCMRglc or rCBF, it might be possible to determine for an individual stroke patient how much diaschisis is present in different brain regions. For brain regions outside the penumbra, areas with greater diaschisis could be defined as being functionally closer than areas with less. Then researchers could assess whether the amount of diaschisis correlates with the amount of brain activity after recovery or rehabilitation.
Brain mapping will play an integral role in defining the neurophysiology of stroke rehabilitation and recovery. The techniques described here can be used to assess how the brain responds actively or passively to behavioral and physiological challenges. Given the limitations of each technique and the complexity of many of the issues concerning rehabilitation, the most thorough approaches may require the use of one or more of these methods at the same time. For instance, because TMS does not acquire anatomical data, it may be best used in combination with structural and functional MRI. Because fMRI provides no quantification of blood flow, an additional NIRS session or PET scan could provide substantial information about the absolute level of blood flow or metabolic activity. Because EEG and MEG source localization depends upon several stages of assumptions, an fMRI scan could help limit the solutions to source localization (e.g., combined EEG and fMRI). The demand for information about stroke rehabilitation will undoubtedly be driven by patient demand in the coming decade. The accurate utilization and understanding of brain-mapping techniques will play a key role in the quality of information that clinicians and clinical researchers can provide to patients.
Acknowledgments
Drs. Eliassen and Szaflarski are currently supported by National Institutes of Health grants K01-DA020485 and K23 NS052468, respectively.
Contributor Information
James C. Eliassen, Associate Director, Center for Imaging Research, and Assistant Professor, Department of Psychiatry and Neuroscience Graduate Program, University of Cincinnati Academic Health Center, Cincinnati, Ohio.
Erin L. Boespflug, Graduate Student, Neuroscience Graduate Program, University of Cincinnati Academic Health Center, Cincinnati, Ohio.
Martine Lamy, Graduate Student, Neuroscience Graduate Program, University of Cincinnati Academic Health Center, Cincinnati, Ohio.
Jane Allendorfer, Graduate Student, Neuroscience Graduate Program, University of Cincinnati Academic Health Center, Cincinnati, Ohio.
Wen-Jang Chu, Assistant Professor, Center for Imaging Research and Department of Psychiatry, University of Cincinnati Academic Health Center, Cincinnati, Ohio.
Jerzy P. Szaflarski, Associate Director, Center for Imaging Research, and Associate Professor, Neuroscience Graduate Program, and Department of Neurology, University of Cincinnati Academic Health Center, Cincinnati, Ohio, and The Neuroscience.
References
- 1.Rosamond W, Flegal K, Furie K, et al. Heart disease and stroke statistics—2008 update: A report from the American Heart Association Statistics Committee and Stroke Statistics Subcommittee. Circulation. 2008;117:e25–146. doi: 10.1161/CIRCULATIONAHA.107.187998. [DOI] [PubMed] [Google Scholar]
- 2.Nudo RJ. Mechanisms for recovery of motor function following cortical damage. Curr Opin Neurobiol. 2006;16:638–644. doi: 10.1016/j.conb.2006.10.004. [DOI] [PubMed] [Google Scholar]
- 3.Nudo RJ. Postinfarct cortical plasticity and behavioral recovery. Stroke. 2007;38:840–845. doi: 10.1161/01.STR.0000247943.12887.d2. [DOI] [PubMed] [Google Scholar]
- 4.Carmichael ST. Cellular and molecular mechanisms of neural repair after stroke: Making waves. Ann Neurol. 2006;59:735–742. doi: 10.1002/ana.20845. [DOI] [PubMed] [Google Scholar]
- 5.Carmichael ST, Archibeque I, Luke L, Nolan T, Momiy J, Li S. Growth-associated gene expression after stroke: Evidence for a growth-promoting region in periinfarct cortex. Exp Neurol. 2005;193:291–311. doi: 10.1016/j.expneurol.2005.01.004. [DOI] [PubMed] [Google Scholar]
- 6.Carmichael ST, Chesselet M. Synchronous neuronal activity is a signal for axonal sprouting after cortical lesions in the adult. J Neurosci. 2002;22:6062–6070. doi: 10.1523/JNEUROSCI.22-14-06062.2002. [DOI] [PMC free article] [PubMed] [Google Scholar]
- 7.Cramer SC, Shah R, Juranek J, Crafton KR, Le V. Activity in the periinfarct rim in relation to recovery from stroke. Stroke. 2006;37:111–115. doi: 10.1161/01.STR.0000195135.70379.1f. [DOI] [PubMed] [Google Scholar]
- 8.Ward NS, Cohen LG. Mechanisms underlying recovery of motor function after stroke. Arch Neurol. 2004;61:1844–1848. doi: 10.1001/archneur.61.12.1844. [DOI] [PMC free article] [PubMed] [Google Scholar]
- 9.Saur D, Lange R, Baumgaertner A, et al. Dynamics of language reorganization after stroke. Brain. 2006;129:1371–1384. doi: 10.1093/brain/awl090. [DOI] [PubMed] [Google Scholar]
- 10.Dancause N, Barbay S, Frost SB, et al. Extensive cortical rewiring after brain injury. J Neurosci. 2005;25:10167–10179. doi: 10.1523/JNEUROSCI.3256-05.2005. [DOI] [PMC free article] [PubMed] [Google Scholar]
- 11.Chen P, Goldberg DE, Kolb B, Lanser M, Benowitz LI. Inosine induces axonal rewiring and improves behavioral outcome after stroke. Proc Natl Acad Sci USA. 2002;99:9031–9036. doi: 10.1073/pnas.132076299. [DOI] [PMC free article] [PubMed] [Google Scholar]
- 12.Tillema J, Byars AW, Jacola LM, et al. Cortical reorganization of language functioning following perinatal left MCA stroke. Brain Lang. 2008;105(2):99–111. doi: 10.1016/j.bandl.2007.07.127. [DOI] [PMC free article] [PubMed] [Google Scholar]
- 13.Szaflarski J, Burtrum D, Silverstein FS. Cerebral hypoxia-ischemia stimulates cytokine gene expression in perinatal rats. Stroke. 1995;26:1093–1100. doi: 10.1161/01.str.26.6.1093. [DOI] [PubMed] [Google Scholar]
- 14.Silverstein FS, Barks JDE, Hagan P, Xiao-Hong L, Ivacko J, Szaflarski JP. Cytokines and perinatal brain injury. Neurochem Int. 1997;30:375–383. doi: 10.1016/s0197-0186(96)00072-1. [DOI] [PubMed] [Google Scholar]
- 15.Ivacko J, Szaflarski J, Malinak C, Flory C, Warren JS, Silverstein FS. Hypoxic-ischemic injury induces monocyte chemoattractant protein-1 expression in neonatal rat brain. J Cereb Blood Flow Metab. 1997;17:759–770. doi: 10.1097/00004647-199707000-00006. [DOI] [PubMed] [Google Scholar]
- 16.Rosen HJ, Petersen SE, Linenweber MR, et al. Neural correlates of recovery from aphasia after damage to left inferior frontal cortex. Neurology. 2000;55:1883–1894. doi: 10.1212/wnl.55.12.1883. [DOI] [PubMed] [Google Scholar]
- 17.Liepert J, Bauder H, Wolfgang HR, Miltner WH, Taub E, Weiller C. Treatment-induced cortical reorganization after stroke in humans. Stroke. 2000;31:1210–1216. doi: 10.1161/01.str.31.6.1210. [DOI] [PubMed] [Google Scholar]
- 18.Liepert J, Uhde I, Graf S, Leidner O, Weiller C. Motor cortex plasticity during forced-use therapy in stroke patients: A preliminary study. J Neurol. 2001;248:315–321. doi: 10.1007/s004150170207. [DOI] [PubMed] [Google Scholar]
- 19.Butler AJ, Page SJ. Mental practice with motor imagery: Evidence for motor recovery and cortical reorganization after stroke. Arch Phys Med Rehabil. 2006;87:2–11. doi: 10.1016/j.apmr.2006.08.326. [DOI] [PMC free article] [PubMed] [Google Scholar]
- 20.Szaflarski JP, Page SJ, Kissela BM, Lee JH, Levine P, Strakowski SM. Cortical reorganization following modified constraint-induced movement therapy: A study of 4 patients with chronic stroke. Arch Phys Med Rehabil. 2006;87:1052–1058. doi: 10.1016/j.apmr.2006.04.018. [DOI] [PubMed] [Google Scholar]
- 21.Tombari D, Loubinoux I, Pariente J, et al. A longitudinal fMRI study: In recovering and then in clinically stable subcortical stroke patients. Neuroimage. 2004;23:827–839. doi: 10.1016/j.neuroimage.2004.07.058. [DOI] [PubMed] [Google Scholar]
- 22.Thulborn KR, Carpenter PA, Just MA. Plasticity of language-related brain function during recovery from stroke. Stroke. 1999;30:749–754. doi: 10.1161/01.str.30.4.749. [DOI] [PubMed] [Google Scholar]
- 23.Jacola LM, Schapiro MB, Schmithorst VJ, et al. Functional magnetic resonance imaging reveals atypical language organization in children following perinatal left middle cerebral artery stroke. Neuropediatrics. 2006;37:46–52. doi: 10.1055/s-2006-923934. [DOI] [PMC free article] [PubMed] [Google Scholar]
- 24.Wagner A, Carmichael S, Kokaia Z, Kessler C, Walker L. The response of the aged brain to stroke: Too much, too soon? Curr Neurovasc Res. 2007;4(12):216–227. doi: 10.2174/156720207781387213. [DOI] [PubMed] [Google Scholar]
- 25.Meinzer M, Flaisch T, Breitenstein C, Wienbruch C, Elbert T, Rockstroh B. Functional re-recruitment of dysfunctional brain areas predicts language recovery in chronic aphasia. NeuroImage. 2008;39:2038–2046. doi: 10.1016/j.neuroimage.2007.10.008. [DOI] [PubMed] [Google Scholar]
- 26.Eaton K, Szaflarski JP, Altaye M, et al. Reliability of fMRI for studies of language in post-stroke aphasia subjects. Neuroimage. 2008;41:311–322. doi: 10.1016/j.neuroimage.2008.02.033. [DOI] [PMC free article] [PubMed] [Google Scholar]
- 27.Holland SK, Vannest J, Mecoli M, et al. Functional MRI of language lateralization during development in children. Int J Audiol. 2007;46:533. doi: 10.1080/14992020701448994. [DOI] [PMC free article] [PubMed] [Google Scholar]
- 28.Szaflarski JP, Holland SK, Schmithorst VJ, Byars AW. fMRI study of language lateralization in children and adults. Hum Brain Mapp. 2006;27:202–212. doi: 10.1002/hbm.20177. [DOI] [PMC free article] [PubMed] [Google Scholar]
- 29.Szaflarski JP, Schmithorst VJ, Altaye M, et al. A longitudinal functional magnetic resonance imaging study of language development in children 5 to 11 years old. Ann Neurol. 2006;59:796–807. doi: 10.1002/ana.20817. [DOI] [PMC free article] [PubMed] [Google Scholar]
- 30.Basser PJ, Mattiello J, LeBihan D. MR diffusion tensor spectroscopy and imaging. Biophys J. 1994;66:259–267. doi: 10.1016/S0006-3495(94)80775-1. [DOI] [PMC free article] [PubMed] [Google Scholar]
- 31.Nardone R, Tezzon F. Inhibitory and excitatory circuits of cerebral cortex after ischaemic stroke: prognostic value of the transcranial magnetic stimulation. Electromyogr Clin Neurophysiol. 2002;42:131–136. [PubMed] [Google Scholar]
- 32.Szaflarski JP, Page S, Levine P, Eliassen J, Pan H. Mental practice: A non-invasive strategy that increases affected arm function and cortical representation. Stroke. 2008;39:679. [Google Scholar]
- 33.Basser PJ, Pierpaoli C. Microstructural and physiological features of tissues elucidated by quantitative-diffusion-tensor MRI. J Magn Reson B. 1996;111:209–219. doi: 10.1006/jmrb.1996.0086. [DOI] [PubMed] [Google Scholar]
- 34.Basser PJ, Pierpaoli C. A simplified method to measure the diffusion tensor from seven MR images. Magn Reson Med. 1998;39:928–934. doi: 10.1002/mrm.1910390610. [DOI] [PubMed] [Google Scholar]
- 35.Melhem ER, Mori S, Mukundan G, Kraut MA, Pomper MG, van Zijl PC. Diffusion tensor MR imaging of the brain and white matter tractography. Am J Roentgenol. 2002;178:3–16. doi: 10.2214/ajr.178.1.1780003. [DOI] [PubMed] [Google Scholar]
- 36.Assaf Y, Pasternak O. Diffusion tensor imaging (DTI)-based white matter mapping in brain research: A review. J Mol Neurosci. 2008;34:51–61. doi: 10.1007/s12031-007-0029-0. [DOI] [PubMed] [Google Scholar]
- 37.Pierpaoli C, Jezzard P, Basser PJ, Barnett A, Di Chiro G. Diffusion tensor MR imaging of the human brain. Radiology. 1996;201:637–648. doi: 10.1148/radiology.201.3.8939209. [DOI] [PubMed] [Google Scholar]
- 38.Moller M, Frandsen J, Andersen G, Gjedde A, Vestergaard-Poulsen P, Ostergaard L. Dynamic changes in corticospinal tracts after stroke detected by fibretracking. J Neurol Neurosurg Psychiatry. 2007;78:587–592. doi: 10.1136/jnnp.2006.100248. [DOI] [PMC free article] [PubMed] [Google Scholar]
- 39.Stinear CM, Barber PA, Smale PR, Coxon JP, Fleming MK, Byblow WD. Functional potential in chronic stroke patients depends on corticospinal tract integrity. Brain. 2007;130:170–180. doi: 10.1093/brain/awl333. [DOI] [PubMed] [Google Scholar]
- 40.Parmar H, Golay X, Lee KE, Hui F, Sitoh YY. Early experiences with diffusion tensor imaging and magnetic resonance tractography in stroke patients. Singapore Med J. 2006;47:198–203. [PubMed] [Google Scholar]
- 41.Maeda T, Ishizaki K, Yura S. Can diffusion tensor imaging predict the functional outcome of supra-tentorial stroke? No To Shinkei. 2005;57:27–32. [PubMed] [Google Scholar]
- 42.Thomalla G, Glauche V, Weiller C, Rother J. Time course of Wallerian degeneration after ischaemic stroke revealed by diffusion tensor imaging. J Neurol Neurosurg Psychiatry. 2005;76:266–268. doi: 10.1136/jnnp.2004.046375. [DOI] [PMC free article] [PubMed] [Google Scholar]
- 43.Khong PL, Zhou LJ, Ooi GC, Chung BH, Cheung RT, Wong VC. The evaluation of Wallerian degeneration in chronic paediatric middle cerebral artery infarction using diffusion tensor MR imaging. Cerebrovasc Dis. 2004;18:240–247. doi: 10.1159/000079961. [DOI] [PubMed] [Google Scholar]
- 44.Watanabe T, Honda Y, Fujii Y, Koyama M, Matsuzawa H, Tanaka R. Three-dimensional anisotropy contrast magnetic resonance axonography to predict the prognosis for motor function in patients suffering from stroke. J Neurosurg. 2001;94:955–960. doi: 10.3171/jns.2001.94.6.0955. [DOI] [PubMed] [Google Scholar]
- 45.Thomalla G, Glauche V, Koch MA, Beaulieu C, Weiller C, Rother J. Diffusion tensor imaging detects early Wallerian degeneration of the pyramidal tract after ischemic stroke. Neuroimage. 2004;22:1767–1774. doi: 10.1016/j.neuroimage.2004.03.041. [DOI] [PubMed] [Google Scholar]
- 46.Werring DJ, Toosy AT, Clark CA, et al. Diffusion tensor imaging can detect and quantify corticospinal tract degeneration after stroke. J Neurol Neurosurg Psychiatry. 2000;69:269–272. doi: 10.1136/jnnp.69.2.269. [DOI] [PMC free article] [PubMed] [Google Scholar]
- 47.Liang Z, Zeng J, Zhang C, et al. Longitudinal investigations on the anterograde and retrograde degeneration in the pyramidal tract following pontine infarction with diffusion tensor imaging. Cerebrovasc Dis. 2008;25:209–216. doi: 10.1159/000113858. [DOI] [PubMed] [Google Scholar]
- 48.Higano S, Zhong J, Shrier DA, et al. Diffusion anisotropy of the internal capsule and the corona radiata in association with stroke and tumors as measured by diffusion-weighted MR imaging. Am J Neuroradiol. 2001;22:456–463. [PMC free article] [PubMed] [Google Scholar]
- 49.Jang SH, Cho SH, Kim YH, et al. Diffusion anisotrophy in the early stages of stroke can predict motor outcome. Restor Neurol Neurosci. 2005;23:11–17. [PubMed] [Google Scholar]
- 50.Binkofski F, Seitz RJ, Arnold S, Classen J, Benecke R, Freund HJ. Thalamic metbolism and corticospinal tract integrity determine motor recovery in stroke. Ann Neurol. 1996;39:460–470. doi: 10.1002/ana.410390408. [DOI] [PubMed] [Google Scholar]
- 51.Herve D, Molko N, Pappata S, et al. Longitudinal thalamic diffusion changes after middle cerebral artery infarcts. J Neurol Neurosurg Psychiatry. 2005;76:200–205. doi: 10.1136/jnnp.2004.041012. [DOI] [PMC free article] [PubMed] [Google Scholar]
- 52.Ogawa T, Yoshida Y, Okudera T, Noguchi K, Kado H, Uemura K. Secondary thalamic degeneration after cerebral infarction in the middle cerebral artery distribution: Evaluation with MR imaging. Radiology. 1997;204:255–262. doi: 10.1148/radiology.204.1.9205256. [DOI] [PubMed] [Google Scholar]
- 53.Tamura A, Tahira Y, Nagashima H, et al. Thalamic atrophy following cerebral infarction in the territory of the middle cerebral artery. Stroke. 1991;22:615–618. doi: 10.1161/01.str.22.5.615. [DOI] [PubMed] [Google Scholar]
- 54.Kertesz A. Neurobiological aspects of recovery from aphasia in stroke. Int Rehabil Med. 1984;6:122–127. doi: 10.3109/03790798409165934. [DOI] [PubMed] [Google Scholar]
- 55.Pedersen PM, Jorgensen HS, Nakayama H, Raaschou HO, Olsen TS. Aphasia in acute stroke: Incidence, determinants, and recovery. Ann Neurol. 1995;38:659–666. doi: 10.1002/ana.410380416. [DOI] [PubMed] [Google Scholar]
- 56.Selnes OA, Van Zijl PCM, Barker PB, Hillis AE, Mori S. MR diffusion tensor imaging documented arcuate fasciculus lesion in a patient with normal repetition performance. Aphasiology. 2002;16:897. [Google Scholar]
- 57.Breier JI, Hasan KM, Zhang W, Men D, Papanicolaou AC. Language dysfunction after stroke and damage to white matter tracts evaluated using diffusion tensor imaging. Am J Neuroradiol. 2007;29:483–487. doi: 10.3174/ajnr.A0846. [DOI] [PMC free article] [PubMed] [Google Scholar]
- 58.Pajevic S, Pierpaoli C. Color schemes to represent the orientation of anisotropic tissues from diffusion tensor data: Application to white matter fiber tract mapping in the human brain. Magn Reson Med. 1999;42:526–540. [PubMed] [Google Scholar]
- 59.Cho SH, Kim DG, Kim DS, Kim YH, Lee CH, Jang SH. Motor outcome according to the integrity of the corticospinal tract determined by diffusion tensor tractography in the early stage of corona radiata infarct. Neurosci Lett. 2007;426:123–127. doi: 10.1016/j.neulet.2007.08.049. [DOI] [PubMed] [Google Scholar]
- 60.Cho SH, Kim SH, Choi BY, et al. Motor outcome according to diffusion tensor tractography findings in the early stage of intracerebral hemorrhage. Neurosci Lett. 2007;421:142–146. doi: 10.1016/j.neulet.2007.04.052. [DOI] [PubMed] [Google Scholar]
- 61.Gillard JH, Papadakis NG, Martin K, et al. MR diffusion tensor imaging of white matter tract disruption in stroke at 3 T. Br J Radiol. 2001;74:642–647. doi: 10.1259/bjr.74.883.740642. [DOI] [PubMed] [Google Scholar]
- 62.Kwon YH, Lee CH, Ahn SH, et al. Motor recovery via the periinfarct area in patients with corona radiata infarct. NeuroRehabilitation. 2007;22:105–108. [PubMed] [Google Scholar]
- 63.Jang SH, Byun WM, Han BS, et al. Recovery of a partially damaged corticospinal tract in a patient with intracerebral hemorrhage: A diffusion tensor image study. Restor Neurol Neurosci. 2006;24:25–29. [PubMed] [Google Scholar]
- 64.Tallan HH, Moore S, Stein WH. N-acetyl-L-aspartic acid in brain. J Biol Chem. 1956;219:257–264. [PubMed] [Google Scholar]
- 65.Kobayashi M, Takayama H, Suga S, Mihara B. Longitudinal changes of metabolites in frontal lobes after hemorrhagic stroke of basal ganglia: A proton magnetic resonance spectroscopy study. Stroke. 2001;32:2237–2245. doi: 10.1161/hs1001.096621. [DOI] [PubMed] [Google Scholar]
- 66.Moffett JR, Ross B, Arun P, Madhavarao CN, Namboodiri AM. N-acetylaspartate in the CNS: From neurodiagnostics to neurobiology. Prog Neurobiol. 2007;81:89–131. doi: 10.1016/j.pneurobio.2006.12.003. [DOI] [PMC free article] [PubMed] [Google Scholar]
- 67.Gideon P, Henriksen O, Sperling B, et al. Early time course of N-acetylaspartate, creatine and phosphocreatine, and compounds containing choline in the brain after acute stroke. A proton magnetic resonance spectroscopy study. Stroke. 1992;23:1566–1572. doi: 10.1161/01.str.23.11.1566. [DOI] [PubMed] [Google Scholar]
- 68.Graham GD, Blamire AM, Rothman DL, et al. Early temporal variation of cerebral metabolites after human stroke. A proton magnetic resonance spectroscopy study. Stroke. 1993;24:1891–1896. doi: 10.1161/01.str.24.12.1891. [DOI] [PubMed] [Google Scholar]
- 69.Saunders DE, Howe FA, van den Boogaart A, McLean MA, Griffiths JR, Brown MM. Continuing ischemic damage after acute middle cerebral artery infarction in humans demonstrated by short-echo proton spectroscopy. Stroke. 1995;26:1007–1013. doi: 10.1161/01.str.26.6.1007. [DOI] [PubMed] [Google Scholar]
- 70.Provencher SW. Estimation of metabolite concentrations from localized in vivo proton NMR spectra. Magn Reson Med. 1993;30:672–679. doi: 10.1002/mrm.1910300604. [DOI] [PubMed] [Google Scholar]
- 71.Chu WJ, Hetherington HP, Kuzniecky RI, Simor T, Mason GF, Elgavish GA. Lateralization of human temporal lobe epilepsy by 31P NMR spectroscopic imaging at 4.1 T. Neurology. 1998;51:472–479. doi: 10.1212/wnl.51.2.472. [DOI] [PubMed] [Google Scholar]
- 72.Saunders DE. MR spectroscopy in stroke. Br Med Bull. 2000;56:334–345. doi: 10.1258/0007142001903256. [DOI] [PubMed] [Google Scholar]
- 73.Urenjak J, Williams SR, Gadian DG, Noble M. Proton nuclear magnetic resonance spectroscopy unambiguously identifies different neural cell types. J Neurosci. 1993;13:981–989. doi: 10.1523/JNEUROSCI.13-03-00981.1993. [DOI] [PMC free article] [PubMed] [Google Scholar]
- 74.Hetherington HP, Pan JW, Mason GF, et al. Quantitative 1H spectroscopic imaging of human brain at 4.1 T using image segmentation. Magn Reson Med. 1996;36:21–29. doi: 10.1002/mrm.1910360106. [DOI] [PubMed] [Google Scholar]
- 75.Miller BL. A review of chemical issues in 1H NMR spectroscopy: N-acetyl-L-aspartate, creatine and choline. NMR Biomed. 1991;4:47–52. doi: 10.1002/nbm.1940040203. [DOI] [PubMed] [Google Scholar]
- 76.Hugg JW, Duijn JH, Matson GB, et al. Elevated lactate and alkalosis in chronic human brain infarction observed by 1H and 31P MR spectroscopic imaging. J Cereb Blood Flow Metab. 1992;12:734–744. doi: 10.1038/jcbfm.1992.104. [DOI] [PubMed] [Google Scholar]
- 77.Gillard JH, Barker PB, van Zijl PC, Bryan RN, Oppenheimer SM. Proton MR spectroscopy in acute middle cerebral artery stroke. Am J Neuroradiol. 1996;17:873–886. [PMC free article] [PubMed] [Google Scholar]
- 78.Hu J, Yang S, Xuan Y, Jiang Q, Yang Y, Haacke EM. Simultaneous detection of resolved glutamate, glutamine, and gamma-aminobutyric acid at 4 T. J Magn Reson. 2007;185:204–213. doi: 10.1016/j.jmr.2006.12.010. [DOI] [PMC free article] [PubMed] [Google Scholar]
- 79.Hurd R, Sailasuta N, Srinivasan R, Vigneron DB, Pelletier D, Nelson SJ. Measurement of brain glutamate using TE-averaged PRESS at 3T. Magn Reson Med. 2004;51:435–440. doi: 10.1002/mrm.20007. [DOI] [PubMed] [Google Scholar]
- 80.Saunders DE, Clifton AG, Brown MM. Measurement of infarct size using MRI predicts prognosis in middle cerebral artery infarction. Stroke. 1995;26:2272–2276. doi: 10.1161/01.str.26.12.2272. [DOI] [PubMed] [Google Scholar]
- 81.Pereira AC, Saunders DE, Doyle VL, et al. Measurement of initial N-acetyl aspartate concentration by magnetic resonance spectroscopy and initial infarct volume by MRI predicts outcome in patients with middle cerebral artery territory infarction. Stroke. 1999;30:1577–1582. doi: 10.1161/01.str.30.8.1577. [DOI] [PubMed] [Google Scholar]
- 82.Ford CC, Griffey RH, Matwiyoff NA, Rosenberg GA. Multivoxel 1H-MRS of stroke. Neurology. 1992;42:1408–1412. doi: 10.1212/wnl.42.7.1408. [DOI] [PubMed] [Google Scholar]
- 83.Chemerinski E, Robinson RG. The neuropsychiatry of stroke. Psychosomatics. 2000;41:5–14. doi: 10.1016/S0033-3182(00)71168-6. [DOI] [PubMed] [Google Scholar]
- 84.Glodzik-Sobanska L, Slowik A, McHugh P, et al. Single voxel proton magnetic resonance spectroscopy in post-stroke depression. Psychiatry Res. 2006;148:111–120. doi: 10.1016/j.pscychresns.2006.08.004. [DOI] [PubMed] [Google Scholar]
- 85.Seitz RJ, Azari NP, Knorr U, Binkofski F, Herzog H, Freund HJ. The role of diaschisis in stroke recovery. Stroke. 1999;30:1844–1850. doi: 10.1161/01.str.30.9.1844. [DOI] [PubMed] [Google Scholar]
- 86.Chu WJ, Mason GF, Pan JW, et al. Regional cerebral blood flow and magnetic resonance spectroscopic imaging findings in diaschisis from stroke. Stroke. 2002;33:1243–1248. doi: 10.1161/01.str.0000015240.75199.be. [DOI] [PubMed] [Google Scholar]
- 87.Mountz JM. Nuclear medicine in the rehabilitative treatment evaluation in stroke recovery. role of diaschisis resolution and cerebral reorganization. Eura Medicophys. 2007;43:221–239. [PubMed] [Google Scholar]
- 88.Azzopardi D, Wyatt JS, Cady EB, et al. Prognosis of newborn infants with hypoxic-ischemic brain injury assessed by phosphorus magnetic resonance spectroscopy. Pediatr Res. 1989;25:445–451. doi: 10.1203/00006450-198905000-00004. [DOI] [PubMed] [Google Scholar]
- 89.Goplerud JM, Delivoria-Papadopoulos M. Nuclear magnetic resonance imaging and spectroscopy following asphyxia. Clin Perinatol. 1993;20:345–367. [PubMed] [Google Scholar]
- 90.Kato T, Tokumaru A, O’uchi T, et al. Assessment of brain death in children by means of P-31 MR spectroscopy: Preliminary note. Work in progress. Radiology. 1991;179:95–99. doi: 10.1148/radiology.179.1.2006312. [DOI] [PubMed] [Google Scholar]
- 91.Moorcraft J, Bolas NM, Ives NK, et al. Global and depth resolved phosphorus magnetic resonance spectroscopy to predict outcome after birth asphyxia. Arch Dis Child. 1991;66:1119–1123. doi: 10.1136/adc.66.10_spec_no.1119. [DOI] [PMC free article] [PubMed] [Google Scholar]
- 92.Ruiz-Cabello J, Cohen JS. Phospholipid metabolites as indicators of cancer cell function. NMR Biomed. 1992;5:226–233. doi: 10.1002/nbm.1940050506. [DOI] [PubMed] [Google Scholar]
- 93.Sappey-Marinier D, Hubesch B, Matson GB, Weiner MW. Decreased phosphorus metabolite concentrations and alkalosis in chronic cerebral infarction. Radiology. 1992;182:29–34. doi: 10.1148/radiology.182.1.1727305. [DOI] [PubMed] [Google Scholar]
- 94.Adler S, Simplaceanu V, Ho C. Brain pH in acute isocapnic metabolic acidosis and hypoxia: A 31P-nuclear magnetic resonance study. Am J Physiol. 1990;258:F34–40. doi: 10.1152/ajprenal.1990.258.1.F34. [DOI] [PubMed] [Google Scholar]
- 95.Raley-Susman KM, Cragoe EJ, Jr, Sapolsky RM, Kopito RR. Regulation of intracellular pH in cultured hippo-campal neurons by an amiloride-insensitive Na+/H+ exchanger. J Biol Chem. 1991;266:2739–2745. [PubMed] [Google Scholar]
- 96.Hugg JW, Matson GB, Twieg DB, Maudsley AA, Sappey-Marinier D, Weiner MW. Phosphorus-31 MR spectroscopic imaging (MRSI) of normal and pathological human brains. Magn Reson Imaging. 1992;10:227–243. doi: 10.1016/0730-725x(92)90483-g. [DOI] [PubMed] [Google Scholar]
- 97.Markus R, Reutens DC, Kazui S, et al. Hypoxic tissue in ischaemic stroke: Persistence and clinical consequences of spontaneous survival. Brain. 2004;127:1427–1436. doi: 10.1093/brain/awh162. [DOI] [PubMed] [Google Scholar]
- 98.Heiss WD, Graf R, Wienhard K. Relevance of experimental ischemia in cats for stroke management: A comparative reevaluation. Cerebrovasc Dis. 2001;11:73–81. doi: 10.1159/000047616. [DOI] [PubMed] [Google Scholar]
- 99.Heiss WD, Herholz K. Brain receptor imaging. J Nucl Med. 2006;47:302–312. [PubMed] [Google Scholar]
- 100.Hatazawa J, Satoh T, Shimosegawa E, et al. Evaluation of cerebral infarction with iodine 123-iomazenil SPECT. J Nucl Med. 1995;36:2154–2161. [PubMed] [Google Scholar]
- 101.Hatazawa J, Shimosegawa E. Imaging neurochemistry of cerebrovascular disease with PET and SPECT. Q J Nucl Med. 1998;42:193–198. [PubMed] [Google Scholar]
- 102.Koshi Y, Kitamura S, Ohyama M, et al. Benzodiazepine receptor imaging with iomazenil SPECT in aphasic patients with cerebral infarction. Ann Nucl Med. 1999;13:223–229. doi: 10.1007/BF03164896. [DOI] [PubMed] [Google Scholar]
- 103.Farde L, Pauli S, Hall H, et al. Stereoselective binding of 11C-raclopride in living human brain--a search for extrastriatal central D2-dopamine receptors by PET. Psychopharmacology (Berl) 1988;94:471–478. doi: 10.1007/BF00212840. [DOI] [PubMed] [Google Scholar]
- 104.Mukherjee J, Christian BT, Dunigan KA, et al. Brain imaging of 18F-fallypride in normal volunteers: Blood analysis, distribution, test-retest studies, and preliminary assessment of sensitivity to aging effects on dopamine D-2/D-3 receptors. Synapse. 2002;46:170–188. doi: 10.1002/syn.10128. [DOI] [PubMed] [Google Scholar]
- 105.Kung HF, Alavi A, Chang W, et al. In vivo SPECT imaging of CNS D-2 dopamine receptors: Initial studies with iodine-123-IBZM in humans. J Nucl Med. 1990;31:573–579. [PubMed] [Google Scholar]
- 106.Kauppinen TA, Bergstrom KA, Heikman P, Hiltunen J, Ahonen AK. Biodistribution and radiation dosimetry of [123I]ADAM in healthy human subjects: Preliminary results. Eur J Nucl Med Mol Imaging. 2003;30:132–136. doi: 10.1007/s00259-002-1027-7. [DOI] [PubMed] [Google Scholar]
- 107.Lundberg J, Odano I, Olsson H, Halldin C, Farde L. Quantification of 11C-MADAM binding to the serotonin transporter in the human brain. J Nucl Med. 2005;46:1505–1515. [PubMed] [Google Scholar]
- 108.Houle S, Ginovart N, Hussey D, Meyer JH, Wilson AA. Imaging the serotonin transporter with positron emission tomography: Initial human studies with [11C]DAPP and [11C]DASB. Eur J Nucl Med. 2000;27:1719–1722. doi: 10.1007/s002590000365. [DOI] [PubMed] [Google Scholar]
- 109.Kung HF, Kim HJ, Kung MP, Meegalla SK, Plossl K, Lee HK. Imaging of dopamine transporters in humans with technetium-99m TRODAT-1. Eur J Nucl Med. 1996;23:1527–1530. doi: 10.1007/BF01254479. [DOI] [PubMed] [Google Scholar]
- 110.van Dyck CH, Seibyl JP, Malison RT, et al. Age-related decline in striatal dopamine transporter binding with iodine-123-beta-CITSPECT. J Nucl Med. 1995;36:1175–1181. [PubMed] [Google Scholar]
- 111.Kazumata K, Dhawan V, Chaly T, et al. Dopamine transporter imaging with fluorine-18-FPCIT and PET. J Nucl Med. 1998;39:1521–1530. [PubMed] [Google Scholar]
- 112.Chaly T, Dhawan V, Kazumata K, et al. Radiosynthesis of [18F] N-3-fluoropropyl-2-beta-carbometh-oxy-3-beta-(4-iodophenyl) nortropane and the first human study with positron emission tomography. Nucl Med Biol. 1996;23:999–1004. doi: 10.1016/s0969-8051(96)00155-2. [DOI] [PubMed] [Google Scholar]
- 113.Muller V, Saur D, Klutmann S, Weiller C, Rother J, Clausen M. Experience with 123I-iomazenil SPECT in acute cerebral infarction. Nucl Med Commun. 2002;23:1191–1196. doi: 10.1097/00006231-200212000-00007. [DOI] [PubMed] [Google Scholar]
- 114.Mountz JM, Liu HG, Deutsch G. Neuroimaging in cerebrovascular disorders: Measurement of cerebral physiology after stroke and assessment of stroke recovery. Semin Nucl Med. 2003;33:56–76. doi: 10.1053/snuc.2003.127293. [DOI] [PubMed] [Google Scholar]
- 115.Saha GB, MacIntyre WJ, Go RT. Radiopharmaceuticals for brain imaging. Semin Nucl Med. 1994;24:324–349. doi: 10.1016/s0001-2998(05)80022-4. [DOI] [PubMed] [Google Scholar]
- 116.Baron JC, D’Antona R, Pantano P, Serdaru M, Samson Y, Bousser MG. Effects of thalamic stroke on energy metabolism of the cerebral cortex. A positron tomography study in man. Brain. 1986;109(Pt 6):1243–1259. doi: 10.1093/brain/109.6.1243. [DOI] [PubMed] [Google Scholar]
- 117.Baron JC, D’Antona R, Serdaru M, Pantano P, Bousser MG, Samson Y. Cortical hypometabolism after a thalamic lesion in man: Positron tomography study. Rev Neurol (Paris) 1986;142:465–474. [PubMed] [Google Scholar]
- 118.Iglesias S, Marchal G, Rioux P, et al. Do changes in oxygen metabolism in the unaffected cerebral hemisphere underlie early neurological recovery after stroke? A positron emission tomography study. Stroke. 1996;27:1192–1199. doi: 10.1161/01.str.27.7.1192. [DOI] [PubMed] [Google Scholar]
- 119.Choi JY, Lee KH, Na DL, et al. Subcortical aphasia after striatocapsular infarction: Quantitative analysis of brain perfusion SPECT using statistical parametric mapping and a statistical probabilistic anatomic map. J Nucl Med. 2007;48:194–200. [PubMed] [Google Scholar]
- 120.Cappa SF, Perani D, Grassi F, et al. A PET follow-up study of recovery after stroke in acute aphasics. Brain Lang. 1997;56:55–67. doi: 10.1006/brln.1997.1737. [DOI] [PubMed] [Google Scholar]
- 121.Pantano P, Di Piero V, Fieschi C, Judica A, Guariglia C, Pizzamiglio L. Pattern of CBF in the rehabilitation of visuospatial neglect. Int J Neurosci. 1992;66:153–161. [PubMed] [Google Scholar]
- 122.Hanlon RE, Dobkin BH, Hadler B, Ramirez S, Cheska Y. Neurorehabilitation following right thalamic infarct: Effects of cognitive retraining on functional performance. J Clin Exp Neuropsychol. 1992;14:433–447. doi: 10.1080/01688639208402836. [DOI] [PubMed] [Google Scholar]
- 123.Adair JC, Nadeau SE, Conway TW, et al. Alterations in the functional anatomy of reading induced by rehabilitation of an alexic patient. Neuropsychiatry Neuropsychol Behav Neurol. 2000;13:303–311. [PubMed] [Google Scholar]
- 124.Nelles G, Jentzen W, Jueptner M, Muller S, Diener HC. Arm training induced brain plasticity in stroke studied with serial positron emission tomography. Neuroimage. 2001;13:1146–1154. doi: 10.1006/nimg.2001.0757. [DOI] [PubMed] [Google Scholar]
- 125.Kononen M, Kuikka JT, Husso-Saastamoinen M, et al. Increased perfusion in motor areas after constraint-induced movement therapy in chronic stroke: A single-photon emission computerized tomography study. J Cereb Blood Flow Metab. 2005;25:1668–1674. doi: 10.1038/sj.jcbfm.9600158. [DOI] [PubMed] [Google Scholar]
- 126.Hodics T, Cohen LG, Cramer SC. Functional imaging of intervention effects in stroke motor rehabilitation. Arch Phys Med Rehabil. 2006;87:S36–42. doi: 10.1016/j.apmr.2006.09.005. [DOI] [PubMed] [Google Scholar]
- 127.Ogawa S, Lee TM, Kay AR, Tank DW. Brain magnetic resonance imaging with contrast dependent on blood oxygenation. Proc Natl Acad Sci USA. 1990;87:9868–9872. doi: 10.1073/pnas.87.24.9868. [DOI] [PMC free article] [PubMed] [Google Scholar]
- 128.Bandettini PA, Jesmanowicz A, Wong EC, Hyde JS. Processing strategies for time-course data sets in functional MRI of the human brain. Magn Reson Med. 1993;30:161–173. doi: 10.1002/mrm.1910300204. [DOI] [PubMed] [Google Scholar]
- 129.Di Salle F, Formisano E, Linden DE, et al. Exploring brain function with magnetic resonance imaging. Eur J Radiol. 1999;30:84–94. doi: 10.1016/s0720-048x(99)00047-9. [DOI] [PubMed] [Google Scholar]
- 130.Kim JA, Eliassen JC, Sanes JN. Movement quantity and frequency coding in human motor areas. J Neurophysiol. 2005;94:2504–2511. doi: 10.1152/jn.01047.2004. [DOI] [PubMed] [Google Scholar]
- 131.Buckner RL, Bandettini PA, O’Craven KM, et al. Detection of cortical activation during averaged single trials of a cognitive task using functional magnetic resonance imaging. Proc Natl Acad Sci USA. 1996;93:14878–14883. doi: 10.1073/pnas.93.25.14878. [DOI] [PMC free article] [PubMed] [Google Scholar]
- 132.Szaflarski JP, Holland SK, Schmithorst VJ, Dunn RS, Privitera MD. High-resolution functional MRI at 3T in healthy and epilepsy subjects: Hippocampal activation with picture encoding task. Epilepsy Behav. 2004;5:244–252. doi: 10.1016/j.yebeh.2004.01.002. [DOI] [PubMed] [Google Scholar]
- 133.Johansen-Berg H, Dawes H, Guy C, Smith SM, Wade DT, Matthews PM. Correlation between motor improvements and altered fMRI activity after rehabilitative therapy. Brain. 2002;125:2731–2742. doi: 10.1093/brain/awf282. [DOI] [PubMed] [Google Scholar]
- 134.Schaechter JD, Kraft E, Hilliard TS, et al. Motor recovery and cortical reorganization after constraint-induced movement therapy in stroke patients: A preliminary study. Neurorehabil Neural Repair. 2002;16:326–338. doi: 10.1177/154596830201600403. [DOI] [PubMed] [Google Scholar]
- 135.Peck KK, Moore AB, Crosson BA, et al. Functional magnetic resonance imaging before and after aphasia therapy: Shifts in hemodynamic time to peak during an overt language task. Stroke. 2004;35:554–559. doi: 10.1161/01.STR.0000110983.50753.9D. [DOI] [PubMed] [Google Scholar]
- 136.Luft AR, McCombe-Waller S, Whitall J, et al. Repetitive bilateral arm training and motor cortex activation in chronic stroke: A randomized controlled trial. JAMA. 2004;292:1853–1861. doi: 10.1001/jama.292.15.1853. [DOI] [PMC free article] [PubMed] [Google Scholar]
- 137.Strangman G, Culver JP, Thompson JH, Boas DA. A quantitative comparison of simultaneous BOLD fMRI and NIRS recordings during functional brain activation. Neuroimage. 2002;17:719–731. [PubMed] [Google Scholar]
- 138.Boas DA, Dale AM, Franceschini MA. Diffuse optical imaging of brain activation: Approaches to optimizing image sensitivity, resolution, and accuracy. Neuroimage. 2004;23(Suppl 1):S275–288. doi: 10.1016/j.neuroimage.2004.07.011. [DOI] [PubMed] [Google Scholar]
- 139.Izzetoglu M, Izzetoglu K, Bunce S, et al. Functional near-infrared neuroimaging. IEEE Trans Neural Syst Rehabil Eng. 2005;13:153–159. doi: 10.1109/TNSRE.2005.847377. [DOI] [PubMed] [Google Scholar]
- 140.Gratton G, Fabiani M, Corballis PM, et al. Fast and localized event-related optical signals (EROS) in the human occipital cortex: Comparisons with the visual evoked potential and fMRI. Neuroimage. 1997;6:168–180. doi: 10.1006/nimg.1997.0298. [DOI] [PubMed] [Google Scholar]
- 141.Mihara M, Miyai I, Hatakenaka M, Kubota K, Sakoda S. Sustained prefrontal activation during ataxic gait: A compensatory mechanism for ataxic stroke? Neuroimage. 2007;37:1338–1345. doi: 10.1016/j.neuroimage.2007.06.014. [DOI] [PubMed] [Google Scholar]
- 142.Kato H, Izumiyama M, Koizumi H, Takahashi A, Itoyama Y. Near-infrared spectroscopic topography as a tool to monitor motor reorganization after hemiparetic stroke: A comparison with functional MRI. Stroke. 2002;33:2032–2036. doi: 10.1161/01.str.0000021903.52901.97. [DOI] [PubMed] [Google Scholar]
- 143.Takeda K, Gomi Y, Imai I, Shimoda N, Hiwatari M, Kato H. Shift of motor activation areas during recovery from hemiparesis after cerebral infarction: A longitudinal study with near-infrared spectroscopy. Neurosci Res. 2007;59:136–144. doi: 10.1016/j.neures.2007.06.1466. [DOI] [PubMed] [Google Scholar]
- 144.Miyai I, Yagura H, Hatakenaka M, Oda I, Konishi I, Kubota K. Longitudinal optical imaging study for locomotor recovery after stroke. Stroke. 2003;34:2866–2870. doi: 10.1161/01.STR.0000100166.81077.8A. [DOI] [PubMed] [Google Scholar]
- 145.Keren O, Ring H, Solzi P, Pratt H, Groswasser Z. Upper limb somatosensory evoked potentials as a predictor of rehabilitation progress in dominant hemisphere stroke patients. Stroke. 1993;24:1789–1793. doi: 10.1161/01.str.24.12.1789. [DOI] [PubMed] [Google Scholar]
- 146.D’Arcy RC, Marchand Y, Eskes GA, et al. Electrophysiological assessment of language function following stroke. Clin Neurophysiol. 2003;114:662–672. doi: 10.1016/s1388-2457(03)00007-5. [DOI] [PubMed] [Google Scholar]
- 147.Strens LH, Asselman P, Pogosyan A, Loukas C, Thompson AJ, Brown P. Corticocortical coupling in chronic stroke: Its relevance to recovery. Neurology. 2004;63:475–484. doi: 10.1212/01.wnl.0000133010.69694.f8. [DOI] [PubMed] [Google Scholar]
- 148.Meinzer M, Elbert T, Wienbruch C, Djundja D, Barthel G, Rockstroh B. Intensive language training enhances brain plasticity in chronic aphasia. BMC Biol. 2004;2:20. doi: 10.1186/1741-7007-2-20. [DOI] [PMC free article] [PubMed] [Google Scholar]
- 149.Tecchio F, Zappasodi F, Tombini M, Caulo M, Vernieri F, Rossini PM. Interhemispheric asymmetry of primary hand representation and recovery after stroke: A MEG study. Neuroimage. 2007;36:1057–1064. doi: 10.1016/j.neuroimage.2007.02.058. [DOI] [PubMed] [Google Scholar]
- 150.Miller MB, Fendrich R, Eliassen JC, Demirel S, Gazzaniga MS. Transcranial magnetic stimulation: Delays in visual suppression due to luminance changes. Neuroreport. 1996;7:1740–1744. [PubMed] [Google Scholar]
- 151.Ward NS. Future perspectives in functional neuroimaging in stroke recovery. Eura Medicophys. 2007;43:285–294. [PubMed] [Google Scholar]
- 152.Rapisarda G, Bastings E, de Noordhout AM, Pennisi G, Delwaide PJ. Can motor recovery in stroke patients be predicted by early transcranial magnetic stimulation? Stroke. 1996;27:2191–2196. doi: 10.1161/01.str.27.12.2191. [DOI] [PubMed] [Google Scholar]
- 153.Nascimbeni A, Gaffuri A, Imazio P. Motor evoked potentials: Prognostic value in motor recovery after stroke. Funct Neurol. 2006;21:199–203. [PubMed] [Google Scholar]
- 154.Nascimbeni A, Gaffuri A, Granella L, Colli M, Imazio P. Prognostic value of motor evoked potentials in stroke motor outcome. Eura Medicophys. 2005;41:125–130. [PubMed] [Google Scholar]
- 155.Escudero JV, Sancho J, Bautista D, Escudero M, Lopez-Trigo J. Prognostic value of motor evoked potential obtained by transcranial magnetic brain stimulation in motor function recovery in patients with acute ischemic stroke. Stroke. 1998;29:1854–1859. doi: 10.1161/01.str.29.9.1854. [DOI] [PubMed] [Google Scholar]
- 156.Swayne OB, Rothwell JC, Ward NS, Greenwood RJ. Stages of motor output reorganization after hemispheric stroke suggested by longitudinal studies of cortical physiology. Cereb Cortex. 2008;18:1909–1022. doi: 10.1093/cercor/bhm218. [DOI] [PMC free article] [PubMed] [Google Scholar]
- 157.Tarkka IM, Kononen M, Pitkanen K, Sivenius J, Mervaala E. Alterations in cortical excitability in chronic stroke after constraint-induced movement therapy. Neurol Res. 2008 Feb 15; doi: 10.1179/016164107X252519. [Epub ahead of print] [DOI] [PubMed] [Google Scholar]
- 158.Manganotti P, Patuzzo S, Cortese F, Palermo A, Smania N, Fiaschi A. Motor disinhibition in affected and unaffected hemisphere in the early period of recovery after stroke. Clin Neurophysiol. 2002;113:936–943. doi: 10.1016/s1388-2457(02)00062-7. [DOI] [PubMed] [Google Scholar]
- 159.Winhuisen L, Thiel A, Schumacher B, et al. The right inferior frontal gyrus and poststroke aphasia: A follow-up investigation. Stroke. 2007;38:1286–1292. doi: 10.1161/01.STR.0000259632.04324.6c. [DOI] [PubMed] [Google Scholar]
- 160.Winhuisen L, Thiel A, Schumacher B, et al. Role of the contralateral inferior frontal gyrus in recovery of language function in poststroke aphasia: A combined repetitive transcranial magnetic stimulation and positron emission tomography study. Stroke. 2005;36:1759–1763. doi: 10.1161/01.STR.0000174487.81126.ef. [DOI] [PubMed] [Google Scholar]
- 161.Thickbroom GW, Byrnes ML, Archer SA, Mastaglia FL. Motor outcome after subcortical stroke correlates with the degree of cortical reorganization. Clin Neurophysiol. 2004;115:2144–2150. doi: 10.1016/j.clinph.2004.04.001. [DOI] [PubMed] [Google Scholar]
- 162.Boake C, Noser EA, Ro T, et al. Constraint-induced movement therapy during early stroke rehabilitation. Neurorehabil Neural Repair. 2007;21:14–24. doi: 10.1177/1545968306291858. [DOI] [PubMed] [Google Scholar]
- 163.Liepert J, Miltner WH, Bauder H, et al. Motor cortex plasticity during constraint-induced movement therapy in stroke patients. Neurosci Lett. 1998;250:5–8. doi: 10.1016/s0304-3940(98)00386-3. [DOI] [PubMed] [Google Scholar]
- 164.National Stroke Association. [Accessed March 29, 2008]; http://www.stroke.org/site/PageServer?pagename=SURV. Available at: http://www.stroke.org/site/PageServer?pagename=SURV.
- 165.Heiss WD, Thiel A. A proposed regional hierarchy in recovery of post-stroke aphasia. Brain Lang. 2006;98:118–123. doi: 10.1016/j.bandl.2006.02.002. [DOI] [PubMed] [Google Scholar]
- 166.Kinsbourne M, Hicks RE. Functional cerebral space: A model for overflow, transfer and interference effects in human performance: A tutorial review. In: Requin J, editor. Attention and Performance VII. New York: Erlbaum; 1978. p. 730. [Google Scholar]
- 167.Cohen MJ, Branch WB, Willis WG, Weyandt LL, Hynd GW. Handbook of Neuropsychological Assessment: A Biopsychosocial Perspective. New York: Plenum Press; 1992. Childhood; p. 49. [Google Scholar]
- 168.Kinsbourne M. Hemispheric specialization and the growth of human understanding. Am Psychol. 1982;37:411–420. doi: 10.1037//0003-066x.37.4.411. [DOI] [PubMed] [Google Scholar]
- 169.Wiesendanger M. Constantin von monakow (1853–1930): A pioneer in interdisciplinary brain research and a humanist. C R Biol. 2006;329:406–418. doi: 10.1016/j.crvi.2006.03.011. [DOI] [PubMed] [Google Scholar]
- 170.Gispert JD, Pascau J, Reig S, et al. Influence of the normalization template on the outcome of statistical parametric mapping of PET scans. Neuroimage. 2003;19:601–612. doi: 10.1016/s1053-8119(03)00072-7. [DOI] [PubMed] [Google Scholar]