

Abstract
A number of statistical methods are widely used to describe allelic variation at specific genetic loci and its implication on the evolutionary history of these loci. Although the methods were developed primarily to study allelic variation at loci that are virtually always present in the genome, they are often applied to data of gene content variation (i.e. presence/absence of multiple homologous genes) at the killer immunoglobulin-like receptor (KIR) gene cluster. In this paper we discuss methodological issues involved in the analysis of gene content variation data in the KIR region, and also its covariation with polymorphism at the HLA class I loci, which encode ligands for KIR. A comparison of several statistical methods and measures (gene frequency, haplotype frequency, and linkage disequilibrium estimation) using CEPH data will be provided using KIR haplotypes that have been determined by segregation analysis, noting the strengths and weaknesses of the methods when only the presence/absence data is considered. Finally, application of these methods to a set of globally distributed populations is described (see Single et al. 2007) in order to illustrate the challenges faced when inferring the joint effects of natural selection and demographic history on these immune related genes.
Introduction
The killer cell immunoglobulin-like receptor (KIR) gene cluster encompasses a segment of about 150 kb within the Leukocyte Receptor Complex (LRC) on chromosome 19q13.4 (Figure 1). KIR genes are tandemly arrayed and their haplotypes display both gene content (i.e. presence/absence of each gene) and allelic variation (Shilling et al. 2002). Over 37 KIR haplotypes differing in gene content have been identified by segregation analysis to date (Khakoo and Carrington 2006), which is undoubtedly an under-estimation of the total number, given the large number of KIR gene profiles (i.e. the set of KIR genes present within a given individual, without knowing whether each gene is present on one or both haplotypes) that have been observed across populations to date. The KIR genes share high sequence similarity (85-99%) such that nonallelic homologous recombination (NAHR) may occur frequently at this locus, as it does at other tandemly arrayed homologous sequences (Carrington and Cullen 2004; Stankiewicz and Lupski 2002), resulting in expansion and contraction of haplotypes as well as rearrangement of gene order across haplotypes.
Figure 1.

Genomic organization of the KIR gene cluster in the leukocyte receptor cluster (LRC). The LRC is located on chromosome 19q13.4. KIR genes in the LRC are shown shaded in light purple. Within the KIR gene cluster framework genes are filled in gray, genes encoding activating receptors are in red, those for inhibitory receptors are in green, and the KIR2DP1 pseudogene is colored yellow.
KIR haplotypes can be split into two basic types, termed A or B, depending on the presence of a single or multiple activating KIR genes, respectively (Uhrberg et al. 1997). KIR2DS4 is the only activating KIR gene present on A haplotypes, and a common null 2DS4 allele characterized by a 21 base pair deletion in the transmembrane domain (Maxwell et al. 2002) results in the complete absence of activating receptors on most A haplotypes. The frequency of group A haplotypes (which differ from each other only in terms of allelic polymorphism and not gene content) is roughly equivalent to that of group B haplotypes (which differ from one another both in terms of gene content and allelic variability) among individuals of European descent (Hsu et al. 2002), but this distribution varies across distinct populations (Toneva et al. 2001; Yawata et al. 2002).
KIR are expressed on and modulate activity of natural killer (NK) cells, which are important components of the innate immune response against infected or transformed cells through production of cytokines and direct cytotoxicity. KIR are also expressed on a subset of T cells and have been implicated in contributing to acquired immune responses. Given the function of KIR in regulating immune responses, the extensive variation across KIR haplotypes, and the specificity of KIR for the highly polymorphic HLA class I loci, it is not surprising that variation at loci within this region has been found to associate with certain disease outcomes, generally in combination with their HLA class I ligands (Kulkarni et al. 2008). A thorough evaluation of the diversity at this locus and the associations between pairs of KIR genes are essential to our understanding of KIR biology in general and its influence on disease pathogenesis. Here, we consider the strengths and limitations of methods used for the estimation of gene frequency, haplotype frequency, and linkage disequilibrium (LD) based on gene content variation data at the KIR locus. Our analyses use both family-derived haplotypes from CEPH (see accompanying paper in this issue) and genotypic data from unrelated individuals within a number of world populations. The availability of a family-based dataset containing information on KIR gene content variation (CEPH data, see accompanying paper in this issue) allows us to obtain direct estimates of gene content, with respect to which estimates based on simple presence/absence information can be compared.
Gene frequencies, carrier frequencies, and Hardy-Weinberg proportions
Much of the recent KIR genotyping has used methods that detect the presence or absence of specific KIR genes. This leaves ambiguity due to the inability of most current KIR typing methods to distinguish between homozygotes and heterozygotes for a given locus. Gene frequency data is the standard data type for many population genetic and disease association analyses. Many KIR studies use estimated gene frequencies (GF), derived from carrier frequencies (CF), in their analyses and for comparisons among groups: . This transformation is based on the assumption of Hardy-Weinberg proportions (HWP) and is sometimes referred to as Bernstein's formula (Gourraud et al. 2005; Williams et al. 1986). Frequencies that differ from those expected under HWP may indicate processes of biological interest (selection, inbreeding), or provide information about methodological issues (heterogeneous populations, typing error, or genomic organization - see below). Analysis of HWP has been used to confirm allelic relationships for 2DL2 with 2DL3 as well as 3DL1 with 3DS1 (Gendzekhadze et al. 2006; Norman et al. 2002).
Application to CEPH data
Table 1 contains a comparison of gene frequencies estimated from carrier frequencies (and the assumption of HWP) with gene frequency results from segregation analysis in the CEPH samples. The former were estimated by applying Bernstein's formula to the carrier frequencies for the KIR genotypes from presence/absence data and the latter by gene counting based on the segregation analysis results in the CEPH families. The results in Table 1 show that estimating gene frequencies using Bernstein's formula is in general quite accurate for the CEPH samples.
Comparison of Gene Frequencies based on Carrier Freqs (assuming HWP) and Segregation Analysis in unrelated CEPH individuals
| locus | Carrier Frequency | Gene Frequency assuming HWP (a) | Gene Frequency by Segregation Analysis | difference | % difference |
|---|---|---|---|---|---|
| K3DL3 | 1.000 | 1.000 | 1.000 | 0.000 | 0.0% |
| K2DS2 | 0.607 | 0.373 | 0.354 | 0.019 | 5.4% |
| K2DL2 | 0.584 | 0.355 | 0.343 | 0.013 | 3.7% |
| K2DL3 | 0.888 | 0.665 | 0.640 | 0.024 | 3.8% |
| K2DL5B | 0.247 | 0.132 | 0.140 | -0.008 | -5.8% |
| K2DP1 | 0.966 | 0.816 | 0.781 | 0.036 | 4.5% |
| K2DL1 | 0.966 | 0.816 | 0.781 | 0.036 | 4.5% |
| K3DP1 | 1.000 | 1.000 | 0.994 | 0.006 | 0.6% |
| K2DL4 | 1.000 | 1.000 | 0.989 | 0.011 | 1.1% |
| K3DL1 | 0.944 | 0.763 | 0.770 | -0.007 | -0.9% |
| K3DS1 | 0.393 | 0.221 | 0.225 | -0.004 | -1.6% |
| K2DL5A | 0.371 | 0.207 | 0.213 | -0.007 | -3.1% |
| K2DS3 | 0.292 | 0.159 | 0.174 | -0.016 | -8.9% |
| K2DS5 | 0.303 | 0.165 | 0.163 | 0.002 | 1.5% |
| K2DS1 | 0.393 | 0.221 | 0.225 | -0.004 | -1.6% |
| K2DS4 | 0.944 | 0.763 | 0.775 | -0.012 | -1.6% |
| K3DL2 | 1.000 | 1.000 | 1.000 | 0.000 | 0.0% |
GF=1 - sqrt(1 - CF)
A comparison of gene frequencies (GF) estimated from carrier frequencies (CF), and the assumption of HWP, with gene frequency results from segregation analysis in the CEPH samples. Gene frequencies were estimated by gene counting based on the segregation analysis results and also by applying Bernstein's formula to the carrier frequencies for the KIR genotypes from presence/absence data.
The largest percentage difference is seen for 2DS3 (-9%), but a similar result is observed for 2DL5 (percentage difference -9.3%), if one does not distinguish between 2DL5A and 2DL5B, as was the case in earlier KIR studies (Gomez-Lozano et al. 2002). In most cases, 2DL5A maps telomeric and 2DL5B maps centromeric to the centrally located 2DL4 gene. When 2DL5A is present, 2DL5B is usually absent and vice versa, but there are haplotypes on which both genes are present. Similarly, the fact that 2DS3 may be present on either the centromeric side, telomeric side, or both sides of the 2DL4 gene, depending on the particular KIR haplotype (Martin et al. 2004), may explain the larger discrepancy between gene frequencies computed from segregation analysis results and those derived from carrier frequencies assuming HWP. In future studies, it will be of interest to assess the assumption of HWP based on known genotypes (e.g., through segregation analysis), as presented in this study, since this assumption is often used in computing gene frequencies, haplotype B frequencies, and measures of linkage disequilibrium. A better understanding of the tenability of the HWP assumption for KIR loci is particularly important for disease association studies, where researchers often use allelic odds ratios and chi-squared statistics. These statistics are known not to be robust to deviations from HWP in controls (Sasieni 1997). Thus, these statistics will be less accurate if the HWP assumption does not hold.
Haplotype frequencies and estimation
The expectation-maximization (EM) algorithm is an iterative procedure that uses unphased multi-locus genotype frequencies along with the assumption of HWP to converge on final haplotype frequencies (HF) estimates (Dempster et al. 1977; Excoffier and Slatkin 1995). Currently available programs for estimating HFs for KIR data (described below) use the EM algorithm and additionally require an a priori list of known/possible haplotypes as input. This differs from traditional implementations, in which the set of all possible haplotypic combinations is generated from the observed genotypic data and there are no restrictions on possible haplotype patterns. The list of user-designated a priori haplotypes is defined to “span” the set of observed genotypes in a study if each observed genotype can be generated from at least one pair of haplotypes in the a priori list. If pairs of haplotypes from the a priori list do not account for all of the observed genotypes in the sample (i.e., the a priori list does not span the observed genotypes), care must be taken in the interpretation of the resulting estimates.
Several recent papers describe methods and results for the estimation of HFs for KIR. Gourraud et al (2007) described a maximum likelihood estimation framework for KIR haplotype frequencies based on the expectation-maximization (EM) algorithm. Using data from over 40 Irish families, true and estimated KIR HFs were compared by performing a simulation study in which “true” family-based KIR haplotypes were combined probabilistically to generate simulated phase-unknown genotypes. The software allows the user to constrain the space of estimated haplotypes by providing a user-defined set of possible haplotypes (i.e. their original set of phase-known haplotypes derived by segregation analysis). They suggest that sample sizes of 500 or more individuals will provide an acceptable estimation accuracy. Measures of accuracy related to haplotype identification were particularly low for samples sizes under 200. Middleton et al (2007) reported genotype and HFs for 154 parents in 77 Northern Irish families based on 10 genes typed at the allele level and seven genes typed for presence/absence.
Yoo et al. (2007) developed an algorithm that can incorporate information about specific haplotype patterns and an a priori list of previously defined haplotypes, implemented in the HAPLO-IHP (Haplotype inference using identified haplotypes patterns) software in order to estimate haplotypes from phase-unknown data. In this approach, the algorithm first constructs a minimal set of haplotypes to resolve observed genotypes and then uses the EM algorithm to estimate HFs. A haplotype pattern file allows the user to require the presence of anchor genes, or specify an allelic relationship between specific KIR loci. When the a priori list of user-defined haplotypes does not span the observed genotypes, new haplotypes are “constructed” in an attempt to satisfy any user defined haplotypes patterns. The authors generated simulated data based on the haplotypes and frequencies reported in Middleton et al. (2005) and Hsu et al. (2002). As new haplotypes are identified and reported in the literature, their incorporation as input to the program will theoretically further improve accuracy and efficiency. The authors also acknowledge that a potential drawback of the constraints imposed by the use of predefined haplotype patterns is that rare or unusual haplotypes, which are not compatible with the constraints, may be incorrectly rejected. The simulations in these studies were carried out in such a way that the a priori list of haplotypes spans the set of observed genotypes. Below we discuss an example where this is not the case.
Application to the CEPH data
In another manuscript published in this same issue (Martin et al), we determined KIR HFs by segregation analysis using the parents and grandparents of 90 CEPH individuals. We also estimated HFs based on KIR profile data from each unrelated individual in the sample of CEPH families using two different methods in the corresponding set of 90 presence/absence genotypes. We used the haplotypes defined in Figure 1 of Khakoo and Carrington (2006) as our a priori list of haplotypes, along with an expanded list (the “plus three” list described below), to account for genotypes that were not observed in the initial list (i.e., not “spanned” by the initial list).
Accuracy of HF estimates was assessed using measures that compare the true HFs, hi, and the frequencies estimated by the EM algorithm, . The sum of the absolute deviations (SAD) was computed as . is a frequency-based similarity index that takes a value of one if the true and estimated frequencies of all haplotypes are equal. is a measure of haplotype identification, where ntrue represents the true number of different haplotypes present, nestimated is the number of distinct haplotypes identified in the estimation, and nmissed is the number of true haplotypes not identified in the estimation. It takes a value of one if the set of estimated haplotypes is identical to the set of true haplotypes in the sample. For the purposes of this statistic, a haplotype was considered to have been identified if the estimated HF implies that it is present in at least one chromosome in the sample (Excoffier and Slatkin 1995).
Two sets of HF estimates for the CEPH data are shown in Table 2. For both sets, we imposed the following constraints on haplotype estimation: 1) the “anchor” genes 3DL3 and 3DL2 are always present and 2) both 2DL2/2DL3 and 3DL1/3DS1 have allelic relationships. The allelic relationship, specified implicitly in the a priori haplotype list or explicitly in the haplotype pattern file for Haplo-IHP, requires that these genes do not occur together on the same haplotype. For the initial set of estimates, we used the list of haplotypes in Figure 1 of Khakoo and Carrington (2006) as the list of a priori haplotypes. For the second set of estimates, we expanded the a priori list to include three additional haplotypes identified in the CEPH by segregation analysis (we will refer to this as the “plus three” list), since the original list did not span the set of observed genotypes and this led to the spurious results described below.
Haplotype frequencies in unrelated CEPH individuals
| KIR Haplotype | Frequency | ||||||||||||||||||
|---|---|---|---|---|---|---|---|---|---|---|---|---|---|---|---|---|---|---|---|
| K3DL3 | K2DS2 | K2DL2 | K2DL3 | K2DL5B | K2DP1 | K2DL1 | K3DP1 | K2DL4 | K3DL1 | K3DS1 | K2DL5A | K2DS3 | K2DS5 | K2DS1 | K2DS4 | K3DL2 | segregation analysis | estimated using K&C list | estimated using “+3” list |
| 1 | 0 | 0 | 1 | 0 | 1 | 1 | 1 | 1 | 1 | 0 | 0 | 0 | 0 | 0 | 1 | 1 | 0.5222 | 0.4955 | 0.5063 |
| 1 | 1 | 1 | 0 | 0 | 0 | 0 | 1 | 1 | 1 | 0 | 0 | 0 | 0 | 0 | 1 | 1 | 0.1722 | 0.2031 | 0.2053 |
| 1 | 0 | 0 | 1 | 0 | 1 | 1 | 1 | 1 | 0 | 1 | 1 | 0 | 1 | 1 | 0 | 1 | 0.0722 | 0.0478 | 0.0339 |
| 1 | 1 | 1 | 0 | 1 | 1 | 1 | 1 | 1 | 1 | 0 | 0 | 1 | 0 | 0 | 1 | 1 | 0.0444 | 0.0526 | 0.0255 |
| 1 | 1 | 1 | 0 | 1 | 1 | 1 | 1 | 1 | 0 | 1 | 1 | 1 | 1 | 1 | 0 | 1 | 0.0389 | 0.0400 | 0.0464 |
| 1 | 1 | 1 | 0 | 0 | 0 | 0 | 1 | 1 | 0 | 1 | 1 | 0 | 1 | 1 | 0 | 1 | 0.0278 | 0.0001 | 0.0005 |
| 1 | 1 | 1 | 0 | 1 | 1 | 1 | 1 | 1 | 0 | 1 | 1 | 1 | 0 | 1 | 0 | 1 | 0.0222 | 0.0314 | 0.0161 |
| 1 | 0 | 0 | 1 | 0 | 1 | 1 | 1 | 1 | 0 | 1 | 1 | 1 | 0 | 1 | 0 | 1 | 0.0222 | 0.0090 | 0.0236 |
| 1 | 1 | 0 | 0 | 0 | 1 | 1 | 1 | 1 | 0 | 1 | 1 | 0 | 1 | 1 | 0 | 1 | 0.0111 | 0.0144 | |
| 1 | 0 | 0 | 1 | 0 | 1 | 1 | 1 | 1 | 1 | 0 | 1 | 1 | 0 | 0 | 1 | 1 | 0.0111 | ||
| 1 | 1 | 1 | 0 | 1 | 1 | 1 | 1 | 1 | 1 | 1 | 0 | 1 | 0 | 0 | 1 | 1 | 0.0056 | 0.0136 | |
| 1 | 1 | 1 | 0 | 1 | 1 | 1 | 1 | 1 | 0 | 1 | 0 | 1 | 0 | 1 | 0 | 1 | 0.0056 | ||
| 1 | 1 | 1 | 0 | 1 | 1 | 1 | 1 | 0 | 0 | 0 | 0 | 0 | 1 | 1 | 0 | 1 | 0.0056 | ||
| 1 | 1 | 1 | 0 | 1 | 0 | 0 | 1 | 1 | 1 | 0 | 0 | 1 | 0 | 0 | 1 | 1 | 0.0056 | ||
| 1 | 1 | 1 | 0 | 1 | 0 | 0 | 1 | 1 | 0 | 1 | 0 | 1 | 0 | 0 | 0 | 1 | 0.0056 | ||
| 1 | 1 | 1 | 0 | 0 | 1 | 1 | 1 | 1 | 1 | 0 | 0 | 0 | 0 | 0 | 1 | 1 | 0.0056 | 0.0002 | 0.0006 |
| 1 | 0 | 0 | 1 | 1 | 1 | 1 | 1 | 1 | 1 | 0 | 0 | 1 | 0 | 0 | 1 | 1 | 0.0056 | ||
| 1 | 0 | 0 | 1 | 0 | 1 | 1 | 1 | 1 | 0 | 1 | 1 | 1 | 1 | 1 | 0 | 1 | 0.0056 | ||
| 1 | 0 | 0 | 1 | 0 | 1 | 1 | 1 | 1 | 0 | 1 | 0 | 0 | 0 | 1 | 0 | 1 | 0.0056 | ||
| 1 | 0 | 0 | 0 | 0 | 0 | 0 | 0 | 0 | 0 | 0 | 0 | 0 | 0 | 1 | 0 | 1 | 0.0056 | 0.0063 | |
| 1 | 1 | 1 | 0 | 1 | 1 | 1 | 1 | 1 | 0 | 0 | 0 | 0 | 1 | 1 | 0 | 1 | 0.0000 | 0.0072 | |
| 1 | 1 | 1 | 0 | 1 | 1 | 0 | 1 | 1 | 0 | 1 | 1 | 1 | 0 | 1 | 0 | 1 | 0.0027 | 0.0111 | |
| 1 | 1 | 1 | 0 | 0 | 1 | 1 | 1 | 1 | 1 | 0 | 1 | 0 | 0 | 0 | 1 | 1 | 0.0068 | ||
| 1 | 1 | 0 | 1 | 1 | 1 | 1 | 1 | 1 | 1 | 0 | 0 | 1 | 0 | 0 | 1 | 1 | 0.0068 | ||
| 1 | 0 | 0 | 1 | 1 | 1 | 1 | 1 | 1 | 0 | 1 | 0 | 1 | 0 | 1 | 0 | 1 | 0.0077 | 0.0074 | |
| 1 | 0 | 0 | 1 | 0 | 1 | 1 | 1 | 1 | 1 | 0 | 1 | 1 | 0 | 1 | 0 | 1 | 0.0063 | 0.0056 | |
| 1 | 0 | 0 | 1 | 0 | 1 | 1 | 1 | 1 | 0 | 1 | 1 | 0 | 1 | 1 | 1 | 1 | 0.0365 | 0.0553 | |
| 1 | 0 | 0 | 0 | 1 | 1 | 0 | 1 | 1 | 1 | 0 | 0 | 1 | 0 | 0 | 1 | 1 | 0.0069 | 0.0075 | |
| Other (61 different “constructed” haplotypes) | 0.0600 | ||||||||||||||||||
(a) Frequencies based on haplotypes from segregation analysis
(b) Frequencies estimated using Figure 1 of Khakoo & Carrington (2006) as the a priori list
(c) Freqencies estimated using the Khakoo & Carrington (2006) list and three additional CEPH haplotypes identified in the segregation analysis.
In the initial set of HF estimates, where the a priori list of haplotypes did not span the set of observed genotypes, estimates were generated for an additional set of 61 haplotypes created by the Haplo-IHP program that were not present in the a priori list. The total sum of the frequencies for these spurious haplotypes was 0.06, which corresponds to approximately 11 haplotypes. Therefore, we updated the a priori list of haplotypes so that it spanned the set of genotypes for the second set of results.
In the second set of HF estimates there were no additional spurious haplotypes created by the program since the “plus three” list spans the set of observed genotypes. In this revised set of HF estimates, twelve of the 20 true haplotypes were estimated, with a maximum difference in frequency of 0.038. Eight true haplotypes were not estimated to exist (maximum difference in frequency of 0.011) and six haplotypes from the Khakoo and Carrington list were estimated but were not actually present in the dataset (maximum difference in frequency of 0.055). The If measure of accuracy of frequency estimation was 0.838, indicating that the more common haplotypes were estimated relatively well. The sum of absolute deviations (SAD) was 0.323 and the Ih measure was 0.526. The low value for the Ih measure reflects the fact that a large number of low frequency haplotypes were either missed or estimated but not actually present in the sample.
Twenty three of the 30 global populations from Single et al. (2007) included individuals with presence/absence genotype profiles that could not be constructed using pairs of haplotypes from the Khakoo and Carrington (2006) list of well documented KIR haplotypes (i.e., these populations contained individuals with “new” haplotypes). There are 11 populations where more than five percent of individuals fit this description, including each of the African populations (Table 3). This percentage is substantially higher than five percent in several populations and more than 10% in four of the six African populations. This pattern is expected given that Africans have lower LD, carry more haplotypes, and have been studied less than Europeans for KIR. It is important to take these findings into account when using estimated HFs in downstream analyses, in particular those involving populations whose haplotypes have been less well documented (e.g. Africans), since this could lead to unreliable results.
Genotypes that could not be constructed based on haplotypes listed in Khakoo & Carrington (2006)
| population | no. with “new” haplotypes (a) | sample size | % with “new” haplotypes (a) |
|---|---|---|---|
| Biaka | 26 | 60 | 43.3% * |
| Ethiopian | 3 | 27 | 11.1% * |
| Hausa | 1 | 18 | 5.6% * |
| Ibo | 9 | 41 | 22.0% * |
| Mbuti | 13 | 32 | 40.6% * |
| Yoruba | 5 | 59 | 8.5% * |
| Adygei | 1 | 53 | 1.9% |
| CEPH-UT | 3 | 89 | 3.4% |
| Danish | 0 | 49 | 0.0% |
| European | 3 | 88 | 3.4% |
| Finns | 1 | 30 | 3.3% |
| Irish | 5 | 89 | 5.6% * |
| Russian | 1 | 43 | 2.3% |
| Druze | 3 | 105 | 2.9% |
| Yemenites | 0 | 41 | 0.0% |
| Ami | 2 | 39 | 5.1% * |
| Atayl | 0 | 40 | 0.0% |
| Cambodian | 0 | 18 | 0.0% |
| Hakka | 0 | 34 | 0.0% |
| Han-SF | 1 | 56 | 1.8% |
| Taiwan | 0 | 40 | 0.0% |
| Japan | 1 | 46 | 2.2% |
| Micronesia | 1 | 22 | 4.5% |
| Nasioi | 2 | 20 | 10.0% * |
| Yakut | 1 | 50 | 2.0% |
| Maya | 1 | 48 | 2.1% |
| Pima | 5 | 95 | 5.3% * |
| Karitiana | 0 | 54 | 0.0% |
| Surui | 1 | 44 | 2.3% |
| Ticuna | 4 | 50 | 8.0% * |
frequency greater than 5%.
Linkage disequilibrium and measures of association for KIR data
The study of LD in the human genome has experienced a surge of interest in the last decades, due to the feasibility of large scale SNP-based studies for gene mapping and evolutionary history. Patterns of LD in a given population are determined by mutation, recombination, natural selection, and the demographic history of the population. Natural selection, through a potential selective advantage due to combinations of alleles on the same haplotype, is one evolutionary process that is expected to increase the magnitude of LD (Garrigan and Hedrick 2003). However, non-selective processes, such as drift and population bottlenecks, can also generate LD. For example, several SNP-based studies have reported higher LD in populations that have smaller effective population sizes (e.g., Tishkoff and Kidd 2004 ). It is also likely that both selective and non-selective forces shape patterns of LD, as has been seen for HLA (Meyer et al. 2006). Yawata et al. (2006) showed that KIR LD patterns in Japanese were evidence of a selective sweep which may be responsible for driving a specific group A haplotype to high frequency. The abovementioned studies use various methods to estimate the significance and strength of LD. The manner in which these statistics are estimated depends on the type of data available. Below we discuss methods for the analysis of LD in KIR gene content data.
There are several measures of LD that can be used in genetic studies, each with its strengths and weaknesses (Mueller 2004; Slatkin 2008; Weiss and Clark 2002). D′ and the square root of the r2 measure (a.k.a. Cramer's V, or Wn in the HLA literature, for the multi-allelic extension) are among the most commonly used for allele-level genotype data. Both of these measures have a counterpart for presence/absence genotype data which we will refer to as D′* and Wn*. The D′* statistic (Mattiuz et al. 1971), defined below, is most often cited in KIR studies of presence/absence data. Comparisons of the degree of LD across different studies are complicated by the fact that the association measures are not independent of marginal (allele) frequencies and some studies have differed in their use of gene frequencies versus carrier frequencies in the normalization of the D′* statistic.
LD Measures for KIR data where haplotypes are known or inferred
The LD measures defined below are based on an implicit assumption that haplotypes are known. They are widely used with unphased genotypic data after haplotypes have been inferred by statistical methods, such as the EM algorithm (Slatkin 2008). Lewontin's (1964) normalized measure, D′ij = Dij/Dmax, can be used to quantify the deviation from random association for alleles Ai and Bj at two loci, where Dij = hij - piqj , pi and qj are the allele frequencies at each locus, and hij is the frequency of the haplotype AiBj . For KIR gene content data, Ai and Bj take values of either 0 or 1 to represent the presence or absence of the gene. Another common measure of LD for data where haplotypes are known or inferred is the correlation measure or Cramer's V statistic (Cramer 1946). Cramer's V statistic (also known as Wn in some HLA literature) is a measure of association derived from the contingency table, which summarizes the relationship between two loci. For two bi-allelic loci, it is equivalent to the correlation coefficient , and has a range from -1 to +1, depending on the direction of the association. Both of these measures have extensions for multi-allelic data (Hedrick 1987) which can be used for allele-level data.
The significance of overall LD between two loci can be tested using the permutation distribution of the likelihood-ratio statistic (Slatkin and Excoffier 1996) and also using Fisher's exact test on the contingency table summarizing the relationship between two loci across KIR haplotypes.
In the context of KIR studies for presence/absence data, the above methods require the use of the carrier frequencies to estimate the gene frequencies (i.e., the frequency with which gene copies are present or absent), followed by the estimation of haplotypes. Thus, there are two sources of estimation error for LD measures based on this approach.
Association measures for gene content KIR data
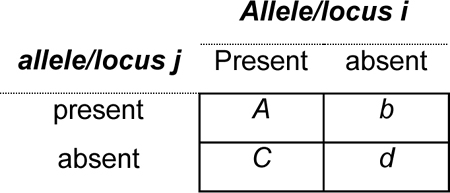
A large number of KIR studies have used an alternative approach for estimating LD, based on the direct quantification of the association of presence/absence information at two loci summarized in the contingency table of gene content data below for N=a+b+c+d. In this setting, the strength of the association between two KIR genes is often measured using an estimate of the D′ statistic (Mattiuz et al. 1971) based on the presence/absence table, which we will call D′*. The D′* statistic is computed as above, but in this case the individual LD coefficients are estimated from the presence/absence table as follows: , where (see Mattiuz et al. 1971; or Schipper et al. 1998). Cramer's V statistic can also be computed from the contingency table of presence/absence counts and we will refer to this statistic as Fisher's exact test can also be used to test for non-random association between the presence/absence of pairs of genes across KIR genotypes.
Application to the CEPH data and global populations
We compared the D′* and Wn* with the corresponding D′ and Wn values in the CEPH data in order to asses the correlations among these measures. Table 4 lists the correlation among different measures of LD and association between loci in the CEPH. The LD statistics, D′ and Wn, computed from the known haplotypes have a correlation of 0.91 across 78 pairs of KIR loci in the CEPH. The correlation between D′ and the corresponding value computed from the presence/absence genotype data, D′*, was 0.586. The correlation between the LD statistic Wn for the haplotype data and Cramer's V for the presence/absence genotype data, Wn*, was 0.722. The better fit of the Wn* measure, based on presence/absence data, to its phase known frequency counterpart (Wn) led us to choose to report results below for the Wn* measure computed for the 30 populations from Single et al. (2007).
Correlations among LD statistics in unrelated CEPH individuals
| D' | Wn | D' * | Wn* | |
|---|---|---|---|---|
| D' | 1.000 | |||
| Wn | 0.919 | 1.000 | ||
| D' * | 0.586 | 0.480 | 1.000 | |
| Wn* | 0.643 | 0.722 | 0.395 | 1.000 |
Wn The Wn statistic computed directly from the known haplotype frequencies, which is equivalent to Cramer's V computed on the 2×2 table for the haplotype data.
D' The D' statistic computed directly from the known haplotype frequencies.
Wn* Cramer's V computed on the 2×2 table created from the genotype (presence/absence) data.
D' * Dprime computed on the 2×2 table created from the genotype (presence/absence) data.
The absolute value of Cramer's V was used to reflect the (0, 1) range for the D' statistics.
Measures of the strength and significance of the association between different KIR loci in the 30 populations from Single et al. (2007) are summarized in Table 5. The upper triangle of the table lists the average value for Wn* in each geographic region and the lower triangle lists the proportion of populations in each region with a significant association based on Fisher's exact test. For any locus pair, the overall pattern of LD across geographic regions can be complex. A well documented result for the distribution of LD is that populations which are more distant from E. Africa (the likely origin of the dispersal of modern humans) show progressively higher levels of LD, a result consistent with the effect of genetic drift in generating LD in populations which have gone through a series of bottlenecks (e.g., Tishkoff and Kidd 2004 ). Certain pairs of inhibitory KIR loci described below show a similar pattern of association.
Linkage Disequilibrium Analysis of KIR Genes in CEPH
| 2DS2 | 2DL2 | 2DL3 | 2DL5B | 2DP1 | 2DL1 | 3DL1 | 3DS1 | 2DL5A | 2DS3 | 2DS5 | 2DS1 | 2DS4 | ||
|---|---|---|---|---|---|---|---|---|---|---|---|---|---|---|
| 2DS2 | AFR | 0.96 | -0.36 | 0.33 | -0.16 | -0.17 | -0.13 | 0.09 | -0.13 | 0.45 | 0.26 | 0.18 | -0.16 | |
| EUR | 0.99 | -0.29 | 0.66 | -0.17 | -0.17 | -0.02 | 0.16 | -0.33 | 0.56 | 0.08 | 0.14 | -0.02 | ||
| SWA | 0.95 | -0.28 | 0.67 | -0.14 | -0.14 | -0.14 | 0.19 | -0.30 | 0.52 | 0.18 | 0.18 | -0.15 | ||
| EAS | 0.99 | -0.40 | 0.38 | -0.31 | -0.31 | -0.06 | 0.23 | -0.27 | 0.30 | 0.20 | 0.18 | -0.06 | ||
| OCE | 0.85 | -0.23 | 0.20 | -0.15 | -0.15 | -0.07 | 0.04 | -0.21 | 0.25 | 0.06 | 0.07 | -0.07 | ||
| NEA | 0.80 | -0.38 | 0.72 | -0.05 | -0.18 | -0.05 | 0.21 | -0.39 | 0.58 | 0.26 | 0.31 | -0.05 | ||
| NAM | 1.00 | -0.30 | 0.42 | -0.30 | -0.30 | -0.34 | 0.12 | -0.29 | 0.18 | 0.25 | 0.25 | -0.34 | ||
| SAM | 1.00 | -0.29 | 0.85 | -0.29 | -0.29 | -0.26 | 0.11 | -0.68 | 0.03 | 0.38 | 0.44 | -0.26 | ||
| 2DL2 | AFR | 6/6 | -0.38 | 0.45 | -0.16 | -0.17 | -0.12 | 0.07 | -0.24 | 0.46 | 0.30 | 0.15 | -0.15 | |
| EUR | 7/7 | -0.30 | 0.67 | -0.17 | -0.17 | -0.01 | 0.15 | -0.34 | 0.55 | 0.07 | 0.13 | 0.00 | ||
| SWA | 2/2 | -0.29 | 0.77 | -0.14 | -0.14 | -0.14 | 0.18 | -0.33 | 0.44 | 0.22 | 0.22 | -0.15 | ||
| EAS | 6/6 | -0.39 | 0.52 | -0.30 | -0.30 | -0.06 | 0.23 | -0.50 | 0.30 | 0.22 | 0.19 | -0.06 | ||
| OCE | 1/2 | -0.19 | 0.22 | -0.13 | -0.13 | -0.19 | 0.07 | -0.17 | 0.26 | 0.20 | 0.09 | -0.19 | ||
| NEA | 1/1 | -0.31 | 0.33 | -0.10 | -0.23 | -0.10 | 0.19 | -0.09 | 0.21 | 0.25 | 0.32 | -0.10 | ||
| NAM | 2/2 | -0.30 | 0.42 | -0.30 | -0.30 | -0.34 | 0.12 | -0.29 | 0.18 | 0.25 | 0.25 | -0.34 | ||
| SAM | 3/3 | -0.29 | 0.85 | -0.29 | -0.29 | -0.26 | 0.11 | -0.68 | 0.03 | 0.38 | 0.44 | -0.26 | ||
| 2DL3 | AFR | 4/6 | 4/6 | -0.21 | 0.39 | 0.36 | 0.18 | -0.12 | 0.10 | -0.31 | -0.17 | -0.15 | 0.16 | |
| EUR | 4/7 | 4/7 | -0.25 | 0.55 | 0.55 | 0.11 | -0.13 | 0.16 | -0.29 | -0.13 | -0.13 | 0.10 | ||
| SWA | 1/2 | 1/2 | -0.04 | 0.53 | 0.53 | 0.17 | -0.07 | 0.02 | -0.24 | -0.03 | -0.01 | 0.17 | ||
| EAS | 1/4 | 1/4 | -0.45 | 0.68 | 0.68 | -0.05 | -0.04 | 0.45 | -0.25 | -0.05 | -0.01 | -0.05 | ||
| OCE | 0/2 | 0/2 | -0.30 | 0.69 | 0.69 | 0.62 | -0.03 | -0.06 | -0.03 | -0.11 | -0.04 | 0.62 | ||
| NEA | 1/1 | 0/1 | -0.53 | 0.32 | 0.48 | -0.06 | 0.10 | 0.70 | -0.38 | -0.18 | -0.17 | -0.06 | ||
| NAM | 2/2 | 2/2 | -0.17 | 1.00 | 1.00 | 0.30 | -0.11 | 0.11 | 0.04 | -0.20 | -0.17 | 0.30 | ||
| SAM | 2/3 | 2/3 | -0.24 | 1.00 | 1.00 | 0.34 | -0.04 | 0.28 | 0.08 | -0.11 | -0.15 | 0.34 | ||
| 2DL5B | AFR | 1/4 | 1/4 | 0/4 | -0.06 | -0.10 | -0.06 | -0.64 | -0.68 | 0.36 | -0.30 | -0.53 | -0.11 | |
| EUR | 7/7 | 7/7 | 2/6 | 0.09 | 0.09 | 0.04 | -0.40 | -0.45 | 0.79 | -0.44 | -0.39 | 0.05 | ||
| SWA | 2/2 | 2/2 | 1/2 | - | - | -0.19 | -0.22 | -0.44 | 0.56 | 0.03 | 0.06 | -0.19 | ||
| EAS | 1/5 | 1/4 | 0/3 | 0.33 | 0.33 | 0.12 | -0.65 | -0.81 | 0.46 | -0.22 | -0.72 | 0.12 | ||
| OCE | 0/2 | 0/2 | 0/1 | -0.11 | -0.11 | -0.30 | -0.32 | -0.32 | 0.61 | -0.05 | 0.03 | -0.30 | ||
| NEA | 1/1 | 0/1 | 1/1 | -0.25 | -0.25 | -0.06 | -0.53 | -0.53 | 0.83 | -0.45 | -0.36 | -0.06 | ||
| NAM | 2/2 | 2/2 | 0/2 | -0.17 | -0.17 | -0.28 | -0.57 | -0.68 | 0.37 | -0.37 | -0.12 | -0.28 | ||
| SAM | 2/2 | 2/2 | 0/2 | -0.24 | -0.24 | -0.08 | -0.79 | -0.83 | 0.19 | - | - | -0.08 | ||
| 2DP1 | AFR | 0/4 | 0/4 | 2/4 | 0/1 | 0.95 | 0.32 | 0.08 | 0.09 | 0.15 | 0.14 | 0.03 | 0.16 | |
| EUR | 0/5 | 0/5 | 4/5 | 0/5 | 1.00 | -0.03 | -0.04 | 0.06 | 0.10 | -0.16 | -0.10 | -0.03 | ||
| SWA | 0/2 | 0/2 | 2/2 | 0/0 | 1.00 | -0.03 | 0.07 | - | 0.14 | 0.10 | 0.11 | -0.03 | ||
| EAS | 0/3 | 0/3 | 2/3 | 0/1 | 1.00 | -0.05 | 0.04 | -0.15 | 0.14 | 0.02 | 0.04 | -0.05 | ||
| OCE | 0/2 | 0/2 | 1/2 | 0/1 | 1.00 | 0.53 | 0.17 | 0.16 | 0.03 | -0.16 | 0.04 | 0.53 | ||
| NEA | 0/1 | 0/1 | 0/1 | 0/1 | 0.70 | -0.04 | 0.17 | 0.47 | 0.11 | -0.02 | -0.02 | -0.04 | ||
| NAM | 2/2 | 2/2 | 2/2 | 0/2 | 1.00 | 0.30 | -0.11 | 0.11 | 0.04 | -0.20 | -0.16 | 0.30 | ||
| SAM | 2/3 | 2/3 | 3/3 | 0/2 | 1.00 | 0.34 | -0.04 | 0.28 | 0.08 | -0.11 | -0.15 | 0.34 | ||
| 2DL1 | AFR | 0/4 | 0/4 | 2/4 | 0/2 | 4/4 | 0.32 | 0.09 | 0.13 | 0.17 | 0.09 | 0.04 | 0.15 | |
| EUR | 0/5 | 0/5 | 4/5 | 0/5 | 5/5 | -0.03 | -0.03 | 0.06 | 0.10 | -0.16 | -0.10 | -0.03 | ||
| SWA | 0/2 | 0/2 | 2/2 | 0/0 | 2/2 | -0.03 | 0.07 | - | 0.14 | 0.10 | 0.11 | -0.03 | ||
| EAS | 0/3 | 0/3 | 2/3 | 0/1 | 3/3 | -0.05 | 0.04 | -0.15 | 0.14 | 0.02 | 0.04 | -0.05 | ||
| OCE | 0/2 | 0/2 | 1/2 | 0/1 | 2/2 | 0.53 | 0.17 | 0.16 | 0.03 | -0.16 | 0.04 | 0.53 | ||
| NEA | 0/1 | 0/1 | 0/1 | 0/1 | 1/1 | -0.03 | 0.12 | 0.47 | 0.07 | -0.16 | -0.15 | -0.03 | ||
| NAM | 2/2 | 2/2 | 2/2 | 0/2 | 2/2 | 0.30 | -0.11 | 0.11 | 0.04 | -0.20 | -0.16 | 0.30 | ||
| SAM | 2/3 | 2/3 | 3/3 | 0/2 | 3/3 | 0.34 | -0.04 | 0.28 | 0.08 | -0.11 | -0.15 | 0.34 | ||
| 3DL1 | AFR | 0/3 | 0/3 | 0/3 | 0/1 | 0/2 | 0/2 | -0.20 | 0.09 | 0.10 | -0.20 | -0.29 | 0.85 | |
| EUR | 0/7 | 0/7 | 0/7 | 1/7 | 0/5 | 0/5 | -0.27 | -0.21 | -0.18 | -0.30 | -0.25 | 1.00 | ||
| SWA | 0/2 | 0/2 | 1/2 | 0/2 | 0/2 | 0/2 | -0.25 | -0.18 | -0.23 | -0.25 | -0.29 | 1.00 | ||
| EAS | 0/5 | 0/5 | 0/3 | 0/4 | 0/2 | 0/2 | -0.20 | -0.09 | -0.26 | -0.24 | -0.21 | 1.00 | ||
| OCE | 0/2 | 0/2 | 1/2 | 0/1 | 1/2 | 1/2 | -0.23 | -0.28 | -0.03 | -0.21 | -0.04 | 1.00 | ||
| NEA | 0/1 | 0/1 | 0/1 | 0/1 | 0/1 | 0/1 | -0.24 | -0.13 | -0.14 | -0.23 | -0.22 | 1.00 | ||
| NAM | 2/2 | 2/2 | 1/2 | 0/2 | 1/2 | 1/2 | -0.20 | 0.06 | 0.04 | -0.25 | -0.25 | 1.00 | ||
| SAM | 2/3 | 2/3 | 1/3 | 0/2 | 1/3 | 1/3 | -0.27 | -0.20 | -0.07 | -0.26 | -0.25 | 1.00 | ||
| 3DS1 | AFR | 0/6 | 0/6 | 1/6 | 2/4 | 0/4 | 0/4 | 0/3 | 0.95 | 0.16 | 0.39 | 0.68 | -0.18 | |
| EUR | 1/7 | 1/7 | 1/7 | 6/7 | 0/5 | 0/5 | 3/7 | 0.94 | 0.30 | 0.82 | 0.92 | -0.27 | ||
| SWA | 0/2 | 0/2 | 0/2 | 1/2 | 0/2 | 0/2 | 1/2 | 0.70 | 0.46 | 0.70 | 0.76 | -0.27 | ||
| EAS | 1/6 | 1/6 | 0/4 | 0/4 | 0/3 | 0/3 | 0/5 | 0.80 | 0.55 | 0.80 | 0.94 | -0.20 | ||
| OCE | 0/2 | 0/2 | 0/2 | 0/2 | 0/2 | 0/2 | 0/2 | 1.00 | 0.09 | 0.49 | 0.52 | -0.23 | ||
| NEA | 0/1 | 0/1 | 0/1 | 1/1 | 0/1 | 0/1 | 0/1 | 1.00 | 0.28 | 0.88 | 0.92 | -0.24 | ||
| NAM | 0/2 | 0/2 | 0/2 | 2/2 | 0/2 | 0/2 | 1/2 | 0.85 | 0.13 | 0.83 | 0.88 | -0.20 | ||
| SAM | 1/3 | 1/3 | 0/3 | 2/2 | 0/3 | 0/3 | 1/3 | 0.95 | 0.19 | 0.82 | 0.78 | -0.27 | ||
| 2DL5A | AFR | 0/5 | 1/5 | 0/5 | 3/4 | 0/1 | 0/2 | 0/1 | 5/5 | -0.07 | 0.30 | 0.72 | 0.16 | |
| EUR | 2/7 | 2/7 | 0/6 | 6/7 | 0/5 | 0/5 | 1/7 | 6/7 | -0.30 | 0.72 | 0.92 | -0.21 | ||
| SWA | 1/2 | 1/2 | 0/2 | 1/2 | 0/0 | 0/0 | 1/2 | 1/2 | -0.11 | 0.39 | 0.45 | -0.20 | ||
| EAS | 1/4 | 1/3 | 0/3 | 2/4 | 0/1 | 0/1 | 0/3 | 1/4 | -0.26 | 0.48 | 0.94 | -0.09 | ||
| OCE | 0/2 | 0/2 | 0/2 | 0/2 | 0/2 | 0/2 | 0/2 | 2/2 | -0.09 | 0.37 | 0.47 | -0.28 | ||
| NEA | 0/1 | 0/1 | 1/1 | 1/1 | 0/1 | 0/1 | 0/1 | 1/1 | -0.31 | 0.51 | 0.68 | -0.13 | ||
| NAM | 0/2 | 0/2 | 0/2 | 2/2 | 0/2 | 0/2 | 0/2 | 2/2 | 0.06 | -0.06 | 0.21 | 0.06 | ||
| SAM | 2/2 | 2/2 | 0/2 | 2/2 | 0/2 | 0/2 | 0/2 | 2/2 | 0.19 | - | - | -0.20 | ||
| 2DS3 | AFR | 4/6 | 4/6 | 1/6 | 0/4 | 0/4 | 0/4 | 0/3 | 0/6 | 0/5 | -0.14 | 0.12 | 0.13 | |
| EUR | 7/7 | 7/7 | 4/7 | 5/7 | 0/5 | 0/5 | 1/7 | 3/7 | 4/7 | 0.11 | 0.27 | -0.17 | ||
| SWA | 2/2 | 2/2 | 1/2 | 2/2 | 0/2 | 0/2 | 0/2 | 2/2 | 1/2 | 0.24 | 0.28 | -0.24 | ||
| EAS | 3/6 | 3/6 | 1/4 | 1/5 | 0/3 | 0/3 | 0/5 | 7/7 | 0/4 | 0.08 | 0.47 | -0.26 | ||
| OCE | 1/2 | 1/2 | 0/2 | 0/2 | 0/2 | 0/2 | 0/2 | 0/2 | 0/2 | -0.15 | 0.17 | -0.03 | ||
| NEA | 1/1 | 0/1 | 1/1 | 1/1 | 0/1 | 0/1 | 0/1 | 0/1 | 0/1 | 0.26 | 0.34 | -0.14 | ||
| NAM | 0/1 | 0/1 | 0/1 | 0/1 | 0/1 | 0/1 | 0/1 | 0/1 | 0/1 | -0.17 | 0.11 | 0.04 | ||
| SAM | 0/2 | 0/2 | 0/2 | 0/1 | 0/2 | 0/2 | 0/2 | 0/2 | 0/1 | 0.16 | 0.16 | -0.07 | ||
| 2DS5 | AFR | 1/6 | 2/6 | 1/6 | 0/4 | 0/4 | 0/4 | 0/3 | 3/6 | 1/5 | 0/6 | 0.49 | -0.23 | |
| EUR | 0/7 | 0/7 | 0/7 | 4/7 | 1/5 | 1/5 | 3/7 | 7/7 | 6/7 | 2/7 | 0.84 | -0.30 | ||
| SWA | 0/2 | 1/2 | 1/2 | 0/2 | 0/2 | 0/2 | 1/2 | 2/2 | 1/2 | 1/2 | 0.93 | -0.28 | ||
| EAS | 1/6 | 1/6 | 0/4 | 1/5 | 0/3 | 0/3 | 0/5 | 6/6 | 2/4 | 1/6 | 0.84 | -0.24 | ||
| OCE | 0/2 | 0/2 | 0/2 | 0/2 | 0/2 | 0/2 | 0/2 | 1/2 | 0/2 | 0/2 | 0.46 | -0.21 | ||
| NEA | 0/1 | 0/1 | 0/1 | 0/1 | 0/1 | 0/1 | 0/1 | 1/1 | 0/1 | 0/1 | 0.96 | -0.23 | ||
| NAM | 1/2 | 1/2 | 0/2 | 0/1 | 0/2 | 0/2 | 1/2 | 2/2 | 0/1 | 0/1 | 0.95 | -0.25 | ||
| SAM | 2/3 | 2/3 | 0/3 | 0/0 | 0/3 | 0/3 | 1/3 | 3/3 | 0/0 | 0/2 | 0.96 | -0.26 | ||
| 2DS1 | AFR | 1/6 | 1/6 | 1/6 | 1/4 | 0/4 | 0/4 | 0/3 | 4/6 | 3/4 | 0/6 | 4/6 | -0.28 | |
| EUR | 0/7 | 0/7 | 0/7 | 6/7 | 0/5 | 0/5 | 2/7 | 7/7 | 6/7 | 2/7 | 7/7 | -0.25 | ||
| SWA | 0/2 | 1/2 | 0/2 | 0/2 | 0/2 | 0/2 | 1/2 | 2/2 | 1/2 | 1/2 | 2/2 | -0.31 | ||
| EAS | 1/6 | 1/6 | 0/4 | 2/3 | 0/3 | 0/3 | 0/5 | 7/7 | 3/3 | 4/7 | 6/6 | -0.21 | ||
| OCE | 0/2 | 0/2 | 0/2 | 0/2 | 0/2 | 0/2 | 0/2 | 1/2 | 1/2 | 1/2 | 1/2 | -0.04 | ||
| NEA | 1/1 | 1/1 | 0/1 | 0/1 | 0/1 | 0/1 | 0/1 | 1/1 | 1/1 | 1/1 | 1/1 | -0.22 | ||
| NAM | 1/2 | 1/2 | 0/2 | 0/1 | 0/2 | 0/2 | 1/2 | 2/2 | 0/1 | 0/1 | 2/2 | -0.25 | ||
| SAM | 3/3 | 3/3 | 0/3 | 0/0 | 0/3 | 0/3 | 1/3 | 3/3 | 0/0 | 0/2 | 3/3 | -0.25 | ||
| 2DS4 | AFR | 0/3 | 0/3 | 0/3 | 0/1 | 0/2 | 0/2 | 2/3 | 0/3 | 0/1 | 0/3 | 0/3 | 0/3 | |
| EUR | 0/7 | 0/7 | 0/7 | 1/7 | 0/5 | 0/5 | 7/7 | 3/7 | 1/7 | 1/7 | 3/7 | 2/7 | ||
| SWA | 0/2 | 0/2 | 1/2 | 0/2 | 0/2 | 0/2 | 2/2 | 1/2 | 1/2 | 0/2 | 1/2 | 1/2 | ||
| EAS | 0/5 | 0/5 | 0/3 | 0/4 | 0/2 | 0/2 | 5/5 | 0/5 | 0/3 | 0/5 | 0/5 | 0/5 | ||
| OCE | 0/2 | 0/2 | 1/2 | 0/1 | 1/2 | 1/2 | 2/2 | 0/2 | 0/2 | 0/2 | 0/2 | 0/2 | ||
| NEA | 0/1 | 0/1 | 0/1 | 0/1 | 0/1 | 0/1 | 1/1 | 0/1 | 0/1 | 0/1 | 0/1 | 0/1 | ||
| NAM | 2/2 | 2/2 | 1/2 | 0/2 | 1/2 | 1/2 | 2/2 | 1/2 | 0/2 | 0/1 | 1/2 | 1/2 | ||
| SAM | 2/3 | 2/3 | 1/3 | 0/2 | 1/3 | 1/3 | 3/3 | 1/3 | 0/2 | 0/2 | 1/3 | 1/3 | ||
The majority of locus pairs show little to no regional trend in the associations. Of these locus pairs, five adjacent loci have high association across all regions (2DS2:2DL2, 2DP1:2DL1, 3DL1:2DS4, 3DS1:2DL5A, and 2DS1:2DS5) as evidenced by measures of both the strength and significance of the associations. This high association across all regions is seen to a lesser extent for 3DS1:2DS1 and 3DS1:2DS5 (loci separated by additional KIR genes) with the exception of three African populations having notably low association for these locus pairs (Biaka, Hausa, and Mbuti). These seven high-LD locus pairs fall in either of the two SNP-defined high-LD blocks identified by Norman et al. (2004) and also agree with the general decay of LD with physical distance.
A trend of increasing strength of positive association with geographic distance from E. Africa, similar to that seen in several SNP-based studies, was seen for 2DL3:2DP1 and 2DL3:2DL1. Weaker trends in this direction were seen for 2DP1:3DL1 and 2DL1:3DL1 (pairs with loci on either side of 2DL4). However, a particularly high value of Wn* for the Mbuti, in comparison to very low values for each of the other African populations, somewhat obscures this overall pattern for these two locus pairs in Table 5. The opposite trend (decreasing positive values with increasing distance from E. Africa) was seen for 2DS3 paired with both 2DS2 and 2DL2. The strong LD between 2DS2 and 2DL2 makes it difficult to determine which locus pair might be driving this trend, but it is interesting to note that one of these two locus pairs involves two activating KIR.
Increasing strength of negative association with geographic distance from E. Africa was not consistent across all regions for any locus pair. However, stronger negative association in populations from the Americas was evident for several locus pairs (2DS2:2DS4, 2DL2:2DP1, 2DL2:2DL1, 2DL2:3DL1, 2DL2:2DS4).
The study of neutral markers has repeatedly shown that linkage disequilibrium is higher within non-African populations, and lower among Africans. This pattern is a consequence of the different demographic histories of these populations, with the recent bottlenecks associated to the occupation of Asia, Europe and the Americas resulting in increased LD. For the KIR data an increasing association between locus pairs with increasing geographic distance from E. Africa was only seen for locus pairs in which both KIR were inhibitory. Thus, the associations between pairs of inhibitory KIR may have retained this signature of demographic history which has been lost for pairs involving activating KIR. Interestingly, the carrier frequencies of certain activating KIR and not of inhibitory KIR showed strong geographic trends, with higher frequencies corresponding with greater distance from E. Africa.
Testing for natural selection on KIR loci
The evolution of KIR diversity has been hypothesized to result from natural selection favoring specific combinations of receptors and ligands. Rapid evolution of the KIR complex has been demonstrated through sequence comparisons across primate species (Abi-Rached and Parham 2005; Hao and Nei 2005; Khakoo et al. 2000). Natural selection at the KIR loci has been assessed using diversity among KIR loci based on rates of synonymous/non-synonymous changes (Hughes 2002), analyses of LD among loci (Norman et al. 2004), comparisons of allele frequency spectra (summarized briefly in the paragraph below), and correlations between evolutionary patterns for KIR and MHC class I genes (Hao and Nei 2005; Hiby et al. 2004; Norman et al. 2007; Single et al. 2007).
Allelic typing for KIR allows the comparison of observed allele frequency distributions with expectations under selective neutrality, and several studies have found patterns of variation consistent with balancing selection. Norman et al.(2004)(2004) found 3DL1 allele frequency distributions that were significantly more even than expected under neutrality based on Watterson's (1978) test. Gendzekhadze et al.(2006) reported high values for Tajima's D as evidence for balancing selection for 3DL1/S1 in three Amerindian tribes from Venezuela. Yawata et al.(2006) used both Ewens-Watterson test and Tajima's D to demonstrate evidence of balancing selection for telomeric loci (2DL4, 3DL1, 2DS4, and 3DL2) and positive selection for two centromeric loci (2DL1 and 2DL3) in Japanese HSCT donors. Comparison of the nucleotide sequences of the different alleles at a locus can also be informative about selective regimes. Jones et al. (2006) found evidence of purifying selection at 3DL3 based on low rates of nonsynonymous compared to synonymous changes for 3DL3 alleles (i.e., low values for the dN/dS ratio). Norman et al. (2007) reported evidence of directional selection for domains D1 - D2 of 3DL1 and weak signs of balancing selection for domain D0 in Africans, and greater evidence of balancing selection was reported for European and South Asian populations. The abovementioned results are based on allele-level typing for specific KIR loci and are only a brief summary of selected KIR studies of this nature. In what follows we focus on evidence of selection for combinations of KIR and HLA that primarily involve gene content data.
Selection for KIR-HLA combinations
Several studies have hypothesized that selection pressure, favoring frequencies of activating KIR that suit the locale-specific HLA repertoire, has helped shape the evolution of the KIR gene cluster (Hiby et al. 2004; Norman et al. 2007; Single et al. 2007). Evidence along these lines has come from disease association studies (Kulkarni et al. 2008) and comparative genetic studies across primate species (Abi-Rached and Parham 2005; Hao and Nei 2005; Khakoo et al. 2000).
Considerable attention has been devoted to the effects of selection on KIR and HLA combinations. Hiby et al. (2004) found that the inhibitory combination of maternal homozygosity for KIR haplotype A along with C2 alleles led to increased prevalence of preeclampsia in Caucasians. Based on this model they hypothesized that population frequencies for C2 alleles and haplotype A homozygous genotypes would be inversely related. They found this pattern in an analysis of eight populations, and additional evidence in this direction was provided by Yawatta et al. (2006) based on the low C2 and high haplotype A frequencies in Japanese. A difficulty in interpreting the results of Hiby et al. (2004) is that the data for KIR and HLA that were available for this analysis were not generated from the same set of individuals in each population, and so the populationlevel relationship between haplotype A and C group2 frequencies appear to have been overestimated (Figure 2). While the same set of individuals typed for KIR and HLA (and/or other markers) is not always possible, and thus alternative techniques are then needed to control for sampling (e.g., Meyer et al. 2006), this type of data is becoming more readily available.
Figure 2.

Correlation between KIR and HLA frequencies. (a) The strong negative correlation (-0.82) reported in Hiby et al. (2004) was based on available data at the time in which HLA and KIR were typed in different cohorts. (b) A much weaker correlation (-0.21) was found using the data from Single et al. (2007), in which HLA and KIR were typed in the same individuals. The solid line represents the estimated regression line and the dashed line is the regression line after removing the outlier in the lower left quadrant (correlation=-0.37).
Another concern for studies of natural selection is the fact that the demographic history of populations also shapes the patterns of variation. For example, population structure can mimic the effects of balancing selection, and recent demographic expansions can mimic the patterns of variation expected for loci under positive selection (Bamshad and Wooding 2003). Thus, certain tests may indicate deviation from neutrality simply because the assumptions of population equilibrium (rather than selective neutrality) are being violated. One approach to dealing with the effects of demographic history is to implement statistical tests that incorporate information about the demographic histories of the populations (Pritchard and Donnelly 2001; Pritchard et al. 2000).
A particularly critical challenge for studies that compare frequencies across populations is that allele/gene frequencies are not statistically independent among populations, due to their shared history. If the populations are treated as independent, as in a standard regression or correlation analysis, the statistical significance of these correlations can be incorrect. It is therefore necessary to develop methods which correct for the non-independence among populations, when testing for correlations among allele/gene frequencies.
When correlation results are used to address the issue of selection, the real comparison of interest is whether the observed distribution is significantly different from what you would expect for neutral (non-selected) loci. Thus, a solution to the problem of non-overlapping datasets, non-independence among populations and to the effects of demographic history, is to compare the loci of interest to other loci for the same population samples. The loci used for purposes of comparison can be assumed to have experienced the same demographic history as the loci of interest and, since the same populations are used, the pattern of non-independence remains constant. In the case of correlations between KIR and HLA frequencies, this involves asking how often random pairs of unlinked loci are correlated as strongly as or more strongly than the KIR and HLA loci of interest, yielding an empirical p-value that accounts for non-independence among populations.
An additional approach for testing the significance of correlations between KIR and HLA frequencies is to compare the observed relationship between the frequencies to a distribution of values generated under the null hypothesis of no relationship between KIR and HLA frequencies using permutation-based methods. Both the permutation-based and empirical approaches account for non-independence induced by shared history. The application of these methods is described below.
Table 6 lists observed correlations between KIR carrier frequency and HLA allele frequency for functionally relevant KIR/HLA pairs. For each KIR/HLA pair, the three different p-values are presented: 1) the ordinary Pearson product-moment correlation p-value; 2) the empirical p-value based on genomic comparisons; and 3) the permutation-based p-value. Each of the p-values is from a two-sided test, but the Pearson correlation does not account for non-independence among population pairs. In the empirical approach, gene frequencies for 538 unlinked genomic sites in 202 genes, typed in the same set of populations in the ALFRED database, were used to generate an empirical distribution of correlations between gene frequencies for pairs of unlinked sites. Each of the sites used had a heterozygosity of at least 0.25. The empirical p-value represents the proportion of times that the correlation between two randomly chosen sites on different chromosomes was larger in absolute value than the correlation between KIR gene frequencies and HLA gene frequencies. In the permutation-based approach, labels for the C group1/2 (or Bw4/6) status of each HLA-C (or HLA-B) allele were randomly assigned before computing “reassigned HLA” gene frequencies at each iteration. The correlation between KIR carrier frequencies and “reassigned HLA” gene frequencies was computed 10,000 times in order to generate a resampling distribution of correlation coefficients under the null hypothesis. The permutation p-value represents the proportion of times that a larger absolute correlation than the true KIR-HLA correlation was observed in the permutation distribution. It is important to note that the permutation-based approach is only possible when one can generate a resampling distribution for a given statistic under the null hypothesis of interest. In the above example, this is accomplished by permuting the labels for C group1/2 (or Bw4/6) status.
Correlation between KIR and HLA ligand frequencies.
| locus pair | Correlation(a) | p-value(b) (Pearson) | p-value(c) (empirical) | p-value(d) (permutation) |
|---|---|---|---|---|
| 3DS1 - Bw4 | -0.632 | <0.001 | 0.041 | 0.012 |
| 3DS1 - Bw480i | -0.657 | <0.001 | 0.038 | 0.009 |
| 3DS1 - Bw480t | -0.19 | 0.316 | 0.534 | 0.532 |
| 3DL1 - Bw4 | 0.426 | 0.019 | 0.218 | 0.106 |
| 3DL1 - Bw480i | 0.416 | 0.022 | 0.191 | 0.115 |
| 3DL1 - Bw480t | 0.171 | 0.367 | 0.758 | 0.54 |
| 2DL1 - C group2 | 0.046 | 0.81 | 0.924 | 0.891 |
| 2DL2 - C group1 | -0.366 | 0.047 | 0.542 | 0.193 |
| 2DL3 - C group1 | 0.184 | 0.331 | 0.328 | 0.458 |
| 2DS1 - C group2 | -0.478 | 0.008 | 0.149 | 0.243 |
| 2DS2 - C group1 | -0.371 | 0.044 | 0.479 | 0.17 |
Pearson product-moment correlation between KIR carrier frequency (CF) and HLA ligand gene frequency (GF).
The ordinary Pearson product-moment correlation p-value, which does not account for non-independence among populations.
The empirical p-value is the proportion of times that a larger absolute correlation than the true correlation between KIR GF and HLA GF was observed in the empirical distribution, generated by computing correlations between GFs for 10,000 pairs of unlinked sites typed in the same populations as the present study from the ALFRED database.
The resampling p-value is the proportion of times that a larger absolute correlation than the true correlation between KIR CF and HLA GF was observed in the resampling distribution, generated by computing correlations between KIR CF and “reassigned HLA” GF 10,000 times.
The empirical and permutation-based methods generated consistent results for the significance of correlations in Table 6. The ordinary Pearson correlation p-value, which does not account for non-independence among populations, overstated the significance for several of the KIR/HLA pairs. Similar empirical methods can be used for other regression based approaches including, for example, relationships with geography (Figure 3). The significance of these trends was overestimated based on p-values from an ordinary regression analysis which did not account for the lack of independence among populations (Single et al. 2007). The three panels of Figure 3 provide further evidence of the balance between the frequencies of activating receptors and their corresponding ligands across populations and the coevolution of the HLA class I and KIR loci, although further work is needed in order to determine the degree to which these geographic trends are due to selection or demographic history.
Figure 3.

Relationship between distance from East Africa and KIR/HLA frequency (a) Carrier frequencies for activating KIR3DS1 generally increase with greater distance from E. Africa. (b) For the putative HLA Bw4 ligand group, carrier frequencies for the subset of Bw4-80I alleles decrease with greater distance from E. Africa. (c) Frequencies for the compound genotype KIR3DS1/Bw4-80I show no discernable geographic trend.
Evidence of the balance between selection on KIR and HLA has come from a variety of sources. Population genetic studies have revealed signatures of balancing selection acting on specific KIR and HLA loci. Disease studies have shown that activating KIR genotypes and compound KIR-HLA genotypes are, in general, associated with higher risk of autoimmune disease but lower risk for certain infectious diseases. This balance between the level of activation and inhibition is also important for reproductive success through the maintenance of pregnancies. Population-level studies provide an opportunity to corroborate results from other study designs, such as disease association studies, on the evolution of the KIR genes through careful analysis of KIR diversity within and among populations.
Acknowledgements
We thank G. Thomson for comments on the manuscript, J. Hollenbach for helpful discussions, and H. Rajeevan and M. Osier for assistance with the ALFRED database. This project has been funded in whole or in part with federal funds from the National Cancer Institute, National Institutes of Health, under contract N01-CO-12400. The content of this publication does not necessarily reflect the views or policies of the Department of Health and Human Services, nor does mention of trade names, commercial products or organizations imply endorsement by the US Government. This research was supported in part by the Intramural Research Program of the NIH, National Cancer Institute, Center for Cancer Research. This publication was supported in part by NIH/NIAID contract number HHSN266200400076C, ABD N01-AI-40076 (R.M.S). Its contents are solely the responsibility of the authors and do not necessarily represent the official views of the NIH. The computational resources provided by the Vermont Advanced Computing Center which is supported by NASA ( NNX 06AC88G) are gratefully acknowledged. D.M. was supported by FAPESP grant 03/01583-8.
REFERENCES
- Abi-Rached L, Parham P. Natural selection drives recurrent formation of activating killer cell immunoglobulin-like receptor and Ly49 from inhibitory homologues. J Exp Med. 2005;201:1319–32. doi: 10.1084/jem.20042558. [DOI] [PMC free article] [PubMed] [Google Scholar]
- Bamshad M, Wooding SP. Signatures of natural selection in the human genome. Nat Rev Genet. 2003;4:99–111. doi: 10.1038/nrg999. [DOI] [PubMed] [Google Scholar]
- Carrington M, Cullen M. Justified chauvinism: Advances in defining meiotic recombination through sperm typing. Trends Genet. 2004;20:196–205. doi: 10.1016/j.tig.2004.02.006. [DOI] [PubMed] [Google Scholar]
- Cramer H. Mathematical Methods of Statistics. Princeton University Press; Princeton: 1946. [Google Scholar]
- Dempster AP, Laird NM, Rubin DB. Maximum likelihood from incomplete data via the EM algorithm. J Royal Stat Soc. 1977;39:1–38. [Google Scholar]
- Excoffier L, Slatkin M. Maximum-likelihood estimation of molecular haplotype frequencies in a diploid population. Mol Biol Evol. 1995;12:921–927. doi: 10.1093/oxfordjournals.molbev.a040269. [DOI] [PubMed] [Google Scholar]
- Garrigan D, Hedrick PW. Perspective: detecting adaptive molecular polymorphism: lessons from the MHC. Evolution Int J Org Evolution. 2003;57:1707–22. doi: 10.1111/j.0014-3820.2003.tb00580.x. [DOI] [PubMed] [Google Scholar]
- Gendzekhadze K, Norman PJ, Abi-Rached L, Layrisse Z, Parham P. High KIR diversity in Amerindians is maintained using few gene-content haplotypes. Immunogenetics. 2006;58:474–80. doi: 10.1007/s00251-006-0108-3. [DOI] [PubMed] [Google Scholar]
- Gomez-Lozano N, Gardiner CM, Parham P, Vilches C. Some human KIR haplotypes contain two KIR2DL5 genes: KIR2DL5A and KIR2DL5B. Immunogenetics. 2002;54:314–9. doi: 10.1007/s00251-002-0476-2. [DOI] [PubMed] [Google Scholar]
- Gourraud P-A, Barnetche T, Vidan-Jeras B, Cambon-Thomsen A. Introduction to statistical analysis of population data in immunogenetics. Transplant Immunology. 2005;14:245–253. doi: 10.1016/j.trim.2005.03.016. [DOI] [PubMed] [Google Scholar]
- Gourraud PA, Gagne K, Bignon JD, Cambon-Thomsen A, Middleton D. Preliminary analysis of a KIR haplotype estimation algorithm: a simulation study. Tissue Antigens. 2007;69(Suppl 1):96–100. doi: 10.1111/j.1399-0039.2006.762_4.x. [DOI] [PubMed] [Google Scholar]
- Hao L, Nei M. Rapid expansion of killer cell immunoglobulin-like receptor genes in primates and their coevolution with MHC Class I genes. Gene. 2005;347:149–59. doi: 10.1016/j.gene.2004.12.012. [DOI] [PubMed] [Google Scholar]
- Hedrick PW. Gametic disequilibrium measures: proceed with caution. Genetics. 1987;117:331–41. doi: 10.1093/genetics/117.2.331. [DOI] [PMC free article] [PubMed] [Google Scholar]
- Hiby SE, Walker JJ, M. OSK, Redman CW, Carrington M, Trowsdale J, Moffett A. Combinations of maternal KIR and fetal HLA-C genes influence the risk of preeclampsia and reproductive success. J Exp Med. 2004;200:957–65. doi: 10.1084/jem.20041214. [DOI] [PMC free article] [PubMed] [Google Scholar]
- Hsu KC, Liu XR, Selvakumar A, Mickelson E, O'Reilly RJ, Dupont B. Killer Ig-like receptor haplotype analysis by gene content: evidence for genomic diversity with a minimum of six basic framework haplotypes, each with multiple subsets. J Immunol. 2002;169:5118–29. doi: 10.4049/jimmunol.169.9.5118. [DOI] [PubMed] [Google Scholar]
- Hughes AL. Evolution of the human killer cell inhibitory receptor family. Mol Phylogenet Evol. 2002;25:330–40. doi: 10.1016/s1055-7903(02)00255-5. [DOI] [PubMed] [Google Scholar]
- Jones DC, Hiby SE, Moffett A, Trowsdale J, Young NT. Nature of allelic sequence polymorphism at the KIR3DL3 locus. Immunogenetics. 2006;58:614–627. doi: 10.1007/s00251-006-0130-5. [DOI] [PubMed] [Google Scholar]
- Khakoo SI, Carrington M. KIR and disease: A model system or system of models? Immunol Rev. 2006;214:186–201. doi: 10.1111/j.1600-065X.2006.00459.x. [DOI] [PubMed] [Google Scholar]
- Khakoo SI, Rajalingam R, Shum BP, Weidenbach K, Flodin L, Muir DG, Canavez F, Cooper SL, Valiante NM, Lanier LL, Parham P. Rapid evolution of NK cell receptor systems demonstrated by comparison of chimpanzees and humans. Immunity. 2000;12:687–98. doi: 10.1016/s1074-7613(00)80219-8. [DOI] [PubMed] [Google Scholar]
- Kulkarni S, Martin MP, Carrington M. Seminars in Immunology. 2008. The Yin and Yang of HLA and KIR in Human Disease. In Press. [DOI] [PMC free article] [PubMed] [Google Scholar]
- Lewontin RC. The interaction of selection and linkage. I. General considerations; heterotic models. Genetics. 1964;49:49–67. doi: 10.1093/genetics/49.1.49. [DOI] [PMC free article] [PubMed] [Google Scholar]
- Martin AM, Kulski JK, Gaudieri S, Witt CS, Freitas EM, Trowsdale J, Christiansen FT. Comparative genomic analysis, diversity and evolution of two KIR haplotypes A and B. Gene. 2004;335:121–131. doi: 10.1016/j.gene.2004.03.018. [DOI] [PubMed] [Google Scholar]
- Mattiuz PL, Ihde D, Piazza A, Ceppellini R, Bodmer WF. New approaches to the population genetic and segregation analysis of the HLA system. In: Terasaki PI, editor. Histocompatibility Testing 1970. Munskaard; Copenhagen: 1971. p. 193. [Google Scholar]
- Maxwell LD, Wallace A, Middleton D, Curran MD. A common KIR2DS4 deletion variant in the human that predicts a soluble KIR molecule analogous to the KIR1D molecule observed in the rhesus monkey. Tissue Antigens. 2002;60:254–8. doi: 10.1034/j.1399-0039.2002.600307.x. [DOI] [PubMed] [Google Scholar]
- Meyer D, Single RM, Mack SJ, Erlich HA, Thomson G. Signatures of demographic history and natural selection in the human major histocompatibility complex Loci. Genetics. 2006;173:2121–42. doi: 10.1534/genetics.105.052837. [DOI] [PMC free article] [PubMed] [Google Scholar]
- Middleton D, Meenagh A, Gourraud PA. KIR haplotype content at the allele level in 77 Northern Irish families. Immunogenetics. 2007;59:145–58. doi: 10.1007/s00251-006-0181-7. [DOI] [PubMed] [Google Scholar]
- Middleton D, Williams F, Halfpenny IA. KIR genes. Transpl Immunol. 2005;14:135–142. doi: 10.1016/j.trim.2005.03.002. [DOI] [PubMed] [Google Scholar]
- Mueller JC. Linkage disequilibrium for different scales and applications. Briefings in Bioinformatics. 2004;5:1–10. doi: 10.1093/bib/5.4.355. [DOI] [PubMed] [Google Scholar]
- Norman PJ, Abi-Rached L, Gendzekhadze K, Korbel D, Gleimer M, Rowley D, Bruno D, Carrington CV, Chandanayingyong D, Chang YH, Crespi C, Saruhan-Direskeneli G, Fraser PA, Hameed K, Kamkamidze G, Koram KA, Layrisse Z, Matamoros N, Mila J, Park MH, Pitchappan RM, Ramdath DD, Shiau MY, Stephens HA, Struik S, Verity DH, Vaughan RW, Tyan D, Davis RW, Riley EM, Ronaghi M, Parham P. Unusual selection on the KIR3DL1/S1 natural killer cell receptor in Africans. Nature Genet. 2007;39:1092–9. doi: 10.1038/ng2111. [DOI] [PubMed] [Google Scholar]
- Norman PJ, Carrington CV, Byng M, Maxwell LD, Curran MD, Stephens HA, Chandanayingyong D, Verity DH, Hameed K, Ramdath DD, Vaughan RW. Natural killer cell immunoglobulin-like receptor (KIR) locus profiles in African and South Asian populations. Genes Immun. 2002;3:86–95. doi: 10.1038/sj.gene.6363836. [DOI] [PubMed] [Google Scholar]
- Norman PJ, Cook MA, Carey BS, Carrington CV, Verity DH, Hameed K, Ramdath DD, Chandanayingyong D, Leppert M, Stephens HA, Vaughan RW. SNP haplotypes and allele frequencies show evidence for disruptive and balancing selection in the human leukocyte receptor complex. Immunogenetics. 2004;56:225–37. doi: 10.1007/s00251-004-0674-1. [DOI] [PubMed] [Google Scholar]
- Pritchard JK, Donnelly P. Case-Control Studies of Association in Structured or Admixed Populations. Theoretical Population Biology. 2001;60:227–237. doi: 10.1006/tpbi.2001.1543. [DOI] [PubMed] [Google Scholar]
- Pritchard JK, Stephens M, Rosenberg NA, Donnelly P. Association Mapping in Structured Populations. The American Journal of Human Genetics. 2000;67:170–181. doi: 10.1086/302959. [DOI] [PMC free article] [PubMed] [Google Scholar]
- Sasieni P. From Genotypes to Genes: Doubling the Sample Size. Biometrics. 1997;53:1253–1261. [PubMed] [Google Scholar]
- Schipper RF, D'Amaro J, de Lange P, Schreuder GM, van Rood JJ, Oudshoorn M. Validation of haplotype frequency estimation methods. Hum Immunol. 1998;59:518–23. doi: 10.1016/s0198-8859(98)00054-8. [DOI] [PubMed] [Google Scholar]
- Shilling HG, Guethlein LA, Cheng NW, Gardiner CM, Rodriguez R, Tyan D, Parham P. Allelic polymorphism synergizes with variable gene content to individualize human KIR genotype. J Immunol. 2002;168:2307–15. doi: 10.4049/jimmunol.168.5.2307. [DOI] [PubMed] [Google Scholar]
- Single RM, Martin MP, Gao X, Meyer D, Yeager M, Kidd JR, Kidd KK, Carrington M. Global diversity and evidence for coevolution of KIR and HLA. Nature Genet. 2007;39:1114–9. doi: 10.1038/ng2077. [DOI] [PubMed] [Google Scholar]
- Slatkin M. Linkage disequilibrium - Understanding the evolutionary past and mapping the medical future. Nature Reviews Genetics. 2008;9:477–485. doi: 10.1038/nrg2361. [DOI] [PMC free article] [PubMed] [Google Scholar]
- Slatkin M, Excoffier L. Testing for linkage disequilibrium in genotypic data using the Expectation-Maximization algorithm. Heredity. 1996;76:377–83. doi: 10.1038/hdy.1996.55. [DOI] [PubMed] [Google Scholar]
- Stankiewicz P, Lupski JR. Genome architecture, rearrangements and genomic disorders. Trends Genet. 2002;18:74–82. doi: 10.1016/s0168-9525(02)02592-1. [DOI] [PubMed] [Google Scholar]
- Tishkoff SA, Kidd KK. Implications of biogeography of human populations for `race' and medicine. Nat. Genet. 2004;36:S21–S27. doi: 10.1038/ng1438. [DOI] [PubMed] [Google Scholar]
- Toneva M, Lepage V, Lafay G, Dulphy N, Busson M, Lester S, Vu-Trien A, Michaylova A, Naumova E, McCluskey J, Charron D. Genomic diversity of natural killer cell receptor genes in three populations. Tissue Antigens. 2001;57:358–62. doi: 10.1034/j.1399-0039.2001.057004358.x. [DOI] [PubMed] [Google Scholar]
- Uhrberg M, Valiante NM, Shum BP, Shilling HG, Lienert-Weidenbach K, Corliss B, Tyan D, Lanier LL, Parham P. Human diversity in killer cell inhibitory receptor genes. Immunity. 1997;7:753–63. doi: 10.1016/s1074-7613(00)80394-5. [DOI] [PubMed] [Google Scholar]
- Watterson GA. The homozygosity test of neutrality. Genetics. 1978;88:405–417. doi: 10.1093/genetics/88.2.405. [DOI] [PMC free article] [PubMed] [Google Scholar]
- Weiss KM, Clark AG. Linkage disequilibrium and the mapping of complex human traits. Trends in Genetics. 2002;18:19. doi: 10.1016/s0168-9525(01)02550-1. [DOI] [PubMed] [Google Scholar]
- Williams RC, Steinberg AG, Knowler WC, Pettitt DJ. Gm 3;5,13,14 and stated-admixture: independent estimates of admixture in American Indians. Am J Hum Genet. 1986;39:409–13. [PMC free article] [PubMed] [Google Scholar]
- Yawata M, Yawata N, Draghi M, Little AM, Partheniou F, Parham P. Roles for HLA and KIR polymorphisms in natural killer cell repertoire selection and modulation of effector function. J Exp Med. 2006;203:633–45. doi: 10.1084/jem.20051884. [DOI] [PMC free article] [PubMed] [Google Scholar]
- Yawata M, Yawata N, McQueen KL, Cheng NW, Guethlein LA, Rajalingam R, Shilling HG, Parham P. Predominance of group A KIR haplotypes in Japanese associated with diverse NK cell repertoires of KIR expression. Immunogenetics. 2002;54:543–50. doi: 10.1007/s00251-002-0497-x. [DOI] [PubMed] [Google Scholar]
- Yoo Y, Kaslow R, Tang J, Zhang K. Haplotype inference for present-absent genotype data for clustered genes using identified haplotypes and haplotype patterns. Bioinformatics. 2007;23:2399–2406. doi: 10.1093/bioinformatics/btm371. [DOI] [PubMed] [Google Scholar]