

Abstract
True alloantigen-specific tolerance is the ultimate goal of solid organ transplantation, eliminating the need for long-term immunosuppression. Recent evidence suggests that Th1-derived cytokines are associated with rejection and Th2-derived cytokines with long-term allograft survival, but the roles of these subsets in rejection and tolerance are incompletely understood. Here, we analyzed the functional and regulatory capacities of T cell clones derived from tolerant and rejecting rats (Wistar rat donors, Lewis rat recipients). We generated and subcloned T cell lines from lymphocytes derived from either acutely rejecting grafts or from the grafts of CTLA4-Ig–treated tolerant rats. Pretransplantation adoptive transfer of T cell clones generated from rejected grafts (Th1 clones) accelerated acute rejection or promoted development of chronic rejection, whereas transfer of T cell clones generated from tolerized grafts (Th2 clones) protected rats from acute rejection and progressive organ dysfunction. When Th1 and Th2 clones were injected simultaneously, Th2 clones specifically regulated activation of Th1 clones. Rats that received injections of Th2 clones accepted long-term donor-specific skin grafts but acutely rejected third-party skin grafts. Tolerant rats treated with Th2 clones demonstrated an increased number of regulatory CD4+CD25+Foxp3+ cells and strong mononuclear cell staining for IL-10 but negligible IFN-γ, IL-17, and IL-23 compared with untreated rats or those treated with Th1 clones. In summary, these results demonstrate the regulatory functions of Th2 cells in a clinically relevant allogeneic transplant model and provide new insight into the functional role of Th2 cells in preventing the process of chronic rejection.
The ultimate goal of solid organ transplantation is to create a situation of indefinite allograft survival and true alloantigen-specific tolerance without the need for long-term immunosuppression. This objective has remained elusive and reflects our fundamental uncertainty regarding the active and passive immunologic mechanisms that define the tolerant state. Many diverse approaches including T cell co-stimulatory blockade, T cell depletion, micro-/macrochimerism, and the induction of active persistent regulatory mechanisms all have been shown to improve allograft survival. It is not known, however, whether these approaches lead to several distinct types of tolerance or lead to a single common pathway of tolerance.
The roles of Th1 and Th2 subsets in rejection and transplantation tolerance have not been fully elucidated, but a body of literature shows an association between the predominance of a Th2 response and tolerance.1 It has been observed from studies that reduced anti–donor-specific reactivity, including a state of immunologic tolerance, is associated with a decrease in expression of the Th1-associated cytokines IL-2 and IFN-γ. Conversely, IL-4, IL-5, IL-10, and IL-13 production typical of Th2 cells has been associated with long-term allograft survival. Furthermore, it has been noted that Th1 cells are able to regulate the function of Th2 cells and that in turn Th2 cells can downregulate an aggressive Th1 response.2
Several key questions about the role of Th2 cells in transplantation tolerance remain unclear. The evidence that Th2 cytokines are important in inducing peripheral tolerance comes from several different areas of research. First, there is a correlation between production of Th2-associated cytokines and models of tolerance induction, especially those involving T cell co-stimulatory blockade.3–6 Second, IL-10 in particular is important in downregulating an aggressive T cell response as indicated by studies that have shown that blockade of IL-10 abrogates the suppressive effect of T regulatory cells (Tregs) on skin allograft rejection.7 Third, IL-10 has been shown to be produced by Tregs themselves.8 Last, Th2 clones generated from hyporesponsive animals can transfer tolerance to naive animals in a model of murine autoimmune encephalomyelitis,9 providing evidence that Th2 cells can function as regulatory cells in vivo. Other studies, however, have shown that IL-4 knockout mice are still capable of being tolerized, indicating either a redundancy at the level of cytokine production or the Treg subsets. In support of this argument, it has been shown that the suppressive effect of IL-10–producing Tregs can be inhibited by Th1 or Th2 cells10; therefore, whether a Th2 switch regulates alloimmune responses remains controversial.11–13 IL-23 and Th17 cells have been discussed as major players in autoimmunity, but their role in transplantation remains unclear. IL-17 is likely to be involved in either the causation or the progression of inflammatory diseases and transplantation rejection in humans. It has been shown that a resistance of Th1 and Th2 cells in vitro to proliferation or production of IL-17 after stimulation with IL-23 as well as development of IL-17–producing cells were inhibited by the presence of IFN-γ and/or IL-4.14–17
Our previously published data demonstrated an association between the presence of Th2 phenotypic clones and a tolerant state in rodents (delayed-type hypersensitivity [DTH]).18 These findings were consistent with an influential paradigm, which holds that Th1-derived cytokines promote rejection and Th2-derived cytokines protect against this response by suppressing the DTH reaction. These data suggest that the interplay of Th1 and regulatory Th2 cells is associated with indefinite graft survival and tolerance in the preclinical model, as well as for functional tolerance in the clinical situation.19 Here, we extend our observations to prove a causal role for the Th1 clones in initiating rejection and for the Th2 clones in preventing rejection in vivo using an allogeneic transplant model.
RESULTS
We previously showed that T cell clones derived from rejecting allografts were of the Th1 type expressing IL-2 and INF-γ, whereas the T cell clones from tolerant grafts were Th2, expressing IL-4 and IL-10,18 and we subsequently confirmed that the Th2 clones express Fox-p3 whereas Th1 clones do not (data not shown). In this follow-up study, we used the Th1 and Th2 clones to prove a causal role for the Th1 clones in initiating rejection and for the Th2 clones in preventing rejection in an experimental allogeneic kidney transplant model.
Graft Survival and Function
As seen in Figure 1A, unmodified Wistar rat Lewis rat (LEW) recipients acutely rejected Wistar rat (WF) renal allografts (graft survival 5.6 ± 1.1 d). Adoptive transfer of the Th1 cell clones resulted in a significant, albeit small, acceleration of graft rejection (4.8 ± 0.8 d; P < 0.0001 versus controls), whereas adoptive transfer of the Th2 clones resulted in a slight but also significant prolongation of graft survival (10.7 ± 1.0 d; P < 0.001 versus controls). Co-adoptive transfer of the Th1 (15 × 106 cells) plus Th2 clones (15 × 106 cells) resulted in a mean graft survival (7.8 ± 2.3 d) not significantly different from unmodified controls. We developed a model using a short course of low-dosage cyclosporine (CsA) therapy to prolong graft survival to investigate more fully the mechanisms of adoptive transfer of the Th1 and Th2 clones on allograft survival and function. As seen in Figure 1B, treatment with the CsA protocol resulted in chronic graft rejection (MST (mean survival time) 122.1 ± 33.2 d; n = 8). Adoptive transfer of the Th1 cell clones resulted in significant acceleration of graft loss (MST 64.0 ± 19.8 d; P < 0.0001; n = 8); transfer of Th2 clones resulted in long-term survival (>250 d; P < 0.0001; n = 8), similar to syngeneic controls; and transfer of Th1 + Th2 clones resulted in long-term survival (MST 217.9 ± 41.2 d) with four of seven rats surviving >250 d indicating that the Th2 clones were able to reverse the effects of Th1 clones in accelerating allograft rejection. Long-term surviving rats (>250 d) that received the Th2 clones accepted secondary donor-specific skin transplants (>60 d; n = 6) but rejected third party August Copenhagen Irish (ACI) skin grafts (MST 7.5 ± 1.5 d), confirming the specificity of the functions of Th2 cells in regulating alloimmune responses in vivo.
Figure 1.

Graft survival and function. (A) Unmodified LEW recipients acutely rejected WF renal allografts. Adoptive transfer of the Th1 cell clones resulted in a significant, albeit small, acceleration of graft rejection (P < 0.0001 versus controls), whereas adoptive transfer of the Th2 clones resulted in a slight but also significant prolongation of graft survival (P < 0.001 versus controls). Co-adoptive transfer of the Th1 + Th2 clones resulted in a mean graft survival that was not significantly different from unmodified controls. (B) Treatment with a short course of low-dosage CsA resulted in chronic graft rejection. Adoptive transfer of the Th1 cell clones to CsA-treated animals (Th1/CsA) resulted in significant acceleration of graft loss (P < 0.0001). Th2/CsA rats survived long term. Th1 + Th2 clones/CsA resulted in long-term survival with 57.1% of the rats surviving >250 d (n = 6 to 8 rats per group).
Urinary protein excretion is a sensitive measure of progression of chronic allograft dysfunction in this model.20 Isograft recipients had baseline urinary protein excretion of <20 mg/24 h throughout the follow-up period (Figure 2A). Control rats treated with CsA developed progressive proteinuria indicative of chronic allograft dysfunction. Rats that received injections of the Th1 clones rapidly developed proteinuria significantly higher than controls (Figure 2A). When rats received injections of the Th2 cell clones, urinary protein excretion remained virtually at baseline (Figure 2A). Rats that received injections of both Th1 and Th2 clones slowly developed mildly progressive proteinuria (Figure 2A; n = 7 to 8 rats per group).
Figure 2.
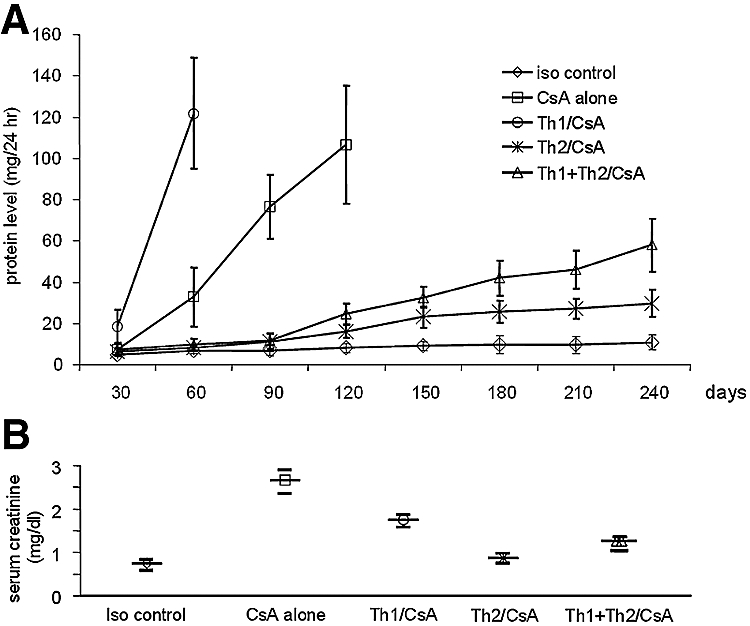
Urine protein levels and serum creatinine levels. (A) Development of proteinuria in the various groups is shown. A significant increase of urine protein levels was observed in the control group treated with CsA alone and in the group that was administered an injection additionally of Th1 cell clones (CsA alone versus Th1/CsA, P < 0.0001, 60 d after transplantation; CsA alone versus Th2/CsA, P < 0.0001, 120 d after transplantation; Th2/CsA versus Th1/CsA, P < 0.0001, 60 d after transplantation). Urinary protein levels were significantly reduced in the group that was administered an injection of Th2 cell clones and treated with CsA, and there was a moderate development of urine protein in the group that was administered an injection of Th1 + Th2 cell clones and treated with CsA (Th2/CsA versus Th1 + Th2/CsA, P < 0.05, 180 d after transplantation, P < 0.005, 240 d after transplantation). Urinary protein in the syngeneic control group is shown for comparison (iso control; n = 6 to 8 rats per group). (B) As an additional assessment of graft function, levels of serum creatinine were measured at the time of killing. Creatinine was significantly increased in the control group treated with CsA alone and in the group that was administered an injection additionally of Th1 cell clones. No increase in serum creatinine levels occurred in treated rats with Th2 and Th1 + Th2 cell clones at the end of the observation time when the rats were killed, comparable to the isograft controls (n = 6 to 8 rats per group).
Serum creatinine was measured at the end of each observation period. Recipients that received injections of a Th1 cell clone and were treated with CsA and rats treated with CsA alone showed significantly increased serum creatinine levels compared with rats that received injections of Th2 or Th1 + Th2 cell clones and were treated with CsA (1.75 ± 0.21 and 2.6 ± 0.63 versus 0.97 ± 0.13 and 1.27 ± 0.17 mg/dl; P < 0.0001). No increase in serum creatinine in Th2/CsA-treated rats was observed, comparable to syngeneic controls (0.97 ± 0.13 versus 0.75 ± 0.1 mg/dl; n = 7 to 8 rats per group; Figure 2B). The proteinuria and serum creatinine data and graft survival data indicate that Th1 clones promote progression of chronic allograft nephropathy, whereas Th2 clones function to regulate alloimmune responses, resulting in protection from progressive chronic rejection.
Cells Obtained from Rats that Received Injections of Th2 Clones Had Significantly Higher Frequencies of IL-10–Producing Alloreactive Cells
When the rats were killed, the frequency and phenotype of alloreactive lymphocytes of rats in the various groups were determined by enzyme-linked immunosorbent spot (ELISPOT) analysis of splenocytes in response to WF donor cells in vitro, as described previously.21 As seen in Figure 3, control CsA-treated rats and rats that received injections of the Th1 clones had significantly higher frequencies of IFN-γ–producing (as a prototype Th1 cytokine) cells but not of IL-10–producing (as a prototype Th2 cytokine) cells compared with other groups. In contrast, splenocytes obtained from rats that received injections of Th2 clones had significantly higher frequencies of IL-10–but not IFN-γ–producing alloreactive cells. Rats that received injections of the Th1 + Th2 clones had significant frequencies of alloreactive T cells producing IFN-γ and IL-10.
Figure 3.

IFN-γ and IL-10 ELISPOT analysis of splenocytes. Splenocytes from control rats that were treated with CsA (CsA alone) and rats that were administered an injection of Th1 cell clones and treated with CsA (Th1/CsA) produced IFN-γ but only a minimal amount of IL-10, whereas those from rats that were administered an injection of Th2 and Th1 + Th2 cell clones and treated with CsA produced IL-10 but less IFN-γ in response to stimulation with lysed WF cells (Th1/CsA versus Th2/CsA, P < 0.0001 for both cytokines; frequency = spots/106 cells; n = 6).
All Kidneys from Recipients that Received Injections of the Th2 Clones Were Comparable to Isografts
When the rats were killed, kidneys from rats treated with CsA alone showed evidence of progressive changes of chronic allograft nephropathy with glomerulosclerosis, tubular atrophy, and interstitial mononuclear cell infiltration (Table 1) that were not apparent in syngeneic controls, which were virtually normal (Table 1). These chronic changes were more severe in rats that received the Th1 clones, although these recipients survived a significantly shorter time than controls with >75% of glomeruli being sclerotic and with increased mesangial matrix and mesangial cell proliferation, intensified interstitial fibrosis, dense interstitial cell infiltration, and tubular atrophy and dilation (Table 1). In contrast, recipients that received injections of the Th2 clones were comparable to isografts with only mild chronic vascular changes of medium-size vessels predominantly at the corticomedullary junction compared with syngeneic controls. Interestingly, these grafts showed mild to moderate focal interstitial cellular infiltrates in the cortex and corticomedullary junction (Table 1). Kidneys from rats that received injections of Th1 + Th2 cell clones were similar to the Th1-treated rats when survival was <250 d (three of seven) or Th2-treated animals when survival was >250 d (Table 1).
Table 1.
Histomorphologic changes between groupsa
| Parameter | Iso control (≥250 d) | CsA alone (122 ± 33 d) | Th1/CsA (64 ± 20 d) | Th2/CsA (≥250 d) | Th1 + Th2/CsA (218 ± 41 d) |
|---|---|---|---|---|---|
| Glomerulosclerosis | −/+ | ++/+++ | +++ | −/+ | +/++ |
| Mononuclear cell infiltrates | −/(+) | +++ | +++ | (+)/+ patchy | (+)/+ patchy (n = 4/7) |
| Tubular atrophy and dilation | (+) | ++ | ++/+++ | (+) | (+) |
| Vasculopathy | 0 | ++ | ++ | −/(+) | + |
| Interstitial fibrosis | (+) | ++ | +++ | (+) | (+)/+ |
Percentage of altered glomeruli: −, none; +, up to 10%; ++, up to 25%; +++, up to 50%; ++++, >50%; mononuclear cell infiltrates: −, none; (+), occasionally; +, patchy, rare cluster around vessels; ++, moderate; +++, severe; tubular atrophy, vasculopathy: −, none; (+), minimal; +, slight; ++, moderate; +++, severe; interstitial fibrosis: (+), <10%; +, 20 to 30%; ++, 31 to 40%; +++, >40%; n = 7 to 8 per group.
Th2 Transfer Was Accompanied by Strong Mononuclear Cell Staining for IL-10
We performed immunohistologic evaluation of renal allografts (n = 3 per group). Recipients treated with CsA and adoptively transferred with Th1 or Th2 clones showed comparable degree of mononuclear cell infiltrates clustered around vessels and glomeruli (Figure 4). Infiltrates consisted of mostly CD4+ T cells and a few CD8+ T cells. Analyses of CD25+ and Foxp3+ expression showed that Th1 transfer was associated with decreased intragraft staining for CD25+ and only focal and weak staining for Foxp3+, whereas Th2 transfer was accompanied by increased CD25+ cells and strong mononuclear cell staining for Foxp3+ (Figure 4). There were relatively few CD8+ cells in the Th2-treated group with negligible CD8+/Foxp3+ staining (data not shown). Comparison of cytokine expression showed that Th1 transfer was associated with weak intragraft staining for IL-10 and increased staining for IFN-γ, IL-17, and IL-23, whereas Th2 transfer was accompanied by negligible IFN-γ, IL-17, and IL-23 and strong mononuclear cell staining for IL-10 (Figure 5; n = 3 rats per group). Cytokine-absorbed sections were unstained, and neither group showed more than trace expression of IL-4 (data not shown).
Figure 4.

(A) Immunopathology of intragraft events at day of the killing in recipients receiving CsA and transfer of a Th1 or Th2 clone, as indicated. Immunoperoxidase localization of CD4+, Foxp3+, CD25+, and CD8+ cells is shown. Findings are representative of three grafts per group; arrows indicate positive staining; asterisks indicate glomeruli. (B) Number of CD4+, Foxp3+, and CD25+ cells was increased in rats treated with the Th2 cell clone as compared with controls treated only with CsA or rats treated with the Th1 cell clone and CsA. Infiltrates consisted of mostly CD4+ T cells and a few CD8+ T cells. Cells were scored by semiquantitative analysis (0, no positive cells; 1, <10% positive cells; 2, 10 to 30% positive cells; 3, >30% positive cells; n = 3 rats per group). Magnification, ×200 (hematoxylin counterstain).
Figure 5.

(A) Immunofluorescence of intragraft events at day of killing in rats receiving CsA and injection of Th1 or Th2 clones, as indicated. Immunofluorescence localization of IL-10+, IFN-γ+, IL-17+, and IL-23+ cells is shown. Findings are representative of three grafts per group. Bar = 50 μm. (B) Expression of IL-10 is more pronounced in rats treated with the Th2 cell clone as compared with controls treated only with CsA and those from rats treated with the Th1 cell clone and CsA. In contrast, expression of IFN-γ, IL-17, and IL-23 was higher in controls treated only with CsA and those from rats treated with the Th1 cell clone and CsA than in rats treated with Th2 cell clone. Cells were scored by semiquantitative analysis (0, no positive cells; 1, <10% positive cells; 2, 10 to 30% positive cells; 3, >30% positive cells; n = 3 rats per group). Magnification, ×400 (4′,6-diamidino-2-phenylindoldihydrochloride counterstain).
Intragraft Gene Transcript Analysis
We performed RNA for gene transcript levels of IL-1β, IL-2, IL-4, IL-6, TNF-α, IFN-γ, and IL-10. Chronically rejected donor kidneys from rats treated with CsA alone or with Th1 clones expressed more IL-1β, IL-2, IL-6, TNF-α, and IFN-γ. Kidneys from rats that received injections of the Th2 cell clones expressed IL-10 (Figure 6A), consistent with the immunohistologic results described already.
Figure 6.

(A) Gene expression of IL-1β, IL-2, IL-6, TNF-α, and IFN-γ assessed by RNAse protection assay was elevated in kidneys from rats that were administered an injection of Th1 cell clones and treated with CsA as well as from those treated with CsA alone. Cytokine gene expression in kidneys from rats that were administered an injection of Th2 cell clones and treated with CsA resembled that of syngeneic controls. IL-10 expression was elevated in rats treated with the cell clone and CsA (n = 6 rats per group, normalized OD ratio). (B) mRNA expression of representative mediators of inflammation and chronic rejection. MCP-1 and TGF-β were analyzed together with IL-1β and TNF-α in renal allografts by real-time PCR. (A through C) mRNA levels for IL-1β (A), TNF-α (D), and TGF-β (C) gene expression in allogeneic control kidneys and Th1/CsA group; kidneys from rats that were administered an injection of Th1 cell clones and treated with CsA were significantly upregulated compared with syngeneic controls. (B) In addition, MCP-1 was upregulated in Th1/CsA group (CsA alone and Th1/CsA versus iso control, P < 0.0001). Cytokine levels in kidney grafts from rats injected with Th2 and Th1 + Th2 cell clones and treated with CsA and from syngeneic controls remained at baseline (Th2/CsA and iso control versus Th1/CsA, P < 0.0001; n = 6 rats per group, relative quantification value, fold change, expressed as 2−ΔΔCt). The results were obtained from recipients killed at the end of the observation time.
To study the expression of key inflammatory mediators that have been previously reported to be associated with chronic rejection, we used real-time PCR.22,23 Expression of mRNA for IL-1β, TNF-α, monocyte chemoattractant protein 1 (MCP-1), and TGF-β was significantly upregulated in kidneys from CsA-treated rats and rats that received injections of the Th1 clones as compared with syngeneic controls (Figure 6B). Expression of these factors in the Th2-injected rats was not significantly different from syngeneic controls (n = 6 rats per group).
More CD4+CD25+ T Cells in Recipients with Th2 Cell Transfer
To investigate the role of CD4+CD25+ T cells in the process of tolerance, we obtained lymph node lymphocytes from recipients at the end of the observation time and observed a significantly higher amount of CD4+CD25+ cells in CsA-treated rats that received injections of Th2 cells (9.2% double-positive cells) compared with those that received injections of Th1 cells (5.8% double-positive cells). Interestingly, a higher amount of CD3+CD4+ T cells were detected in rats treated with Th1 cells (55.3%) compared with those treated with Th2 cells (29%; Figure 7; n = 6 rats per group).
Figure 7.

CD4+CD25+ T cells isolated from lymph nodes of the rats. There were significantly higher number of CD4+CD25+ cells in the group receiving Th2 cell transfer, compared with the group receiving Th1 transfer. A higher number of CD3+CD4+ T cells were detected in the group receiving Th1 cell transfer than with Th2 transfer. The frequency of CD3+CD8+ T cells is also shown. Findings are representative of six rats per group. These results were obtained from lymph nodes of the killed rats at the end of the observation period.
DISCUSSION
Tregs represent a subset of cells that are capable of pacifying an aggressive T cell response against alloantigen and have been shown to be able to modulate an alloimmune response in vitro and in vivo. A clinical application of regulatory cells would involve the expansion and infusion of Tregs into a transplanted recipient. Cell-based tolerogenic therapy has a number of advantages because cells are expanded in vitro without systemic treatment of an individual and allow the specific targeting of known alloantigens. A number of T regulatory phenotypes have been described, including CD4+CD25+, Foxp3, CTLA4+, TGF-β, and Th2-associated cells.24 In this study, we examined the role of Th1/Th2 cell clones and their effect on graft survival when injected into rats that underwent transplantation.
Several studies in experimental models of autoimmune disease and transplantation have shown that tolerance induction is associated with a state of “immune deviation” toward a Th2 cell phenotype with upregulation of Th2-associated cytokines in the target organ,3,5,6 although it has also been proposed that indirectly primed Th2 cells may promote chronic rejection.25 The possible involvement of the proinflammatory cytokine IL-17, which is not produced by Th1 or Th2 cells, may further reveal a deficiency of applying the binary Th1/Th2 model of allograft rejection/acceptance. These Th17+ cells were shown to be stimulated by IL-23, which is released by macrophages and dendritic cells. It has been demonstrated that these Th17+ cells were identified in rat renal allograft rejection and may affect Treg-induced transplant tolerance. Other studies have shown inhibition of IL-17–producing cells by IFN-γ (Th1 cells) and IL-4 (Th2 cells)14; therefore, the exact role of Th1, Th2, and Th17 T cell subsets with regard to allograft rejection and tolerance remains controversial. In this study, we show that clones of Th2 cells can be isolated from tolerant rats and propagated in vitro by stimulation with allo-MHC–derived peptides and recipient antigen-presenting cells. These clones therefore recognize antigens through the indirect pathway of allorecognition and by cytokine production as well as cell surface markers are characterized as being of a Th2 phenotype.24
If the Th1/Th2 cytokine responses or ratios do not necessarily determine tolerance, then the question remains whether other mechanisms may better define tolerogenic pathways. In our previous study,18 tolerance was induced by co-stimulatory blockade with CTLA4-Ig, a treatment that our group had previously shown to favor the predominant expression of Th2 cytokines6; however, treatments that promote tolerance through co-stimulatory blockade do not always increase the relative expression of Th2 cytokines but can affect the T lymphocyte phenotype. Thus, treatment with anti-CD80 mAb in vivo can skew autoreactive T cells from a Th1 toward a Th2 phenotype, whereas blockade of CD86 can generate a Th1 phenotype.26 CD80/CD86 blockade can lead to selective death of activated Th1 cells stimulated with high-dosage antigen or anti-CD3 mAb, but CD80/CD86 blockade in the context of weaker T cell stimulation can lead to the secretion of both Th1 and Th2 cytokines. In Th2-mediated diseases, co-stimulatory blockade with anti–CTLA4 mAb inhibits Th2 responses, whereas anti-CD80 mAb leads to increased numbers of Th2 CD4+ regulatory cells, but both treatments inhibit the resultant disease process.26–28 Thus, the antigen presented, the pathway of presentation, the immunogenicity or affinity of the peptide, and the antigen load all may contribute to differences in the cytokine outcomes during tolerogenesis by T cell co-stimulatory blockade. These observations raise the possibility that the Th2 predominance that we observed could be an effect of rather than the mechanism behind18 the tolerant state induced by CTLA4-Ig. Hence, some other aspect of co-stimulatory blockade may be responsible for tolerance. These data also suggest that multiple types of Tregs actively deviate or suppress the immune function of other T cells to maintain tolerance and to control or prevent allograft rejection, autoimmunity, or hypersensitivity. The best characterized of these cells is the CD4+CD25+ and Foxp3+ T cell subset that inhibits among others autoimmune response. It was also shown that cardiac allograft tolerance is mediated by CD4+CD25+ Tregs primed by indirect recognition and is associated with high levels of IL-10.29 In this study, a significantly higher number of CD4+CD25+Foxp3+ cells were detected in the group that received Th2 cell transfer than in the Th1 group, indicating that Tregs are likely to be involved in the tolerance process.
Both indirect allorecognition and Th2 cells have been associated with the development of chronic allograft rejection. In this study, we show that Th2 clones not only can be derived from tolerant animals but also can prolong allograft survival and induce transplantation tolerance. Adoptive transfer of these cells is not associated with the chronic rejection but rather protects against the chronic rejection that develops in CsA-treated animals and is associated with decreased infiltrating cells releasing proinflammatory cytokines (IFN-γ, IL-17, and IL-23). This indicates that deviation to a Th2 phenotype can suppress an aggressive alloimmune response.
These clones were derived from tolerant rats, but naturally occurring Th2 cells can be isolated from transplant recipients treated with conventional immunosuppressive drugs and propagated in vitro.18,30 These cells can also suppress an alloimmune response in vitro. It has also been suggested that conventional immunosuppression, particularly CsA, abrogates the ability to induce certain forms of transplantation tolerance, especially through the use of T cell co-stimulatory blockade.31 Here we show that Treg clones are not only compatible with CsA but also a necessary component in the adoptive transfer of transplantation tolerance in this model. Finally, we show that chronic rejection induced by Th1 cell clone transfer is associated with increased Th17+ cells and the proinflammatory IL-23 cytokine, both of which were decreased in transplant recipients that received injections of the Th2 cell clones.
With these results, we provide the first functional description of Th2 alloreactive T cell clones generated via the indirect pathway of allorecognition in an allogeneic transplant setting and prove a causal role for the Th1 cell clones in initiating rejection and an ability of Th2 cell clones to regulate chronic rejection and induce tolerance. We also show that chronic rejection induced by Th1 cell clone transfer is associated with increased Th17+ cells and proinflammatory IL-23, which are decreased in transplant recipients of Th2 cell clone transfer.
CONCISE METHODS
Rats and Operative Techniques
Inbred male rats (Harlan Sprague-Dawley, Indianapolis, IN), 8 to 10 wk of age and weighing 200 to 250 g, were used throughout the experiments. LEW (RT1l) served as recipients of kidney allografts from WF (RT1u) donors. ACI (RT1a) rats were used as donors for skin grafting experiments as specificity controls. All animal experiments were conducted in accordance with the National Institutes of Health Guide for the Care and Use of Laboratory Animals.
Experimental Groups
We used the well established WF→LEW kidney transplant model. In this fully MHC-mismatched model, transplanted WF kidneys in otherwise untreated LEW recipients promptly reject the transplant organ at day 6 to 7 after transplantation. Nine groups of rats were set up. Groups 1 through 5 were not treated with CsA. Groups 1 and 2 served as isogeneic and allogeneic control groups, respectively. Groups 3 through 5 and 7 through 9 were administered injections of Th1, Th2, or a combination of Th1 and Th2 clone cells, with or without concomitant CsA therapy. Group 6 served as an allogeneic control with CsA.
CsA (Novartis Pharmaceuticals Corp., E. Hanover, NJ) was administered (1 mg/kg days 0 through 3 and 5 mg/kg days 4 through 7, subcutaneously) to inhibit early host functional activity to prevent early graft loss but not to influence the development of chronic rejection and the effect of the T cell clones. Recipients in groups 7 through 9 with CsA therapy were administered intraperitoneal injections of either Th1 or Th2 (30 × 106) or Th1 (15 × 106) + Th2 (15 × 106) cell clones at the end of the transplant procedure (n = 8 rats per group; Table 2). The combination of Th1 + Th2 cell clones was used to confirm the regulatory functions of the Th2 cells. Specific tolerance was tested by skin transplantation with syngeneic (LEW), allogeneic (WF), or third-party (ACI) skin grafts. Rats were dependent on transplanted kidney function; as the allograft failed, rats became uremic. Rats that seemed ill from uremia were killed, and rejection was confirmed histologically and defined as the day of killing. Long-term functional, structural, and molecular differences were assessed at 250 d in surviving rats.
Table 2.
Experimental groups and therapya
| Group | Strain Combination | Therapy |
|---|---|---|
| 1 | LEW→LEW | None |
| 2 | WF→LEW | None |
| 3 | WF→LEW | Th1 cell clone (30 × 106) |
| 4 | WF→LEW | Th2 cell clone (30 × 106) |
| 5 | WF→LEW | Th1 + Th2 cell clone (30 × 106) |
| 6 | WF→LEW | CsA, 1 mg/kg days 0 through 3 and 5 mg/kg days 4 through 7, subcutaneously |
| 7 | WF→LEW | Th1 cell clone (30 × 106) + CsA, 1 mg/kg days 0 through 3 and 5 mg/kg days 4 through 7, subcutaneously |
| 8 | WF→LEW | Th2 cell clone (30 × 106) + CsA, 1 mg/kg days 0 through 3 and 5 mg/kg days 4 through 7, subcutaneously |
| 9 | WF→LEW | Th1 + Th2 cell clone (30 × 106) + CsA, 1 mg/kg days 0 through 3 and 5 mg/kg days 4 through 7, subcutaneously |
Group 2 versus group 3, P < 0.0001; group 3 versus group 4, P < 0.0001; group 3 versus group 5, P < 0.005; group 6 versus group 7, P < 0.0001; group 6 versus group 8, P < 0.0001; group 7 versus group 8, P < 0.0001; n = 6 to 8 per group.
MHC Allopeptides
The polymorphic RT1.B and RT1.D β domains of RT1u (WF) were selected, and two peptides corresponding to residues 20 through 44 were synthesized commercially (Quality Control Biochemicals, Hopkinston, MA) as described previously.32 Peptide RT1.Dβ has been shown by our group to be immunogenic in vitro and in vivo; it induces a T cell proliferative response in vitro and DTH response in vivo after immunization of LEW animals.18 In addition, both peptides induce a proliferative response in T cells of animals rejecting WF vascularized allografts, and priming LEW recipients with the RT1.Duβ20–44 peptide before transplantation accelerates the rejection process of vascularized WF cardiac allografts.33
Establishment of RT1.Duβ20–44 T Cell Lines and Clones
Lymphocytes were isolated from the transplanted kidney of acutely rejecting (day 7) or tolerant (>100 d) LEW recipients of fully allogeneic WF renal allografts, as described previously.18,32
Measurement of Renal Function
To determine functional changes occurring over time, we collected urine (24 h) every 4 wk between 4 and 32 wk from all rats in groups 6 through 9 (n = 8 per group). Protein excretion was determined by measuring precipitation after interaction with 3% sulfosalicylic acid (Fisher Scientific, Fair Lawn, NJ). Turbidity was assessed by absorbance at a wavelength of 595 nm using a Coleman Junior II Spectrophotometer. In addition, serum creatinine levels were measured by a modified Jaffe reaction on an autoanalyzer (911; Hitachi, Indianapolis, IN).
ELISPOT Assay
For the detection of the cells producing IFN-γ and IL-10 of groups 6 through 9 in response to lysed WF cells, rats were killed in these groups when renal failure occurred; the ELISPOT assay was used as described previously.21 Briefly, 96-well ImmunoSpot plates (C.T.L. Analyzers LLC, Cleveland, OH) were coated overnight in a humidified box at 4°C with 100 μl/well of 4 μg/ml capture antibody anti-rat IFN-γ (OptEIATM set; BD PharMingen, San Diego, CA) or 100 μl/well of 2 μg/ml mouse anti-rat IL-10–unconjugated mAb (2G101H7 clone; Biosource International, Camarillo, CA) in sterile PBS. For detection of IFN-γ and IL-10 producers, after the plates were washed, 5 × 10⁵ lysed splenocytes (ACK Lysing Buffer; BioWhittaker, Walkersville, MD) from groups 6 through 9 rats were cultured with 5 × 10⁵ irradiated (3000 rads) lysed splenocytes from naive WF rats in the presence or absence of 1 μg/well Concanavalin A (positive control; Sigma-Aldrich, St Louis, MO) in RPMI 1640 medium containing 10% FCS and 1% l-glutamine. Irradiated splenocytes from naive rats and splenocytes from groups 6 through 9 rats, which were tested alone, served as negative controls. After incubation (24 h for IFN-γ or 48 h for IL-10) at 37°C and 5% CO2, the plates were washed and plated with 100 μl/well of 6 μg/ml detection antibody, biotinylated anti-rat IFN-γ (OptEIATM set; BD PharMingen), or 2 μg/ml mouse anti-rat IL-10 biotin conjugated mAb (A96B 1A3 1E2 clone; Biosource International) in PBS-TWEEN (0.05% Polyoxyethylene-Sorbitan Mono Laurate, Tween20; Sigma-Aldrich) plus BSA-Fraction V (1% BSA; Sigma) and incubated overnight in a humidified box at 4°C. The plates were washed and incubated for at least 2 h at room temperature with 100 μl/well 1:2000 diluted streptavidin–horseradish peroxidase in PBS-BSA (Dako, Carpinteria, CA). The plates were washed again and developed using 200 μl/well visualization solution that contained 800 μl of 3-amino-9-ethyl carbazole (100 mg 3-amino-9-ethyl carbazole in 10 ml N,N-dimethyl formamide; Fisher Scientific, Pittsburgh, PA) in 24 ml of 0.1 M acetate buffer, passed through a 0.45-μm filter, and added to 12 μl of 30% H2O2 (Fisher Scientific) to precipitate at the site of the original cytokine secretion resulting in “spots.: The resulting spots were counted on a computer-assisted ELISA Spot Image Analyzer (CTL, Cleveland, OH). The experiments were repeated four times. The results are expressed as the frequency of cytokine-producing cells per million cells.
Histology and Immunohistology
To examine the effects of the T cell clones of development of chronic rejection, we fixed representative portions of allo- and isografts (groups 1 and 6 through 9) in 10% buffered formalin at the time of killing for histomorphologic examination. Additional pieces from all kidney grafts were snap-frozen in liquid nitrogen and stored at −80°C for RNAse protection assay and real-time PCR. Paraffin sections were evaluated using periodic acid-Schiff and Mason's trichrome for collagen. Matched trichrome-stained sections were examined for the presence of fibrosis. All samples were read by two examiners blinded to the groups. (Percentage of altered glomeruli: −, none; +, up to 10%; ++, up to 25%; +++, up to 50%; ++++, >50%; mononuclear cell infiltrates: −, none; (+), occasionally; +, patchy, rare cluster around vessels; ++, moderate; +++, severe; tubular atrophy, vasculopathy: −, none; (+), minimal; +, slight; ++, moderate; +++, severe; interstitial fibrosis: (+), <10%; +, 20 to 30%; ++, 31 to 40%; +++, >40%.)
For immunohistology, cryostat sections were fixed in paraformaldehyde-lysine-periodate for labeling of cell-surface antigens, or in acetone for localization of cytokines, bound antibodies were detected using a peroxidase-antiperoxidase method.34 For immunofluorescence staining, serial cryostat sections (5 μm) were mounted on glass slides and fixed in acetone for 10 min and then dried for 5 min. Subsequently, the slides were incubated with the primary antibody or control antibody diluted in TBS plus 0.5% BSA overnight at 4°C in a humidified chamber and with secondary FITC-conjugated antibody for 30 min at room temperature in a humidified chamber. Slides were counterstained with DAPI (4′,6-diamidino-2-phenylindoldihydrochloride; Sigma-Aldrich, Steinheim, Germany) and covered with polyvinyl-alcohol mounting medium (DABCO; Sigma-Aldrich) and analyzed using a Zeiss camera (Jena, Germany). Photographed Images using a Zeiss camera and the Metamorph software (Visitron Systems, Puchheim, Germany) package were imported into Microsoft Office Picture Manager. Positively stained cells were scored semiquantitatively as follows: 0, no positive cells; 1, <10% positive cells; 2, 10 to 30% positive cells; 3, >30% positive cells.
mAbs were purchased from Serotec (Harlan Bioproducts for Science, Indianapolis, IN) except where noted and were directed against rat T cells (T cell receptor α/β, R73), CD4 (W3/25), CD8 (OX-8), and CD25 subsets; macrophages (ED-1) and Foxp3 Ab was provided by Imgenex (Hamburg, Germany). Cytokine expression was determined using mAbs to rat IL-4 (OX-81), IL-10 (A5-4; R&D Systems, Minneapolis, MN), IFN-γ (DB-10; P. van der Meide, Rijswijk, Holland), IL-17, and IL-23 (Santa Cruz, Heidelberg, Germany). Control mAbs, rabbit IgG, and secondary antibodies were purchased from BD PharMingen. Isotype-matched mAbs and rabbit IgG were included in each experiment. Controls for cytokine staining were provided by staining of renal allografts undergoing acute rejection (IFN-γ) or permanent engraftment in CTLA4-Ig–tolerized recipients (IL-4, IL-10) as well as IL-17 and IL-23. Positive cytokine staining in each experiment was compared with sections stained with cytokine-absorbed mAbs.34
RNAse Protection Assay
To analyze a whole panel of cytokines relevant for specific inflammatory events and chronic rejection, we performed RNAse protection using the Riboquant Multi-Probe RNAse Protection assay system (BD PharMingen). RNA was isolated from kidney grafts using Trizol. 32P-labeled probes were synthesized from the rCK-1 Multi-Probe Template Set (PharMingen, San Diego, CA) and were hybridized overnight with RNA samples in hybridization buffer according to the manufacturer's instructions. Samples were digested with RNAse and T1 mix in RNAse buffer, and protected probes were purified and run on a 5% acrylamide gel in 0.5% TBE buffer. Control RNA from kidney grafts and a dilution of the probe set (serving as size markers) were run in parallel. The gel was absorbed onto filter paper, dried, and exposed onto Kodak photographic paper at −70°C for 24 h. The RNA was analyzed by a phosphoimager using Imagequant software, allowing accurate quantification of mRNA.
Real-Time PCR
Expression of representative adhesion molecules, cytokines, and growth factors was assessed by real-time PCR (n = 4 to 6 per group; groups 1 and 6 through 9). Real-time PCR was used to determine representative cell products of inflammatory and immunologic events, IL-1β, TNF-α, MCP-1, and TGF-β, in groups 6 through 9. Total RNA was extracted from snap-frozen kidney tissue by the acid guanidium isothiocyanate-phenol chloroform extraction method.35 RNA was quantified by determination of ultraviolet absorbance at 260 nm; the purity was assessed by measuring the OD ratio at 260 and 280 nm. For real-time PCR, cDNA was prepared using 2 μg of heat-denatured RNA, and the following primer sequences were used for glyceraldehyde-3-phosphate dehydrogenase (Sigma Genosys, Woodlands, TX): 5′-ATG GCA CAG TCA AGG CTG AGA-3′ and 5′-CGC TCC TGG AAG ATG GTG AT-3′, IL-1β 5′-TGC ACT ACA GGC TCC GAG ATG-3′ and 5′-TGG AGA GCT TTC AGC TCA TAT GG-3′, TNF-α 5′-ACA AGG CTG CCC CGA CTA C-3′ and 5′-TCC TGG TAT GAA ATG GCA AA-3′, MCP-1 5′CAG ATC TCT CTT CCT CCA CCA CTA T-3′ and 5′-CAG GCA GCA ACT GTG AAC AAC-3′, and TGF-β 5′-GCT GCT GAC CCC CAC TGA T-3′ and 5′-GCC ACT GCC GGA CAA CTC-3′. Primers were designed using the Primer Express software for primer design to amplify short segments of 50 to 150 bp of target cDNA. Optimum primer concentration was assessed by performing primer titration. Real-time quantitative PCR was performed in a two-step reverse transcription–PCR using SYBR Green PCR Master Mix (PE Biosystems, Foster City, CA) using 100 ng of cDNA and 300 nM of primers in a total reaction volume of 50 μl. The PCR thermal cycle consisted of heating to 95°C for 10 min, followed by 40 cycles of heating to 95°C for 15 s and cooling to 60°C for 60 s. Gene-specific products were continuously measured by means of the ABI Prism 7700 sequence detector (Applied Biosystems, Foster City, CA), and relative quantification was calculated as directed by the manufacturer. All samples were performed in duplicate and normalized during data analysis by a Passive Reference dye provided in the SYBR Green PCR Master Mix to correct for well-to-well fluorescence solutions. To quantify the target template, we calculated the average Ct value (threshold cycle), the cycle number at which fluorescence of reporter reaches a fixed threshold above baseline. then the difference (ΔCt) between the average Ct values of the samples in the target wells and those of the housekeeping gene glyceraldehyde-3-phosphate dehydrogenase, then the difference (ΔΔCt) between the average ΔCt values of the samples for each target and the ΔCt value of the control sample for that target. The relative quantification value, fold change, was expressed as 2−ΔΔCt.
FACS Analysis of Recipient Cells
Draining lymph nodes from recipients of groups 8, 7, 6, and 1 were harvested, and a cell suspension was prepared. The cells were then washed and resuspended in PBS. Cells were double staining with anti-CD3, anti-CD4 or anti-CD8, or anti-CD4 and anti-CD25 and isotype mAb. All antibodies were purchased from BD PharMingen. Samples were analyzed by flow cytometry on FACScan (BD Immnocytrometry Systems).
Statistical Analysis
Graft survival was expressed graphically by the Kaplan-Meier method, and statistical differences in survival between groups were assessed by the log-rank test. The t test was used for comparison of means. P < 0.05 was considered statistically significant.
DISCLOSURES
None.
Acknowledgments
This work is supported by National Institutes of Health grant A151664-4 and Deutsche Bundesstiftung Umwelt (16011). Anil Chandraker is a recipient of the National Kidney Foundation Clinical Scientist Award.
Published online ahead of print. Publication date available at www.jasn.org.
M.G. and A.C. contributed equally to this work.
REFERENCES
- 1.Mantel PY, Kuipers H, Boyman O, Rhyner C, Ouaked N, Ruckert B, Karagiannidis C, Lambrecht BN, Hendriks RW, Crameri R, Akdis CA, Blaser K, Schmidt-Weber CB: GATA3-driven Th2 responses inhibit TGF-beta1-induced FOXP3 expression and the formation of regulatory T cells. PLoS Biol 5: e329, 2007 [DOI] [PMC free article] [PubMed] [Google Scholar]
- 2.Paul WE, Seder RA: Lymphocyte responses and cytokines. Cell 76: 241–251, 1994 [DOI] [PubMed] [Google Scholar]
- 3.Hancock WW, Sayegh MH, Zheng XG, Peach R, Linsley PS, Turka LA: Costimulatory function and expression of CD40 ligand, CD80, and CD86 in vascularized murine cardiac allograft rejection. Proc Natl Acad Sci U S A 93: 13967–13972, 1996 [DOI] [PMC free article] [PubMed] [Google Scholar]
- 4.Khoury SJ, Gallon L, Chen W, Betres K, Russell ME, Hancock WW, Carpenter CB, Sayegh MH, Weiner HL: Mechanisms of acquired thymic tolerance in experimental autoimmune encephalomyelitis: Thymic dendritic-enriched cells induce specific peripheral T cell unresponsiveness in vivo. J Exp Med 182: 357–366, 1995 [DOI] [PMC free article] [PubMed] [Google Scholar]
- 5.Khoury SJ, Gallon L, Verburg RR, Chandraker A, Peach R, Linsley PS, Turka LA, Hancock WW, Sayegh MH: Ex vivo treatment of antigen-presenting cells with CTLA4Ig and encephalitogenic peptide prevents experimental autoimmune encephalomyelitis in the Lewis rat. J Immunol 157: 3700–3705, 1996 [PubMed] [Google Scholar]
- 6.Sayegh MH, Akalin E, Hancock WW, Russell ME, Carpenter CB, Linsley PS, Turka LA: CD28–B7 blockade after alloantigenic challenge in vivo inhibits Th1 cytokines but spares Th2. J Exp Med 181: 1869–1874, 1995 [DOI] [PMC free article] [PubMed] [Google Scholar]
- 7.Hara M, Kingsley CI, Niimi M, Read S, Turvey SE, Bushell AR, Morris PJ, Powrie F, Wood KJ: IL-10 is required for regulatory T cells to mediate tolerance to alloantigens in vivo. J Immunol 166: 3789–3796, 2001 [DOI] [PubMed] [Google Scholar]
- 8.Hoffmann P, Ermann J, Edinger M, Fathman CG, Strober S: Donor-type CD4(+)CD25(+) regulatory T cells suppress lethal acute graft-versus-host disease after allogeneic bone marrow transplantation. J Exp Med 196: 389–399, 2002 [DOI] [PMC free article] [PubMed] [Google Scholar]
- 9.Kuchroo VK, Das MP, Brown JA, Ranger AM, Zamvil SS, Sobel RA, Weiner HL, Nabavi N, Glimcher LH: B7-1 and B7-2 costimulatory molecules activate differentially the Th1/Th2 developmental pathways: Application to autoimmune disease therapy. Cell 80: 707–718, 1995 [DOI] [PubMed] [Google Scholar]
- 10.Barrat FJ, Cua DJ, Boonstra A, Richards DF, Crain C, Savelkoul HF, de Waal-Malefyt R, Coffman RL, Hawrylowicz CM, O'Garra A: In vitro generation of interleukin 10-producing regulatory CD4(+) T cells is induced by immunosuppressive drugs and inhibited by T helper type 1 (Th1)- and Th2-inducing cytokines. J Exp Med 195: 603–616, 2002 [DOI] [PMC free article] [PubMed] [Google Scholar]
- 11.Field EH, Gao Q, Chen NX, Rouse TM: Balancing the immune system for tolerance: A case for regulatory CD4 cells. Transplantation 64: 1–7, 1997 [DOI] [PubMed] [Google Scholar]
- 12.Nickerson P, Steiger J, Zheng XX, Steele AW, Steurer W, Roy-Chaudhury P, Strom TB: Manipulation of cytokine networks in transplantation: False hope or realistic opportunity for tolerance? Transplantation 63: 489–494, 1997 [DOI] [PubMed] [Google Scholar]
- 13.Piccotti JR, Chan SY, VanBuskirk AM, Eichwald EJ, Bishop DK: Are Th2 helper T lymphocytes beneficial, deleterious, or irrelevant in promoting allograft survival? Transplantation 63: 619–624, 1997 [DOI] [PubMed] [Google Scholar]
- 14.Afzali B, Lombardi G, Lechler RI, Lord GM: The role of T helper 17 (Th17) and regulatory T cells (Treg) in human organ transplantation and autoimmune disease. Clin Exp Immunol 148: 32–46, 2007 [DOI] [PMC free article] [PubMed] [Google Scholar]
- 15.Chen Y, Wood KJ: Interleukin-23 and TH17 cells in transplantation immunity: Does 23+17 equal rejection? Transplantation 84: 1071–1074, 2007 [DOI] [PubMed] [Google Scholar]
- 16.Harrington LE, Hatton RD, Mangan PR, Turner H, Murphy TL, Murphy KM, Weaver CT: Interleukin 17-producing CD4+ effector T cells develop via a lineage distinct from the T helper type 1 and 2 lineages. Nat Immunol 6: 1123–1132, 2005 [DOI] [PubMed] [Google Scholar]
- 17.Park H, Li Z, Yang XO, Chang SH, Nurieva R, Wang YH, Wang Y, Hood L, Zhu Z, Tian Q, Dong C: A distinct lineage of CD4 T cells regulates tissue inflammation by producing interleukin 17. Nat Immunol 6: 1133–1141, 2005 [DOI] [PMC free article] [PubMed] [Google Scholar]
- 18.Waaga AM, Gasser M, Kist-van Holthe JE, Najafian N, Muller A, Vella JP, Womer KL, Chandraker A, Khoury SJ, Sayegh MH: Regulatory functions of self-restricted MHC class II allopeptide-specific Th2 clones in vivo. J Clin Invest 107: 909–916, 2001 [DOI] [PMC free article] [PubMed] [Google Scholar]
- 19.VanBuskirk AM, Burlingham WJ, Jankowska-Gan E, Chin T, Kusaka S, Geissler F, Pelletier RP, Orosz CG: Human allograft acceptance is associated with immune regulation. J Clin Invest 106: 145–155, 2000 [DOI] [PMC free article] [PubMed] [Google Scholar]
- 20.Gasser M, Waaga-Gasser AM, Kist-van Holthe JE, Yuan X, Lenhard SM, Abdallah KA, Chandraker A: Chronic rejection: Insights from a novel immunosuppressive-free model of kidney transplantation. J Am Soc Nephrol 15: 687–694, 2004 [DOI] [PubMed] [Google Scholar]
- 21.Yuan X, Salama AD, Dong V, Schmitt I, Najafian N, Chandraker A, Akiba H, Yagita H, Sayegh MH: The role of the CD134-CD134 ligand costimulatory pathway in alloimmune responses in vivo. J Immunol 170: 2949–2955, 2003 [DOI] [PubMed] [Google Scholar]
- 22.Azuma H, Chandraker A, Nadeau K, Hancock WW, Carpenter CB, Tilney NL, Sayegh MH: Blockade of T-cell costimulation prevents development of experimental chronic renal allograft rejection. Proc Natl Acad Sci U S A 93: 12439–12444, 1996 [DOI] [PMC free article] [PubMed] [Google Scholar]
- 23.Nadeau KC, Azuma H, Tilney NL: Sequential cytokine dynamics in chronic rejection of rat renal allografts: roles for cytokines RANTES and MCP-1. Proc Natl Acad Sci U S A 92: 8729–8733, 1995 [DOI] [PMC free article] [PubMed] [Google Scholar]
- 24.Bluestone JA, Thomson AW, Shevach EM, Weiner HL: What does the future hold for cell-based tolerogenic therapy? Nat Rev Immunol 7: 650–654, 2007 [DOI] [PubMed] [Google Scholar]
- 25.Shirwan H: Chronic allograft rejection: Do the Th2 cells preferentially induced by indirect alloantigen recognition play a dominant role? Transplantation 68: 715–726, 1999 [DOI] [PubMed] [Google Scholar]
- 26.Anderson DE, Sharpe AH, Hafler DA: The B7-CD28/CTLA-4 costimulatory pathways in autoimmune disease of the central nervous system. Curr Opin Immunol 11: 677–683, 1999 [DOI] [PubMed] [Google Scholar]
- 27.Xu H, Heeger PS, Fairchild RL: Distinct roles for B7-1 and B7-2 determinants during priming of effector CD8+ Tc1 and regulatory CD4+ Th2 cells for contact hypersensitivity. J Immunol 159: 4217–4226, 1997 [PubMed] [Google Scholar]
- 28.Sakurai J, Ohata J, Saito K, Miyajima H, Hirano T, Kohsaka T, Enomoto S, Okumura K, Azuma M: Blockade of CTLA-4 signals inhibits Th2-mediated murine chronic graft-versus-host disease by an enhanced expansion of regulatory CD8+ T cells. J Immunol 164: 664–669, 2000 [DOI] [PubMed] [Google Scholar]
- 29.Koksoy S, Elpek KG, Yolcu ES, Shirwan H: Tolerance to rat heart grafts induced by intrathymic immunomodulation is mediated by indirect recognition primed CD4+CD25+ Treg cells. Transplantation 79: 1492–1497, 2005 [DOI] [PubMed] [Google Scholar]
- 30.Kist-van Holthe JE, Gasser M, Womer K, Najafian N, Dong V, Samsonov DV, Geehan CS, Chandraker A, Sayegh MH, Waaga AM: Regulatory functions of alloreactive Th2 clones in human renal transplant recipients. Kidney Int 62: 627–631, 2002 [DOI] [PubMed] [Google Scholar]
- 31.Izawa A, Sayegh MH, Chandraker A: The antagonism of calcineurin inhibitors and costimulatory blockers: Fact or fiction? Transplant Proc 36: 570S–573S, 2004 [DOI] [PubMed] [Google Scholar]
- 32.Waaga AM, Chandraker A, Spadafora-Ferreira M, Iyengar AR, Khoury SJ, Carpenter CB, Sayegh MH: Mechanisms of indirect allorecognition: Characterization of MHC class II allopeptide-specific T helper cell clones from animals undergoing acute allograft rejection. Transplantation 65: 876–883, 1998 [DOI] [PubMed] [Google Scholar]
- 33.Vella JP, Magee C, Vos L, Womer K, Rennke H, Carpenter CB, Hancock W, Sayegh MH: Cellular and humoral mechanisms of vascularized allograft rejection induced by indirect recognition of donor MHC allopeptides. Transplantation 67: 1523–1532, 1999 [DOI] [PubMed] [Google Scholar]
- 34.Hancock WH, Whitley WD, Tullius SG, Heemann UW, Wasowska B, Baldwin WM, 3rd, Tilney NL: Cytokines, adhesion molecules, and the pathogenesis of chronic rejection of rat renal allografts. Transplantation 56: 643–650, 1993 [DOI] [PubMed] [Google Scholar]
- 35.Chomczynski P, Sacchi N: Single-step method of RNA isolation by acid guanidinium thiocyanate-phenol-chloroform extraction. Anal Biochem 162: 156–159, 1987 [DOI] [PubMed] [Google Scholar]