

Abstract
Heterochrony, the relative change of developmental timing, is one of the major modes of macroevolutionary change; it identifies temporally disassociated units of developmental evolution. Here, we report the results of a fine-scale temporal study for the expression of the developmental gene hairy and morphological development in three species of Drosophila, D. melanogaster, D. simulans, and D. pseudoobscura. The results suggest that between and among closely related species, temporal displacement of ontogenetic trajectory is detected even at the earliest stage of development. Overall, D. simulans shows the earliest expression, followed by D. melanogaster, and then by D. pseudoobscura. Setting D. melanogaster as the standard, we find the approximate time to full expression is accelerated by 13 min, 48 s in D. simulans and retarded by 24 min in D. pseudoobscura. Morphologically, again with D. melanogaster setting the standard, initiation of cellularization is faster in D. simulans by 15 min, 42 s; and initiation of morphogenesis is faster in D. simulans by 18 min, 7 s. These results seem to be consistent with the finding that the approximate time to full expression of hairy is accelerated by 13 min, 48 s in D. simulans. On the other hand, the same morphological events are delayed by 5 min, 32 s, and by 11 min, 32 s, respectively, in D. pseudoobscura. These delays are small, compared with the 24-min delay in full expression. The timing changes, in total, seem consistent with continuous phyletic evolution of temporal trajectories. Finally, we speculate that epigenetic interactions of hairy expression timing and cell-cycle timing may have led to morphological differences in the terminal system of the larvae.
Traditionally, evolutionary biology has delineated two types of processes in organismal evolution (1). The first is microevolution, the process of within-species change of the genetic composition of a given population (i.e., gene frequency change); and the second is macroevolution, the accumulation of microevolutionary changes that lead to fixed differences between different species of organisms (i.e., diversification). Although the process of microevolution has been well defined and extensively studied, the process of macroevolutionary change has been far less studied. Gould (2) has recognized two major modes of macroevolutionary change: innovation, or the appearance of new characters, and heterochrony, the shifts in the timing of the characters in ontogenetic development. Such heterochronic shifts can lead to lineages with truncated development, in which juveniles reach sexual maturity, or larval characters are retained in adults (e.g., the classic case of Plethodon ocellatum; see ref. 3).
The concept of heterochrony is important; it unifies in a process model the diversity of developmental phenomena. With the explosion of knowledge from developmental biology, recent authors have reiterated the importance of studying heterochrony (e.g., see refs. 4–6). In fact, many studies (7–12) currently emphasize and use heterochrony to describe patterns of molecular development, and other studies show that, even among closely related species, a great many differences are observed in gene expression (13, 14). Furthermore, such changes in developmental timing are likely to be found in the early as well as the later stages of development (15). The detection or the description of heterochrony also suggests that the temporal trajectories of those characters or genes are disassociated from the temporal trajectories of other ontogenetic processes (15). Therefore, the measurement of heterochrony also identifies “units” of developmental evolution.
Although the concept of heterochrony has been used to describe changes in the developmental program, there has been little attempt to study the process of heterochrony, that is, what kinds of genetic changes and selective processes lead to heterochronic development. The first requirement is the characterization of heterochronic changes at the molecular level (as emphasized in ref. 6). For example, Patel et al. (16) suggest that the changes in the germ type of coleopteran species is related to heterochronic changes in the expression of the patterning genes relative to the early morphological development genes. Second, the study of the process of heterochrony requires temporally fine-scaled observations within closely related species. Comparisons at large scales, e.g., across phyla, and through coarse sampling of time periods will emphasize and reveal only punctuated patterns of differences that cannot be used to infer processes. The tempo and mode of developmental timing changes will be apparent only when we obtain data at fine-scale levels. In this paper, we report the results of such a fine-scale temporal study for the developmental gene hairy in Drosophila.
The hairy gene belongs to the pair-rule class within the hierarchy of early developmental genes, and its expression pattern follows the pair-rule spatial pattern: seven periodic bands of expression along the anterior-posterior axis (17). It is one of several pair-rule loci whose expression is directly regulated by upstream gap proteins, including hunchback, Krüppel, giant, knirps, and other as-yet-unidentified factors (18–20). Also, unlike other pair-rule genes, hairy does not seem to be autoregulated (21). The periodic stripes of hairy expression provide the first indication of the segmented body plan, and they establish the prepattern for further regulation of downstream genes. The sequence structure of hairy in D. melanogaster has been determined by Rushlow et al. (22); the gene encodes a 337-aa protein that functions both in the embryo segmentation body plan and in the adult bristle patterning. The major transcript is coded by three exons that are spaced by two introns, 1020-bp and 136-bp long, in D. melanogaster. The hairy-encoded protein includes a basic helix–loop–helix domain that shows similarity to the N-myc protooncogene (23). Evidence suggests that hairy directly regulates the expression of the secondary pair-rule gene fushi tarazu by repression and that it interacts with other pair-rule genes (24).
Our strategy in this project was to use finely timed, whole-mount in situ hybridization to assay the temporal trajectory of hairy gene expression in three different species of Drosophila, D. melanogaster, D. simulans, and D. pseudoobscura. In addition, we obtained comparative timing data on morphological development with the use of microscopy of living embryos. Here we report two different kinds of timing changes among Drosophila species. The first is the change, under controlled conditions, in hairy expression timing with respect to absolute time. The absolute timing differences indicate changes at the biochemical and gene-regulation level, but not disassociation of developmental units. The second is heterochrony in the classic sense, the relative changes in hairy gene expression with respect to cell-cycle-dependent morphological development. The results shown below suggest that, even at the earliest stage of development, temporal displacement of ontogenetic trajectory between sister species is detected at the molecular level.
Materials and Methods
In Situ Hybridization.
Species-specific probes were generated from PCR-cloned genomic hairy sequences. Fragments, approximately 200 bp long, were generated from the 5′ end of the second exon (near the basic helix–loop–helix region of hairy) by using PCR synthesis and digoxigenin-labeled dUTP (Boehringer Mannheim). Spatial expression patterns of hairy were detected by whole-mount in situ hybridizations with a protocol adopted from Tautz et al. (25). Specifically, the fixation time and treatment with proteinase K were varied for each species and egg batch (based on morphological examination). In particular, we found that maintaining a constant 25°C between hybridization reactions was critical for reproducible results. All hybridization assays were done in small batches, and the results were collected for distinct and cleanly hybridized batches only. The classification of the expression stages of the embryos was carried out under a dissecting microscope with a pulled pipette for micromanipulation.
Timed Egg Collection.
The embryos (at 25°C) were collected in small batches for a 30-min period after the initial evacuation of predeveloped eggs to ensure quasi-synchronization (initial collection was for 1 hr; those were discarded, and the discarding procedure was repeated once). The collection medium was Instant Drosophila Blue Media with grape juice and yeast (Carolina Biological). These embryos were incubated at 25°C for a fixed period (see Results for the durations), dechorionated with 3% sodium hypochlorite (we found that 1 min, 45 s was optimal), washed with Ringer's solution, and fixed in paraformaldehyde according to the method described by Tautz et al. (25). Storage of fixed embryos in 100% methanol at 4°C for up to 3 months did not affect our ability to detect gene expression.
Morphological Development.
Embryos were collected in a quasi-synchronized state as described above; they were dechorionated by hand, and were mounted alive in halocarbon oil (Sigma), and supplied with oxygen through gas-permeable tubing as described (26). Briefly, the embryos were attached to a cover glass with egg glue (a small piece of cellophane tape, dissolved in heptane), such that any egg placed on the glass would not float. Eggs were placed single-file and as close as possible to the oxygen supply (we found that the distance from the oxygen supply line introduces variance in some species). The cover glass was mounted on an aluminum slide with vacuum grease. Gas-permeable tubing was placed around the mounted eggs to supply oxygen. The eggs were covered with halocarbon oil (weight 30 and 700 in a 1:1 mixture; Sigma), and a second cover glass was placed over the arrangement. The entire microscope chamber was temperature regulated at 25°C. Oxygen was supplied from a gas bottle at defined flow rates, measured by counting the number of air bubbles formed in a back-pressure, fixed-volume water bottle. The morphological stages were identified by using the classification scheme of Campos-Ortega and Hartenstein (27). In our data, we have used three clearly distinct landmarks, stages 3, 5, and 6.
Results
In Situ Hybridizations.
As described above, the embryos collected in each time period were hybridized in situ in small batches. Table 1 shows the number of embryos assayed for each species and each time period. The in situ hybridized embryos are classified as stage 1, no expression; stage 2, partial expression (just before the separation of stripes 3 and 4); stage 3, full expression; and stage 4, morphogenesis (Fig. 1). The total number of embryos assayed in each period varied considerably for two reasons: (i) we discarded any batch of in situ hybridizations that did not yield morphologically clean results; and (ii) we over-sampled certain critical periods. Table 1 shows the raw data and Fig. 2 shows the average stage for each species, plotted as a function of time.
Table 1.
Results from in situ hybridization of hairy probe to three species of Drosophila
| Species | Interval, hr | Proportion
|
Sample size | Total | |||
|---|---|---|---|---|---|---|---|
| Stage 1 | Stage 2 | Stage 3 | Stage 4 | ||||
| Mel | 2.5–3.0 | 0.778 | 0.050 | 0.040 | 0.131 | 125 | 125 |
| Mel | 3.0–3.5 | 0.133 | 0.133 | 0.553 | 0.181 | 67, 49, 143 | 259 |
| Mel | 3.5–4.0 | 0.153 | 0.019 | 0.230 | 0.598 | 70, 54, 65, 75 | 264 |
| Sim | 1.5–2.0 | 0.787 | 0.066 | 0.131 | 0.016 | 65, 116 | 181 |
| Sim | 2.0–2.5 | 0.773 | 0.114 | 0.045 | 0.068 | 46 | 46 |
| Sim | 2.5–3.0 | 0.558 | 0.165 | 0.234 | 0.043 | 122, 102, 120, 89, 90, 31, 104 | 658 |
| Sim | 3.0–3.5 | 0.038 | 0.031 | 0.436 | 0.495 | 86, 75, 94, 55, 114, 141 | 565 |
| Sim | 3.5–4.0 | 0.000 | 0.005 | 0.039 | 0.956 | 203 | 203 |
| Pse | 2.0–2.5 | 0.992 | 0.000 | 0.000 | 0.008 | 125 | 125 |
| Pse | 2.5–3.0 | 0.866 | 0.040 | 0.075 | 0.019 | 99, 100, 134 | 333 |
| Pse | 3.0–3.5 | 0.801 | 0.106 | 0.031 | 0.062 | 107, 105, 121 | 333 |
| Pse | 3.5–4.0 | 0.063 | 0.003 | 0.766 | 0.167 | 116, 52, 121, 174, 113, 73 | 649 |
| Pse | 4.0–4.5 | 0.037 | 0.000 | 0.117 | 0.846 | 126, 77, 95, 81, 139 | 518 |
Numbers indicate relative proportions. “Sample size” lists each batch of in situ hybridizations. “Total” column sums the samples. All numbers reflect measurements after removal of outliers from upper and lowr 10% of samples. Mel, D. melanogaster, Sims, D. simulans, and Pse, D. pseudoobscura. Intervals are hours since egg deposition was measured at 25°C. Stage 1, no expression; stage 2, partial expression; stage 3, full expression; stage 4, morphogenesis.
Figure 1.

Four stages are identified for hairy expression in Drosophila. Stage 1 (no expression) is not shown. (A) Beginning of stage 2; hairy expression starts as a broad midband expression on the ventral side. (B) Stage 2, typical partial expression. (C) Stage 3, full expression, marked by the separation of the third and fourth stripes. (D) Stage 4, morphogenesis; formation of the cephalic furrow is indicated by the arrowhead.
Figure 2.

The expression stage (averaged) of hairy, plotted against the period (hr) since egg deposition. (See Fig. 1 and the text for definition of the stages. Average stages for three species are plotted. ×, D. melanogaster; □, D. simulans; and ▵, D. pseudoobscura. Broken lines indicate 95% confidence interval.
All of the data presented here are from counts taken after discarding the higher and lower 10% of the outliers in each time period; outliers can result either from dead embryos or from predeveloped embryos that might be present despite our attempts to evacuate such embryos. The broken lines show 95% confidence intervals for the average stages (computed from a binomial distribution). Overall, as can be seen in Fig. 2, D. simulans shows the earliest expression on an absolute time scale, followed by D. melanogaster, and then by D. pseudoobscura. By using inverse interpolation for stage 3, full expression, we found the approximate time to full expression to be 3.12 hr, 3.35 hr, and 3.75 hr for D. simulans, D. melanogaster, and D. pseudoobscura, respectively. Using D. melanogaster as the standard, we found the approximate time (on an absolute time scale) to full expression was accelerated by 13 min 48 s in D. simulans, and retarded by 24 min in D. pseudoobscura.
By the criterion suggested in Rice (28), the shift in expression trajectory between D. simulans and D. pseudoobscura cannot quite be described in classic terms (e.g., see ref. 2), because the trajectory has changed by more than a linear transformation. [Although Klingenberg (29) suggests that this view is too restrictive.] In Fig. 3 the average stage of D. simulans is plotted against that of D. pseudoobscura. If the temporal shift is a linear transformation of either measurement, the plotted points should be approximately linear (28). In particular, there is an outlier in time interval 3.0–3.5 hr (indicated by an arrow in Fig. 3) in D. pseudoobscura that greatly deviates from the linear in the direction of delayed expression. We are unable to do a comparable analysis against D. melanogaster because of the lack of data points in the earlier time intervals; however, within the measured data points, the temporal shift is consistent with a simple translation, compared with the trajectory in D. simulans.
Figure 3.

The average expression stage of hairy for D. simulans is plotted against that of D. pseudoobscura. In “restricted” classical heterochrony (see text), the points are expected to fall on a line. The plot deviates from a linear relationship especially at the point (indicated by arrow) that shows marked acceleration of expression in D. simulans compared with that in D. pseudoobscura. Numbers indicate the observational time intervals in hours (see Fig. 2).
Further examination of the raw data confirms the unusual shift of the temporal trajectory in D. pseudoobscura. In D. simulans, we find a significant proportion (>10%) of embryos with intermediate expression (stage 2) in two time intervals (2.0–2.5 and 2.5–3.0 hr), whereas in D. pseudoobscura, significant proportions of stage 2 embryos are found in only one time interval (3.0–3.5 hr) (Table 1), which suggests that full expression (seven stripes) develops more rapidly in D. pseudoobscura than in D. simulans. Finally, we can measure the total divergence of the temporal trajectory in the three species by the mean square difference in the average stage in each time interval. The differences are 0.205, 1.158, and 1.150 for D. melanogaster vs. D. simulans, D. melanogaster vs. D. pseudoobscura, and D. simulans vs. D. pseudoobscura, respectively. Although it is difficult to say with just three species, the total amount of divergence of the temporal trajectory is consistent with the order of the putative phylogenetic distances of the three species and the ultrametric (clock-like) relationships.
Morphological Observations.
Our observations of morphological development through vital photomicrography are shown in Table 2. We have concentrated on three landmarks, polar bud formation, initiation of cellularization, and initiation of morphogenesis (cephalic furrow formation), because these events show the most discrete and distinct timing. Polar bud formation, initiation of cellularization, and initiation of morphogenesis correspond to stages 3, 5, and 6b, respectively, as described by Campos-Ortega and Hartenstein (27). In Table 2, we use the polar bud formation as the zero-time point and show the average time (SE in parentheses) to the two subsequent landmarks. The timing shown for these two latter events in D. melanogaster is consistent with that reported previously (27, 30).
Table 2.
Timing of morphological development, measured through vital photomicrography
| Species | Hours since time 0
|
Observations | |
|---|---|---|---|
| Initiation of cellularization | Initiation of morphogenesis | ||
| D. melanogaster | 1:02:05 (±0:00:52) | 1:54:35 (±0:01:03) | 21 |
| D. simulans | 0:46:23 (±0:00:56) | 1:35:58 (±0:00:48) | 29 |
| D. pseudoobscura | 1:07:37 (±0:00:46) | 2:06:07 (±0:00:23) | 81 |
Polar bud formation is time zero. Hours indicate initiation of cellularization and initiation of cephalic furrow (morphogenesis).
Again, with D. melanogaster as the standard, the initiation of cellularization and the initiation of morphogenesis are approximately 15 min, 42 s, and 18 min, 37 s, respectively, faster in D. simulans, which seems to be consistent with the finding that the approximate time to full expression of hairy is accelerated by 13 min, 48 s in D. simulans. The same morphological events, however, are delayed by 5 min, 32 s and 11 min, 32 s in D. pseudoobscura, rather small delays compared with the delay by 24 min in full expression. Therefore, whereas the earlier onset of hairy expression in D. simulans compared with D. melanogaster might be explained by the general acceleration of the developmental process, the retardation of hairy expression in D. pseudoobscura seems to be independent of the processes that govern cell cycles and morphogenesis.
Discussion
Heterochrony has been most widely studied in terms of morphological evolution, especially with respect to terminal characters (for recent examples, see refs. 31–35). However, Raff (15) has pointed out that heterochrony can be found in earlier as well as in later stages of development. Indeed, changes in developmental timing in the early stages of ontogeny has been described in many studies (6, 36–39). Furthermore, Richardson et al. (40) argue that previous notions of phylotypic stages are based on an incomplete analysis of comparative data, and they suggest that there are no particularly conserved stages of development. In our study, we show that statistically significant developmental timing changes can be detected in the earliest part of the ontogenetic trajectory; hairy is one of the first zygotically expressed genes. Klingenberg (29) notes that modern developmental biology resurrects Haeckel's original meaning of heterochrony (reversals in the order of appearance), compared with the speeding-up or the slowing-down of a particular trajectory. We note that our measurement of heterochrony is a quantitative measurement of the temporal trajectory at the molecular level; it is not merely a measurement of the qualitative sequence of gene expression.
Is there a functional significance to the changes in the temporal trajectory of hairy gene expression? In our measurements, we found another change in the expression pattern (heterotropy in the expanded sense; see ref. 41) in addition to the changes in relative timing. In both D. melanogaster and D. simulans, partial expression of an eighth stripe can be observed in the late stages of gene expression (Fig. 4). This partial expression was also noted by Yu and Pick (42). Despite our extensive sampling in the late stages (Table 1), we failed to detect any eighth stripe expression in D. pseudoobscura. We are currently uncertain whether the failure of eighth stripe expression has any further morphological consequences. However, cuticle preparations of the first-instar larvae seem to suggest that the anal pads of D. pseudoobscura larvae are enlarged, compared with those of D. melanogaster, which is consistent with observations that suggest anal pads as the default fate of this region (43). Therefore, the partial expression of pair-rule genes may impart a segmental identity to the terminal system, resulting in reduced anal pads in D. melanogaster and D. simulans. However, the data are cursory, and further verification is needed.
Figure 4.
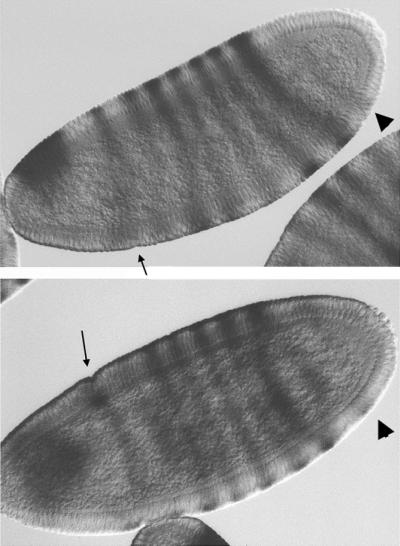
The presence of a partially expressed eighth hairy stripe in D. simulans (arrowhead) occurs only after the appearance of the cephalic furrow (small arrow).
We also suggest that the absence of eighth stripe expression in D. pseudoobscura is consistent with changes in the timing of the expression trajectory. Drosophila starts out as a syncytial embryo, with no cell walls separating the nuclei. Cell walls initiate at stage 5, and complete at stage 6 (between the 13th and 14th cell division). The completion of cellularization coincides closely with the last expression stages of hairy. As we noted above, hairy expression in D. pseudoobscura is ≈24 min delayed, compared with D. melanogaster, whereas the completion of cellularization is delayed only ≈11 min. Therefore, we postulate that the eighth stripe is not expressed in D. pseudoobscura because the process is interrupted by the completion of the cell wall, which may inhibit the gradient-dependent combinatorial regulation of pair-rule genes (21, 44). Similar epigenetic interactions of temporal processes have been suggested as diversifying mechanisms in other studies (45, 46). We currently do not know the molecular mechanism by which the temporal expression of hairy is controlled. Jost (47) has reported that the Drosophila hydei fushi-tarazu gene injected into D. melanogaster expresses according to D. melanogaster timing. However, it is unknown whether the regulatory elements respond differently in an inter-specific environment. Our preliminary data (unpublished material) suggest that stripe-controlling elements of hairy have diverged significantly in D. pseudoobscura, compared with the levels of divergence seen between D. melanogaster and Drosophila virilis. However, further data are needed for causal verification.
In summary, we report heterochronic change in the expression trajectory of a developmental gene in the earliest stage of development. The degree of change seems to be consistent with continuous phyletic evolution of temporal trajectories. We speculate that epigenetic interactions of hairy expression timing and cell-cycle timing may have led to morphological differences in the terminal system of the larvae. These results suggest to us that epigenetic interactions of temporal trajectories between molecular cascades can be an important diversifying mechanism at the macroevolutionary level.
Acknowledgments
We thank Patricia Liljelund and Kavita Nayar for their initial work in the cloning of hairy from different species of Drosophila. We also thank J. Powell for helpful comments. This work was supported in part by a Sloan Foundation Young Investigator Award to J.K.
References
- 1.Futuyma D J. Evolutionary Biology. Sunderland, MA: Sinauer; 1986. [Google Scholar]
- 2.Gould S J. Ontogeny and Phylogeny. Cambridge, MA: Harvard Univ. Press; 1977. [Google Scholar]
- 3.de Beer G R. Embryology and Ancestors. Oxford, U.K.: Clarendon; 1930. [Google Scholar]
- 4.Gould S J. BioEssays. 1992;14:275–279. doi: 10.1002/bies.950140413. [DOI] [PubMed] [Google Scholar]
- 5.Slack J M W, Holland P W H, Graham C F. Nature (London) 1993;361:490–492. doi: 10.1038/361490a0. [DOI] [PubMed] [Google Scholar]
- 6.Richardson M K. Dev Biol. 1995;172:412–421. doi: 10.1006/dbio.1995.8041. [DOI] [PubMed] [Google Scholar]
- 7.Evans M M S, Passas H J, Poethig R S. Development (Cambridge, UK) 1994;120:1971–1981. doi: 10.1242/dev.120.7.1971. [DOI] [PubMed] [Google Scholar]
- 8.Patel N H. Science. 1994;266:581–590. doi: 10.1126/science.7939712. [DOI] [PubMed] [Google Scholar]
- 9.Swalla B J, White M E, Zhou J, Jeffery W R. Dev Genet (Amsterdam) 1994;15:51–63. doi: 10.1002/dvg.1020150107. [DOI] [PubMed] [Google Scholar]
- 10.Wiltshire R J E, Murfet I C, Reid J B. J Evol Biol. 1994;7:447–465. [Google Scholar]
- 11.Zakany J, Gerard M, Favier B, Duboule D. EMBO J. 1997;16:4393–4402. doi: 10.1093/emboj/16.14.4393. [DOI] [PMC free article] [PubMed] [Google Scholar]
- 12.Slack F, Ruvkun G. Annu Rev Genet. 1997;31:611–634. doi: 10.1146/annurev.genet.31.1.611. [DOI] [PubMed] [Google Scholar]
- 13.Dickinson W J. J Mol Evol. 1980;16:73–94. doi: 10.1007/BF01731579. [DOI] [PubMed] [Google Scholar]
- 14.Espifanio J M, Philipp D P. Dev Genet (Amsterdam) 1994;15:119–128. [Google Scholar]
- 15.Raff R A. The Shape of Life: Genes, Development, and the Evolution of Animal Form. Chicago: Univ. of Chicago Press; 1996. [Google Scholar]
- 16.Patel N H, Condron B G, Zinn K. Nature (London) 1994;367:429–434. doi: 10.1038/367429a0. [DOI] [PubMed] [Google Scholar]
- 17.Ingham P W, Howard K R, Ish-Horowicz D. Genes Dev. 1985;2:1037–1046. doi: 10.1101/gad.2.8.1037. [DOI] [PubMed] [Google Scholar]
- 18.Ingham P W, Ish-Horowicz D, Howard K R. EMBO J. 1986;5:1527–1537. doi: 10.1002/j.1460-2075.1986.tb04409.x. [DOI] [PMC free article] [PubMed] [Google Scholar]
- 19.Hooper K, Parkhurst S, Ish-Horowicz D. Development. 1989;107:489–504. doi: 10.1242/dev.107.3.489. [DOI] [PubMed] [Google Scholar]
- 20.Langeland J A, Carroll S B. Development. 1994;117:585–596. doi: 10.1242/dev.117.2.585. [DOI] [PubMed] [Google Scholar]
- 21.Carroll S B. Cell. 1990;60:9–16. doi: 10.1016/0092-8674(90)90711-m. [DOI] [PubMed] [Google Scholar]
- 22.Rushlow C A, Hogan A, Pinchin S M, Howe K M, Lardelli M, Ish-Horowicz D. EMBO J. 1989;8:3095–3103. doi: 10.1002/j.1460-2075.1989.tb08461.x. [DOI] [PMC free article] [PubMed] [Google Scholar]
- 23.Wainwright S M, Ish-Horowicz D. Mol Cell Biol. 1992;12:2475–2483. doi: 10.1128/mcb.12.6.2475. [DOI] [PMC free article] [PubMed] [Google Scholar]
- 24.Carroll S B, Scott M P. Cell. 1986;45:113–126. doi: 10.1016/0092-8674(86)90543-x. [DOI] [PubMed] [Google Scholar]
- 25.Tautz D, Hulskamp M, Sommer R J. In: In Situ Hybridization: A Practical Approach. Wilkinson D G, editor. New York: Oxford Univ. Press; 1992. pp. 61–73. [Google Scholar]
- 26.Kiehart D P, Montague R A, Rickoll W L, Foard D, Thomas G H. In: Drosophila melanogaster: Practical Uses in Cell and Molecular Biology. Goldstein L S B, Fryberg E A, editors. New York: Academic; 1994. pp. 507–532. [Google Scholar]
- 27.Campos-Ortega J A, Hartenstein V. The Embryonic Development of Drosophila melanogaster. New York: Springer; 1985. [Google Scholar]
- 28.Rice S H. Proc Natl Acad Sci USA. 1997;94:907–912. doi: 10.1073/pnas.94.3.907. [DOI] [PMC free article] [PubMed] [Google Scholar]
- 29.Klingenberg C P. Biol Rev Camb Philos Soc. 1998;73:79–123. doi: 10.1017/s000632319800512x. [DOI] [PubMed] [Google Scholar]
- 30.Bownes M. J Embryol Exp Morphol. 1975;33:789–801. [PubMed] [Google Scholar]
- 31.Strathmann R R, Fenaux L, Strathmann M F. Evolution. 1992;46:972–986. doi: 10.1111/j.1558-5646.1992.tb00613.x. [DOI] [PubMed] [Google Scholar]
- 32.Reilly S M, Altig R. Copeia. 1996;296:29–41. [Google Scholar]
- 33.Fiorello C V, German R Z. Evolution. 1997;51:250–261. doi: 10.1111/j.1558-5646.1997.tb02406.x. [DOI] [PubMed] [Google Scholar]
- 34.Villani P J, Demason D A. Am J Bot. 1997;84:1323–1336. [PubMed] [Google Scholar]
- 35.Schmidt A, Wake M H. J Morphol. 1998;236:233–246. doi: 10.1002/(SICI)1097-4687(199806)236:3<233::AID-JMOR6>3.0.CO;2-3. [DOI] [PubMed] [Google Scholar]
- 36.Wray G, McClay D R. Evolution. 1989;43:803–813. doi: 10.1111/j.1558-5646.1989.tb05178.x. [DOI] [PubMed] [Google Scholar]
- 37.Collazo A. Evolution. 1994;48:2037–2045. doi: 10.1111/j.1558-5646.1994.tb02231.x. [DOI] [PubMed] [Google Scholar]
- 38.Duboule D. Development Suppl. (Cambridge, U.K.) 1994. 135–142. [Google Scholar]
- 39.Wray G A. In: Evolutionary Change and Heterochrony. McNamara K J, editor. New York: Wiley; 1995. pp. 197–223. [Google Scholar]
- 40.Richardson M K, Hanken J, Gooneratne M L, Pieau C, Raynaud A, Selwood L, Wright G M. Anat Embryol. 1997;196:91–106. doi: 10.1007/s004290050082. [DOI] [PubMed] [Google Scholar]
- 41.Zelditch M L, Fink W L. Paleobiology. 1996;22:241–254. [Google Scholar]
- 42.Yu Y, Pick L. Mech Dev. 1995;50:163–175. doi: 10.1016/0925-4773(94)00333-i. [DOI] [PubMed] [Google Scholar]
- 43.Jurgens G, Hartenstein V. In: The Development of Drosophila melanogaster. Bate M, Martinez-Arias A, editors. Plainview, NY: Cold Spring Harbor Lab. Press; 1993. pp. 687–701. [Google Scholar]
- 44.Lehmann R. Development Suppl. (Cambridge, U.K.) 1988. pp. 17–27. [Google Scholar]
- 45.Dolle P, Dierich A, Lemeur M, Schimmang T, Schuhbaur B, Chambon P, Duboule D. Cell. 1993;75:431–441. doi: 10.1016/0092-8674(93)90378-4. [DOI] [PubMed] [Google Scholar]
- 46.Blanco M J, Misof B Y, Wagner G P. Dev Genes Evol. 1998;208:175–187. doi: 10.1007/s004270050172. [DOI] [PubMed] [Google Scholar]
- 47.Jost W, Yu Y, Pick L, Preiss A, Maier D. Roux's Arch Dev Biol. 1995;205:160–170. doi: 10.1007/BF00357762. [DOI] [PubMed] [Google Scholar]