

Abstract
Nonsense SNPs introduce premature termination codons into genes and can result in the absence of a gene product or in a truncated and potentially harmful protein, so they are often considered disadvantageous and are associated with disease susceptibility. As such, we might expect the disrupted allele to be rare and, in healthy people, observed only in a heterozygous state. However, some, like those in the CASP12 and ACTN3 genes, are known to be present at high frequencies and to occur often in a homozygous state and seem to have been advantageous in recent human evolution. To evaluate the selective forces acting on nonsense SNPs as a class, we have carried out a large-scale experimental survey of nonsense SNPs in the human genome by genotyping 805 of them (plus control synonymous SNPs) in 1,151 individuals from 56 worldwide populations. We identified 169 genes containing nonsense SNPs that were variable in our samples, of which 99 were found with both copies inactivated in at least one individual. We found that the sampled humans differ on average by 24 genes (out of about 20,000) because of these nonsense SNPs alone. As might be expected, nonsense SNPs as a class were found to be slightly disadvantageous over evolutionary timescales, but a few nevertheless showed signs of being possibly advantageous, as indicated by unusually high levels of population differentiation, long haplotypes, and/or high frequencies of derived alleles. This study underlines the extent of variation in gene content within humans and emphasizes the importance of understanding this type of variation.
Introduction
The theory that gene duplication is a major factor in shaping evolution was proposed many years ago by Susumu Ohno1 and is now widely accepted. The idea that gene loss can also contribute significantly to evolution is, however, a newer one and was proposed by Maynard Olson.2 Common sense may lead us to consider gene loss as a bad thing and to associate adaptation with genes that are somehow “better.” However, as the thrifty gene theory3 proposed, some genes that were advantageous in the past may have become a burden in modern times.
One molecular mechanism for gene loss is the introduction of a premature termination codon (PTC). This can result from a nonsense mutation, a frame-shifting indel or a splice-site mutation with the skipping of a single exon containing a number of nucleotides that cannot be divided by three (reviewed in Cartegni et al.4). A PTC could result in a shorter protein, but truncated proteins are likely to be deleterious and are usually eliminated by a process called nonsense-mediated mRNA decay (NMD).5,6 If the NMD pathway is triggered, it will eliminate the production of the protein, and the gene product will be completely lost. However, if the PTC is located either in the last exon or less than 50–55 nucleotides upstream of the last exon-exon boundary, NMD can be evaded, resulting in the production of a truncated protein.5,7
A gene-loss event begins with a mutation within a single individual, and if the disrupted allele (hereafter referred to as the “stop allele,” as opposed to the nondisrupted “normal allele”) is neutral, it can either increase or decrease its frequency in a population by the random effects of genetic drift. However, if the stop allele turns out to be harmful to its carrier, it will tend to be eliminated by the forces of negative selection, whereas should it be advantageous, positive selection will act to increase its frequency. Although nonsense SNPs are common causes of genetic disease,8 the stop alleles in the CASP129 (MIM ∗608633) and ACTN310 (MIM +102574) genes are found at high frequencies, are often in a homozygous state, and seem to have been advantageous in recent human evolution. Carriers of the stop allele in CASP12 are more resistant to severe sepsis11, and the stop allele in ACTN3 has been associated with increased endurance in athletic performance.12,13
Recent studies14,15 have provided us with important insights into the number, location within the protein, and predicted effects of nonsense SNPs in silico by using publicly available data from the dbSNP database. We have now extended these investigations to test the less-is-more hypothesis2 by evaluating the evolutionary forces acting on nonsense SNPs as a class, genotyping 805 such SNPs in 56 worldwide populations, and resequencing a gene containing one example and its surrounding region. Our aim was to identify outliers that could potentially reveal additional contributions of gene loss to the evolution of our species.
Material and Methods
DNA Samples
DNA samples were obtained from the HapMap and extended HapMap populations16,17 and the human genome diversity cell line panel (HGDP-CEPH),18 from which the H104819 subset was used. The samples successfully genotyped were derived from 1,151 individuals from 56 geographically diverse populations (Figure S1 available online). The samples sequenced were 22 CEPH Utah residents with ancestry from northern and western Europe (CEU), 23 Yoruba in Ibadan, Nigeria (YRI), 23 Han Chinese in Beijing (CHB), and 23 Luhya in Webuye, Kenya (LWK).16 In addition, one chimpanzee (Pan troglodytes) sample was included as an outgroup. All HapMap samples were purchased from the Coriell Institute for Medical Research (Camden, New Jersey, USA); the HGDP-CEPH collection18 was kindly provided by Howard Cann (CEPH, Paris, France), and the chimpanzee sample was purchased from the ECACC (Salisbury, Wiltshire, UK).
Data Generation
Genotyping of 1,536 SNPs
Assay designs were attempted for all nonsense SNPs in dbSNP build 121; assays that failed at the design stage and others that passed the design but were known to fail from previous genotyping attempts were excluded, leaving 805 nonsense SNPs to be tested. We analyzed only nonsense SNPs that introduce stop codons (sometimes referred to as “stop gained”) and excluded SNPs causing a stop codon read-through (“stop lost”). Additionally, 731 synonymous SNPs were added to provide a total of 1,536 SNPs, the number required for one bundle of an Illumina BeadArray. The synonymous SNPs were chosen to act as controls: although not perfectly neutral, they nevertheless provide an approximation of neutral variants. We selected these synonymous SNPs to roughly match the sources (submitters) of the nonsense SNPs in order to match SNPs that might have been called on the basis of poor sequencing or discovery in particular populations.
Many investigators have contributed to the discovery of the SNPs in databases by sequencing a limited (and sometimes very small) number of individuals; the sequenced regions were not consistent throughout the genome and were generally not well documented. Interpretation of the SNP genotypes in additional individuals can thus potentially be influenced by the discovery process, an effect known as “ascertainment bias.” We incorporated a number of factors into our study design so that we could reach useful conclusions, despite such bias. First, by starting from the set of all SNPs in the database, we avoided the most extreme forms of ascertainment bias, and below we show examples of nonsense SNPs confined to non-European samples and demonstrate that an overtly Europe-centric bias has been avoided. Second, we compared analyses of nonsense SNPs with source-matched analyses of synonymous SNPs to ensure that the analyses were subject to the same ascertainment bias. Third, we concentrated largely on analyses less influenced by ascertainment bias.
Genotyping was carried out by the Sanger Genotyping Platform Group via the Illumina GoldenGate assay20 with the primers listed in Table S1, and the results were subjected to sequential quality-control filters. Each plate contained three duplicates, and SNPs with more than 33% discrepancies between duplicates were excluded. The Gene Call (GC) score, which gives the confidence of the genotype read (intensity), was then estimated. A very low value is not to be trusted. Genotypes without call, individual genotypes with a GC score less than 0.25, assays with a median GC score lower than 0.3, and assays with less than 80% data were also discarded. Additional manual assessments were also applied. First, we excluded nonsense SNPs that overlapped with Vega21 pseudogenes. We then excluded SNPs if the ancestral state could not be inferred. Lastly, we used the Tblastx tool to search for the ORF of the sequence surrounding SNPs that had “stop lost” listed as a consequence and got rid of those for which the ancestral state (chimpanzee) was found to be the PTC and the derived state (human) was found to be a read through of the protein. The final dataset we used in the analysis consisted of 453 SNPs (169 nonsense and 284 synonymous) that passed the quality controls and were polymorphic in our samples. The genotype of each sample is provided in Table S2 (a tab-delimited .txt file).
Resequencing MAGEE2
Two ∼6.5 kb fragments that cover the whole MAGEE2 gene and an additional ∼5 kb on each side of it were amplified by long-polymerase chain reaction (long-PCR). Primers are listed in Table S1. Reactions (15 μl) contained 1 × High-Fidelity PCR Buffer (Invitrogen, Paisley, UK), 2 mM MgSO4, 200 μM each dNTP, 0.6 U Platinum Taq DNA Polymerase High Fidelity (Invitrogen), 0.4 μM of each primer and 125 ng genomic DNA. A touchdown protocol beginning with 2 min denaturation at 94°C, followed by 15 cycles of 94°C for 30 s, 68°C for 30 s (temperature decreased by 0.5°C each cycle), and 68°C for 6 min, then 20 cycles of 94°C for 30 s, 58°C for 30 s, and 68°C for 6 min, and finishing with extension at 68°C for 7 min was used. Nested PCR products of 500 (±15%) bp overlapping by 240 (±30%) bp were then amplified with the primers in Table S1; each 15 μl PCR contained 0.5 μl of 400× diluted long-PCR products, 0.5 U Platinum Taq (Invitrogen), 1 × buffer (Invitrogen), 1.6 mM MgCl2, 10 pmol of each primer, and 200 μM of each dNTP, and the cycle conditions were 94°C for 15 min, 30 cycles of 94°C for 45 s, 61°C for 45 s, 72°C for 45 s, and finally 72°C for 7 min. Products were sequenced on both strands by the Sanger Large-Scale Sequencing Pipeline with BigDye Sanger sequencing technology and a 3730 xl DNA Analyzer (Applied Biosystems). Potential variable positions were flagged by the Mutation Surveyor v.2.0 software (SoftGenetics, PA, USA) and checked manually. Four blind duplicates were included for quality control and showed complete concordance. The SNP variation identified in MAGEE2 is provided in Table S3 (a tab-delimited .txt file).
Data Analyses
Descriptive Statistics
We used the Table Browser on the UCSC Genome Browser website to retrieve the ancestral allele for ∼98% (445/453) of the SNPs from the “snp126OrthoPanTro2RheMac2” table. The chimpanzee (Pan troglodytes) sequence provided the primary ancestral state, but we accepted sequences from other primates (Macaca mulatta or Lagothrix lagotricha) when the chimpanzee sequence was not available. The derived allele was then defined as the other observed human allele. We then looked manually for the ancestral state of the missing 2% (eight SNPs) by using FASTA sequences and the NCBI Blastn algorithm to find the best hit within a primate reference sequence. We obtained the derived allele frequency by direct allele counting and used a Kolmogorov-Smirnov test to evaluate the difference between the distributions of nonsense and synonymous SNPs.
We found 112 genes bearing nonsense SNPs and coding for a single transcript. The remaining 57 nonsense SNPs were found in genes undergoing alternative splicing and were reported in more than one transcript. For such SNPs we used the transcript showing the largest truncation in subsequent calculations. We estimated the proportion of protein truncation each SNP would cause as the percentage of the ancestral ORF length (100 − (SNP protein position/protein length∗100)). We used the SNP2NMD database22 to assess whether our nonsense SNPs were likely to trigger NMD according to the 50–55-nucleotide rule.5 Approximately 63% (107) of our nonsense SNPs were in SNP2NMD, and for these we set the “NMD distance” (distance between a SNP and the 3′-most exon-exon junction) to be >50 nucleotides for the NMD pathway to be triggered. For the remaining 62 (∼37%) SNPs missing from SNP2NMD, we extracted information on the location of the nonsense SNP with respect to exon-intron boundaries from Ensembl (releases 37 and 43) and calculated the prediction for NMD manually.
We performed a gene ontology (GO)23 term-enrichment analysis on 167 genes containing nonsense SNPs with the DAVID chart analysis tool.24 All available GO terms were used, and all human genes (implemented in DAVID) were defined as the background. p values were calculated with the EASE score, which is a modified conservative adjustment of the one-tailed Fisher's exact test25 and is implemented in DAVID. Terms with values below 0.05 were considered to be enriched.
Statistical Analyses
FST26 was calculated with the R package HIERFSTAT27 via the 37 population division (Figure S1), and differences between the distributions of nonsense and synonymous SNPs were assessed with the Kolmogorov-Smirnov test. For comparison with empirical data, we downloaded a set of 650 K publicly available SNPs genotyped by Stanford University in the HGDP-CEPH populations and calculated their FST values to find out whether our SNPs were significant outliers (i.e., lying above the 95th or 99th percentiles). Heterozygosity, the probability that any two randomly chosen samples from a population are the same, was calculated for each SNP according to Nei.28 To estimate the strength of selection, we calculated the average selection coefficient(s) for each nonsense SNP in our set by using estimates for the number of coding nucleotides in the human genome (6.0 × 10⁷), the average mutation rate (2.5 × 10⁻⁸/nucleotide/generation29), and the fraction of mutations that can create a PTC (∼1/20), together with our estimate for the average number of stop alleles per human diploid genome (46). A selection coefficient close to zero represents neutrality, and the higher the value, the more deleterious the mutation will be. The diploid genomic rate at which nonsense SNPs arise is 7.5 × 10⁻²/individual/generation. On average, a nonsense SNP persists for 46/(7.5 × 10−2) = 613 generations, implying s ∼0.0016.
In order to calculate the relative extended haplotype homozygosity (REHH) statistic30, we used the phased HapMap data (Build36), which included the majority (131 out of 169) of our nonsense SNPs; we then defined each nonsense SNP as a “core” and included 100 kb regions on each side. As controls, we chose 30 ENCODE random regions (∼500 kb each), which we assumed to be neutral; this was a conservative assumption because random regions might have contained selected genes. The REHH test was performed with Sweep, and REHH was calculated with the default setting of a 0.04 marker breakdown from the core SNP. We used DnaSP31 to calculate the summary statistics Tajima's D,32 Fu and Li's D, D∗, F, and F∗,33 Fu's FS34 and Fay and Wu's H.35 We obtained the null distribution from simulations run by using a custom modification of the ms program36 and incorporating the best-fit demographic model for each population,37 and thus departures from neutrality take into account known demographic influences. Haplotypes for the resequenced data were inferred with PHASE 2.1.38,39 Median-joining networks40 were constructed from the inferred haplotypes with Network 4.5 and used for estimating the time to the most recent common ancestor (TMRCA) of a specified set of chromosomes, under the assumption of a time of 6.5 million years ago for the chimpanzee-human split. TMRCA was also estimated with GENETREE.41 GENETREE employs a full maximum-likelihood method that is based on the standard coalescent42 and assumes an infinite-sites mutational model. We estimated theta to be 5.95 by using a model of three populations (African [YRI + LKW], European [CEU], and Asian [CHB]) and performed 100,000 simulations (Ne = 15,700 with chimpanzee-human split 6.5 million years ago). Finally, with this value of theta and the populations connected by the migration rates suggested by the best-fit demographic model,37 we estimated the TMRCA by using ten runs each of ten million simulations and chose the run with the lowest standard deviation, as recommended.41
Results
After genotyping 1,536 SNPs in 1,151 individuals, we identified 167 genes containing 169 nonsense SNPs that were variable in our samples. A full list of the genes is given in Table S4, including a summary of all the results presented here. Two genes, CDKL1 (MIM ∗603441) and FMO2 (MIM ∗603955), were found with two nonsense SNPs each (CDKL1 with rs11570829 and rs7148089; FMO2 with rs2020866 and rs6661174) and might therefore be suspected to be pseudogenes. However, as part of our manual assessment we had excluded all genes that overlapped with the Vega set of pseudogenes21 and because these two genes are not annotated as pseudogenes, they are included in the results.
Genotyping revealed that on average the individuals in our samples carry ∼14 stop/stop homozygous SNPs and ∼18 stop/normal heterozygous SNPs in their genome, a total of ∼46 stop alleles per diploid genome or ∼23 per haploid genome. Furthermore, these individuals were found to differ on average by 24 genes per diploid genome because of nonsense SNPs. Because the polymorphic nonsense SNPs analyzed here are only a fraction of the nonsense SNPs reported in the human genome (Figure 1), and because these in turn are only a fraction of all nonsense SNPs (but also contain some false positive calls), these estimates are lower bounds, and the actual average difference is likely to be higher. However, because the distribution of our nonsense SNPs appears random in the human genome, they can be considered to represent nonsense SNPs as a class in the following analyses.
Figure 1.
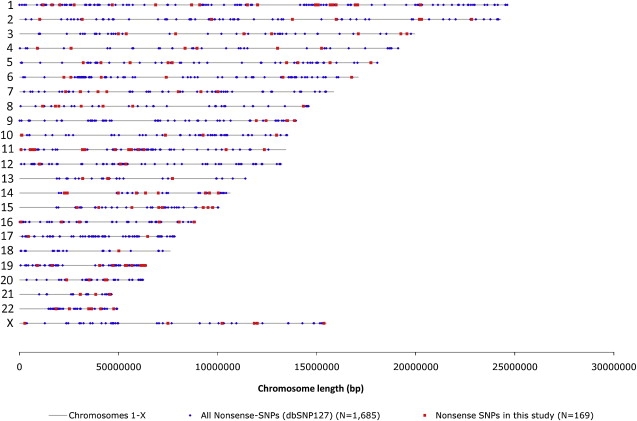
Genome-wide Distribution of Nonsense SNPs on Chromosomes 1 to X in the Human Genome
The nonsense SNPs that were variable in our samples are displayed in red, and all nonsense SNPs reported in the human genome (dbSNP127) are shown in blue.
The Consequences of Nonsense SNPs
Next, we wished to understand the effects these 169 nonsense SNPs might be having on the gene product and the carrier. At the molecular level, the stop allele could result in a truncated protein or in the complete loss of the gene product if NMD is triggered. We found that the truncations were distributed evenly throughout the polypeptide length (Figure 2). Forty-nine percent of the nonsense SNPs lead to the deletion of >50% of the amino acid sequence, an extensive truncation that might radically alter the protein structure and function. In addition, 55% of nonsense SNPs were predicted to cause transcript degradation by NMD (in at least one transcript), which would result in loss of the gene function, and the rest of the nonsense SNPs (45%) are expected to result in the production of a truncated protein (Figure 2). Either way, most of these nonsense SNPs could be having severe effects on the gene product.
Figure 2.
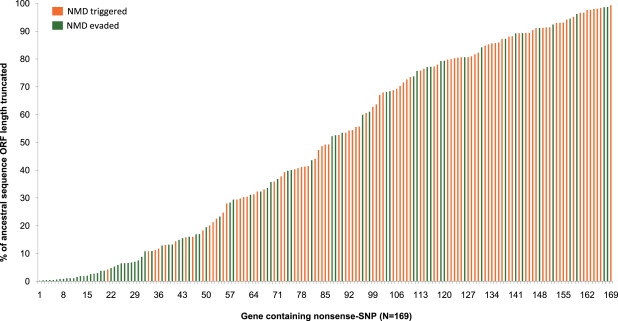
Even Distribution of Truncations
Truncations were calculated as the percentage of the ancestral ORF length. The 169 nonsense SNPs were sorted along the x axis according to the amount of peptide truncation, starting at 1 for the lowest truncation and ending at 169 for the highest truncation. The identifying number of the SNP displayed in the figure can be found in Table S4. Orange labels transcripts where NMD is predicted to be triggered with the complete loss of the gene product, whereas green refers to transcripts where NMD is evaded because the nonsense SNP is located either in the last exon or less than 50 nucleotides upstream of the last exon-exon boundary.
Do these SNPs therefore potentially cause a recessive disorder so that they are found only in the heterozygous state in the HapMap and HGDP-CEPH donors? For 99 nonsense SNPs (59%), at least one stop homozygous sample was found (Figure 3), showing that both copies of these genes could be truncated in our sampled individuals. We do not find unexpectedly high frequencies of heterozygotes: no significant departures from Hardy-Weinberg equilibrium were found in individual populations. In addition, only eight of the 169 nonsense SNPs were found in the Human Gene Mutation Database (HGMD) of mutations associated with human inherited disease.43 For three of these eight SNPs, we did not find individuals homozygous for the stop allele, but for the other five SNPs we did, and for two SNPs (in the NPPA (MIM ∗108780) and FMO2 genes), individuals homozygous for the stop allele were found at a high frequency. It therefore appears that very few of the nonsense SNPs represent low-frequency disease-causing alleles.
Figure 3.
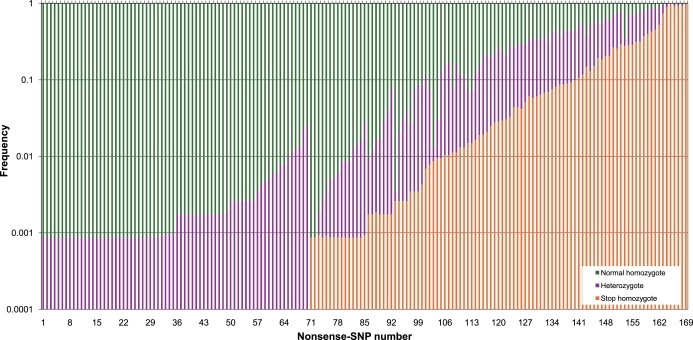
Frequencies of Stop Homozygotes, Normal Homozygotes, and Heterozygotes for Each Variable Nonsense SNP
The genotype frequencies of normal homozygotes (green), heterozygotes (purple), and stop homozygotes (orange) were plotted on a logarithmic scale. The nonsense SNPs were sorted along the x axis according to the frequency of stop homozygotes. The identifying number can be found in Table S4.
Gene-Ontology Enrichment Analysis
To further investigate the functional and physiological consequences of these nonsense SNPs as a class, we used GO information to determine whether there was enrichment of any molecular function or biological process terms in these “lost” genes. The GO analysis revealed an excess of genes involved in olfactory reception and the nervous system (Table S5). The first category was expected to show up because previous studies have indicated that humans have a reduced number of active olfactory receptor genes.44,45 Indeed, a recent study on nonprocessed pseudogenes inactivated in the human lineage reported an overrepresentation of genes involved in chemoreception (to which olfactory receptors belong) and immune response.46 The latter, however, was not observed in our study. Finding an overrepresentation of genes involved in the nervous system was, however, unexpected because such genes have generally been shown to be very conserved.47
Considering the disruptive effects of nonsense SNPs, is it possible that the overrepresentation of certain GO categories largely reflects a higher number of paralogs for genes containing nonsense SNPs? If this were true, it might result from the paralogs' serving as a “backup system” for the disrupted genes and thus reducing the negative selection pressure on them. We noted that 51% of the nonsense SNP genes have at least one paralog, whereas in comparison only 35% of all human genes in Ensembl (release 50) are reported to have a paralog. This difference was found to be moderately significant (Fisher's exact test, p < 0.05), so it is possible that their function is “backed up” by duplicated paralogs in the human genome. However, it has been demonstrated previously, for example with the ACTN3 gene,12 that although a closely related gene can compensate for the function of a lost gene, the gene loss can still have significant physiological consequences.
Selective Forces on Nonsense SNPs
Although the nonsense SNPs investigated here are not overtly associated with disease, we wished to test whether they were, as a class, nevertheless mildly deleterious. Slightly deleterious alleles are subject to weak negative selection and consequently are expected show a different derived allele frequency (DAF) spectrum with an enrichment of rare derived alleles, as shown in a comparison between nonsynonymous and synonymous SNPs.48 We therefore compared the DAF spectrum of the nonsense SNPs with that of synonymous SNPs in the same samples (Figure S2). The derived stop allele of nonsense SNPs was indeed found to be generally rarer than the derived allele of synonymous SNPs (Kolmogorov-Smirnov test, p << 0.001). This suggests that, as expected, weak negative selection is acting on stop alleles as a class to remove variants that are harmful over an evolutionary timescale. Indeed, we estimated the selection coefficient(s) to be ∼0.0016 (see Material and Methods section), indicating that the stop alleles have on average only a slight decrease in fitness when they are compared to the normal alleles. This is lower than the value of 0.025 estimated for nonsense SNPs by Gorlov et al.49 but similar to a value in the range of 10−3, calculated against deleterious heterozygous SNPs segregating in the human population.50 Because we are using a subset of the total nonsense SNPs in the human genome and the average number of nonsense SNPs is actually likely to be higher, our estimate of 0.0016 is an upper limit.
In contrast to this general trend, a few nonsense SNPs displayed a high DAF, and these include SNPs in the CASP12, FMO2, and NPPA genes, with DAFs at 0.962, 0.959, and 0.848, respectively (Table 1). An excess of very high-frequency derived variants has previously been observed in the normalized site-frequency spectrum and can potentially be explained by ancestral misspecification.48 Although the ancestral state of the CASP12 nonsense SNP is well established9,46, this potential confounding factor might be relevant for other genes. Among the additional genes, FMO2 codes for the precursor of atrial natriuetic peptide, and the nonsense-SNP-carrying form has been shown to be catalytically inactive.51 Previous studies have further revealed that the derived stop allele in FMO2 is fixed in European and Asian populations, whereas the ancestral active allele has been found in African Americans and Hispanics51–53; such distributions were confirmed and extended in our data (Tables S2 and S4). If carriers of the functional allele are exposed to thioureas (which are present in a wide range of industrial, household, and medical products), they are at increased risk of pulmonary toxicity.52 Because exposure to these chemicals is now widespread, it is interesting to consider whether they might also have been present in the pre-industrial environment and whether the stop allele might have reached its high frequency because of positive selection for protection against toxicity. In addition, the stop allele in NPPA has previously been reported at a high frequency in human populations and was shown to be associated with a decreased risk of stroke recurrence.54 Stroke is a disease of old age and might not itself have exerted strong selective pressure in the past, but the association with a phenotype raises the possibility that the allele might be linked to other advantageous phenotypes as well and could thus be susceptible to positive selection. These three examples show that nonsense SNPs can be associated with phenotypes that are advantageous in some environments, and so we next investigated whether a subset of the nonsense SNPs might show the evolutionary signature of such an advantage: positive selection.
Table 1.
Summary of Outlier Nonsense SNPs
| Gene Symbol (MIM ID) | Gene Description | SNP | Chromosome | Position (B36) | Percent Truncated | NMD candidate | DAF | FSTa | Heterozygosityb | Outlier Signal |
|---|---|---|---|---|---|---|---|---|---|---|
| APOL3 (MIM ∗607253) | apolipoprotein | rs11089781 | 22 | 34886714 | 85.61 | YES | 0.022 | 0.258 | 0.043 | FST |
| C1orf105 | open reading frame | rs7532205 | 1 | 170688829 | 91.38 | YES | 0.045 | 0.265 | 0.086 | FST |
| CASP12 (MIM ∗608633) | caspase | rs497116 | 11 | 104268327 | 63.66 | YES | 0.962 | 0.241 | 0.074 | DAF, FST |
| CD36 (MIM ∗173510) | thrombospondin receptor | rs3211938 | 7 | 80138385 | 31.29 | YES | 0.017 | 0.242 | 0.032 | REHH, FST |
| FMO2 (MIM ∗603955) | flavin-containing monooxygenase | rs6661174 | 1 | 169444714 | 11.78 | YES | 0.959 | 0.284 | 0.079 | DAF, FST |
| HPS4 (MIM ∗606682) | Hermansky-Pudlak syndrome | rs3747129 | 22 | 25192041 | 53.50 | YES | 0.202 | 0.097 | 0.323 | REHH |
| KIAA0748 | KIAA0748 | rs1801876 | 12 | 53630291 | 3.80 | NO | 0.364 | 0.240 | 0.463 | FSTc |
| LPL (MIM ∗609708) | lipoprotein lipase | rs328 | 8 | 19864004 | 0.42 | NO | 0.086 | 0.036 | 0.157 | REHH |
| MAGEE2 | melanoma antigen | rs1343879 | X | 74921254 | 77.10 | NO | 0.311 | 0.540 | 0.429 | FSTc |
| NPPA (MIM ∗108780) | natriuretic peptide precursor | rs5065 | 1 | 11828655 | 0.65 | NO | 0.848 | 0.145 | 0.259 | DAF, REHH |
| OR1B1 | olfactory receptor | rs1476860 | 9 | 124431062 | 39.81 | NO | 0.397 | 0.211 | 0.479 | FSTc |
| Q8N8G3_HUMAN | rs4723884 | 7 | 39615800 | 68.38 | NO | 0.225 | 0.225 | 0.349 | FST | |
| REG4 (MIM ∗609846) | regenerating islet-derived | rs1052972 | 1 | 120138308 | 8.80 | NO | 0.490 | 0.211 | 0.500 | FSTc |
| SEMA4C (MIM 604462) | semaphorin | rs12471298 | 2 | 96890515 | 16.91 | NO | 0.043 | 0.469 | 0.082 | FSTc |
| SIGLEC12 | sialic acid binding Ig-like lectin | rs16982743 | 19 | 56696715 | 95.13 | YES | 0.198 | 0.221 | 0.317 | FST |
| ZAN (MIM ∗602372) | zonadhesin | rs2293766 | 7 | 100209294 | 33.04 | YES | 0.261 | 0.399 | 0.386 | FSTc |
Columns: the official gene symbol with the MIM ID (when available), gene description, SNP ID (rs number), chromosome, and position (in build 36), percent of the peptide truncation, whether or not the SNPs are predicted to trigger NMD (YES or NO), derived allele frequency (DAF), FST, level of heterozygosity, and outlier signal. The outlier signal is identified as: FST > 0.2, DAF > 0.8 (one example), and REHH above the 95th percentile of the control distribution.
Calculated according to Weir and Cockerham26 across the 37 populations.
Calculated according to Nei.28
FST value is significant because it is above the 99th percentile of the empirical distribution.
Population Differentiation
Because geographically separated populations might be subject to distinctive selective environments, selection can increase population differentiation at the selected locus. We used FST26 as a measure of population differentiation and found that when samples were grouped into 37 populations (Figure S1B), most SNPs (both nonsense and synonymous) had low FST values within the 0.00–0.19 bin (Figure S3), as might be expected for human SNPs.17,55–57 On average, nonsense SNPs had significantly lower FST values than synonymous SNPs (Kolmogorov-Smirnov test, p < < 0.001). This is in accordance with a recent study55 that showed an excess of low FST values for nonsynonymous SNPs compared to other classes, such as synonymous SNPs. Furthermore, after allowing for ascertainment bias by matching the FST values to the minor allele frequency (MAF), the authors came to the conclusion that the low values observed were a signal of purifying rather than balancing selection because the excess represented an excess of rare but not intermediate variants. To test for this in our data, we plotted the FST values of nonsense SNPs against their MAF and found no significant correlation between the two. However, we also found that the majority of low FST values are in SNPs with low MAF. We therefore suspect that the excess of low FST values observed for the nonsense SNPs here is also the consequence of purifying selection acting against mildly deleterious mutations.
In order to assess the significance of the individual FST values, we compared them to the empirical-frequency-matched distribution of values in the HGDP-CEPH panel. We found 13 nonsense SNPs with FST values above 0.2, and six of these were above the HGDP-CEPH 99th percentile (in MAGEE2, SEMA4C (MIM 604462), ZAN (MIM ∗602372), KIAA0748, REG4 (MIM ∗609846), and ORIB1; Table 1), when less than two would be expected by chance. Genotyping errors can be a source of unusually high FST values55 but are unlikely to be responsible here. We found no overall correlation between FST and heterozygosity (Figure S4), but note that several of the nonsense SNPs displaying high FST values also show outlier behavior in terms of heterozygosity (Table 1). The SNPs in SEMA4C and FMO2 have high FST values but a low heterozygosity, which could indicate a recent population-restricted selective sweep. The SNPs in MAGEE2 and ZAN, on the other hand, have high FST values as well as high levels of heterozygosity, which could be a sign of balancing selection or an older selective sweep. It is therefore possible that several of these genes have experienced non-neutral evolution.
Extended Haplotypes
To gain further insight into the possible action of recent natural selection, we applied the REHH test.30 We found no evidence of unusually extended haplotypes in the nonsense SNPs as a class, which further indicates (unsurprisingly) that the majority of these SNPs are not positively selected. Outliers above the 95th percentile (Figure S5 and Table 1) include NPPA (again), LPL (MIM ∗609708), which encodes lipoprotein lipase and has been implicated in disorders of lipoprotein metabolism, CD36 (MIM ∗173510), which is a thrombospondin receptor, and HPS4 (MIM ∗606682), which encodes the Hermansky-Pudlak syndrome 4 protein. A previous study observed a significant excess of long-range haplotypes among nonsynonymous SNPs with high FST values.55 However, only CD36 identified here was also reported with a high FST value (FST = 0.24); the others had values below 0.15. It should be noted that MAGEE2, our highest FST outlier, was not included in the REHH analysis because it is located on the X chromosome and appropriate controls were not available.
MAGEE2: An Example of Advantageous Gene Loss?
Finally, we investigated the nonsense SNP in MAGEE2 further by resequencing the gene and its surrounding regions and applying sequence-based tests to determine whether the evolutionary history of the region was compatible with neutrality. This SNP displayed the highest FST value of all, resulting from the presence of the stop allele (A) at very high frequency in Asian and South-American populations but its virtual absence from European and African populations (Figure 4A). The geographical distribution suggests that the derived stop allele arose before the entry of humans into the Americas ∼15–20 KYA and most likely before the exit from Africa ∼50 KYA. The nonsense SNP truncated the protein by ∼77%, although NMD was not predicted to be triggered (Table S4).
Figure 4.
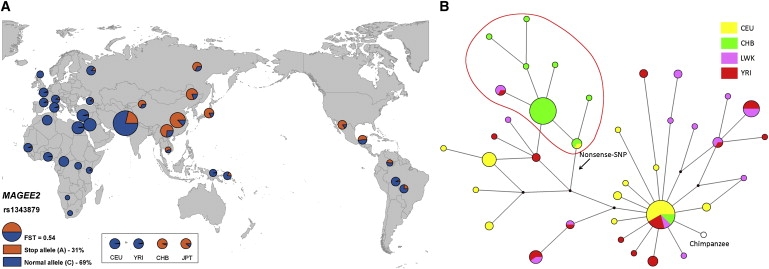
MAGEE2
(A) Geographical distribution of stop (orange) and normal (blue) alleles in MAGEE2. HapMap populations are displayed separately because they do not all have precise geographic locations. Pie areas are proportional to sample sizes.
(B) Median-joining network of inferred MAGEE2 haplotypes. Circle areas are proportional to the haplotype frequency and are color coded according to population: CEU in yellow, CHB in green, LWK in pink, and YRI in red. Lines represent mutational steps between them (one or two steps, according to length). An arrow shows the location of a nonsense SNP (rs1343879).
We resequenced the gene in 91 individuals from four HapMap populations, CEU, YRI, CHB, and LWK16,17 and one chimpanzee. Thirty-two chromosomes were found to carry the stop allele: 1 YRI, 28 CHB, 1 CEU, and 2 LWK. These proportions are similar to the worldwide geographical distribution shown in Figure 4A. A total of 43 SNPs were detected in the MAGEE2 gene (Table S3); the haplotypes carrying the stop allele were much less diverse than the normal ones and had a nucleotide diversity (π) of 0.8 × 10⁻⁴ compared with 3.7 × 10⁻⁴ (Table 2). This led to a higher diversity in the African populations (π = 4.3 × 10⁻⁴ in YRI and 4.7 × 10⁻⁴ in LWK) than in the CEU (π = 2.9 × 10⁻⁴) and CHB (π = 1.6 × 10⁻⁴), but this is in accordance with most other comparisons of diversity within and outside Africa.17,58,59 The lower diversity observed for the truncated version is consistent with positive selection, and to explore this possibility further we applied additional tests. Neutrality tests (Table 2), which took into account the demography of each population, revealed two significant departures from neutral expectation. Fewer haplotypes were found in the whole sample than expected, as measured by Fu's Fs.34 In addition, Fay and Wu's H revealed an excess of high-frequency derived alleles in the CHB, the one sample where a signal would be expected if positive selection had driven the nonsense SNP to high frequency.
Table 2.
Summary Statistics for MAGEE2
| Sample Characteristics |
Allele-Frequency Distribution Tests |
Haplotype Test |
||||||||
|---|---|---|---|---|---|---|---|---|---|---|
| Sample | Sample Size (chromosomes) | Number of Polymorphic Sites | Nucleotide Diversity (π) (× 104) | Tajima's D | Fu & Li's D | Fu & Li's D∗ | Fu & Li's F | Fu & Li's F∗ | Fay & Wu's H | Fu's Fs |
| Worldwideb | 111 | 43 | 4.2 | −1.24 | −2.20 | −2.28 | −2.16 | −2.23 | 0.42 | −27.03a |
| YRI | 26 | 22 | 4.3 | −0.49 | −0.07 | 0.00 | −0.26 | −0.18 | 3.10 | −4.25 |
| LWK | 21 | 21 | 4.7 | −0.24 | 0.26 | 0.29 | 0.12 | 0.16 | 2.93 | −4.15 |
| CEU | 33 | 17 | 2.9 | −0.68 | −1.58 | −1.35 | −1.54 | −1.34 | 1.05 | −2.36 |
| CHB | 31 | 11 | 1.6 | −1.10 | −0.14 | −0.58 | −0.54 | −0.87 | −8.32a | −3.54 |
| Active (allb) | 79 | 36 | 3.7 | |||||||
| Inactive (allb) | 32 | 8 | 0.9 | |||||||
| Inactive (CHB) | 28 | 7 | 0.8 | |||||||
p < 0.01 (one-sided tests, simulated distribution from the best-fit model).
All samples (YRI, LWK, CEU, and CHB).
A median-joining network was constructed from the inferred haplotypes (Figure 4B). As was seen in the geographical distribution of the nonsense SNP (Figure 4A), there is a clear east-west division for the haplotypes, reflecting the presence or absence of the nonsense SNP. All haplotypes carrying the inactive form cluster together (inside red circle in Figure 4B) such that there is one high-frequency haplotype with the other nonsense-allele haplotypes only one or two steps away. This pattern helps to explain the significantly negative value of Fay and Wu's H in the CHB sample by illustrating the moderately high frequency of a derived haplotype cluster specific to the CHB. The TMRCA was estimated at 69 ± 31 KY (Network) or 41 ± 6 KY (GENETREE), consistent with what would be expected on the basis of the geographical distribution.
Discussion
The analyses described here have identified the general characteristics of the class of human nonsense SNPs and have also pinpointed a small number of nonsense SNPs that appeared to be exceptional. Previous studies14,15,46 have been largely restricted to in silico investigations but have revealed an abundance of nonsense SNPs in the human genome and the potential impact of gene loss on the human lineage after the split from the chimpanzee46. As a consequence of the accumulation of nonsense SNPs, functions such as chemoreception and immune response display species-specific features in humans. The current investigation focused on mutations that are still segregating in the human population and reveals that nonsense SNPs are surprisingly prevalent in the general human population, in contrast to previous reports that such SNPs are infrequent in the human genome.60 Although our estimate is a lower bound, we found that the sampled individuals differ, on average, by 24 genes, or more than 0.05% of their gene number, because of these nonsense SNPs. Only three out of the 169 confirmed variable nonsense SNPs showed the pattern expected in the healthy population for known recessive-disease-causing alleles; namely, this pattern is being listed in the HGMD and being present in our samples only as heterozygotes. The remaining 67 nonsense SNPs that were found only as heterozygotes could represent novel recessive-disease alleles, or they could simply represent variants found at low frequency by chance.
Ninety-nine nonsense SNPs were found in our population samples in the homozygous (or hemizygous) state. The samples are from anonymous individuals with no phenotype information beyond sex and ethnicity, but the ethical considerations guiding the sampling required the donors to be adults competent to provide informed consent, and so it is likely that the donors were overtly healthy at the time of sampling. Truncation or loss of these 99 genes is therefore compatible with normal adult life and cannot be strongly disadvantageous. Confirmation of this expectation is found in the presence of 18 of the 169 nonsense SNPs in the Venter genome61; all 18 of these were present in the homozygous state in HapMap or HGDP-CEPH individuals. Nevertheless, population-genetic tests suggested that nonsense SNPs are generally mildly deleterious and subject to weak negative selection (s ∼0.0016), which is reflected in the fact that their frequencies and levels of population differentiation are lower than those of synonymous SNPs.
One additional factor to consider is whether a significant proportion of the genes harboring nonsense SNPs might in fact be pseudogenes already inactivated by regulatory, missense, or other mutations. Known (Vega) pseudogenes were excluded from our study, and the genes examined in more detail showed evidence of an active form, so the proportion of pseudogenes seems likely to be low.
Direct insights into the phenotypic consequences of nonsense SNPs could potentially be obtained by future detailed studies of individuals of known genotype and phenotype, from the inclusion of these SNPs in association surveys, or from model organisms. Indirect insights come from the patterns of variation in the population; such patterns point to possible advantages associated with the loss of individual genes such as MAGEE2, NPPA, FMO2, LPL, and HPS4.
We chose to resequence the MAGEE2 gene to provide more detailed insight into its evolutionary history. This gene displayed limited but significant evidence for a departure from neutrality and thus for positive selection favoring the truncated version in the CHB; it most likely originated shortly before the expansion out of Africa but had a selective advantage restricted to East Asia and the Americas. The MAGEE2 gene is a melanoma-associated antigen that belongs to a family of MAGE genes found predominantly on the X chromosome. Several members of the MAGE gene family (including MAGEE2) are expressed in tumor cells but are silent in normal adult tissues except in the male germ line, leading to an alternative name for these genes, cancer-testis genes. Because of their specific expression on tumor cells, these antigens are potential targets for cancer immunotherapy62,63, but their normal function is completely unknown and merits further investigation. Other genes of particular evolutionary interest include SIGLEC12, a member of a family of sialic acid-binding genes showing rapid evolutionary change, including the deletion of SIGLEC13, in humans.64
To conclude, we see the set of nonsense SNPs documented here as being particularly significant for three areas of genetics and medicine. First, sequencing is starting to be used to survey genes or genomes for disease-associated variants and to inform genetic-risk counseling, including whole-genome resequencing for personalized medicine.61 Nonsense SNPs discovered in such studies would merit particular attention, but at least the 99 found here in the homozygous state are not associated with mendelian disorders, have no overt influence on the phenotype, and are compatible with healthy life. Second, there are nevertheless some situations in which generally neutral differences in gene content have medical consequences: for example, in allogeneic hematopoietic stem cell transplantation, a donor lacking a gene can mount an immune reaction against the tissues of a recipient with that gene, leading to graft-versus-host disease.65 Donors and recipients should be screened for potential gene differences, including those resulting from these nonsense SNPs. Third, a general treatment for a wide variety of genetic disorders caused by nonsense SNPs has been proposed: administration of the drug PTC124, which promotes read-through of premature but not normal termination codons.66 Such treatment would, if effective, also promote the expression of endogenous nontarget genes carrying nonsense SNPs, and the consequences of this should be evaluated. We need to understand the full extent of human genetic variation in order to reap the full benefits of present and future medicine.
Supplemental Data
Supplemental data include five tables and five figures and can be found with this article online at http://www.ajhg.org/.
Supplemental Data
The table is supplied as an Excel spreadsheet and contains all primers used for the genotyping and re-sequencing
The genotype of each sample is provided as a tab-delimited .txt file. The information includes the SNP ID, SNP consequence (nonsense or synonymous), sample ID, population (according to the 37-population division shown in Figure S1B), and genotype
The SNP variation identified in MAGEE2 is provided as a tab-delimited .txt file
This table is provided as an Excel spreadsheet, and the information included is in the following order: The external gene ID (normally the HUGO ID), SNP ID (rs number), chromosome, chromosome position (in build 36), percent of the peptide truncation, whether the SNP is thought to trigger NMD or not (YES or NO), level of heterozygosity calculated according to Nei (Nei 1987; see reference in Document S1), minor-allele frequency, derived-allele frequency, FST (Weir and Cockerham, 1984; see reference in Document S1) (calculated for the 37-population division shown in Figure S1B), SNP number according to the sorting in Figure 2, and SNP number according to the sorting in Figure 3
Web Resources
The URLs for data presented herein are as follows:
DAVID chart analysis tool, http://david.abcc.ncifcrf.gov/summary.jsp
Ensembl Genome Browser, http://www.ensembl.org/index.html
Human Gene Mutation Database, www.hgmd.org
NCBI Blastn and Tblastx, http://blast.ncbi.nlm.nih.gov/Blast.cgi
Online Mendelian Inheritance in Man (OMIM), http://www.ncbi.nlm.nih.gov/Omim
SNP2NMD, http://bioportal.kobic.re.kr/SNP2NMD
Stanford University HGDP-CEPH SNP Genotyping Data, ftp://ftp.cephb.fr/hgdp_supp1/
UCSC Genome Browser, http://genome.ucsc.edu/cgi-bin/hgTables
Acknowledgments
We thank all the sample donors for making this work possible, Howard M. Cann for providing the HGDP-CEPH DNA panel, John Burton, Alison J Coffey, Sanjeev Bhaskar, and Jonathan Bailey at the Sanger Large-Scale Sequencing Pipeline Group for generating the sequence data, William C. Amos, Alex Bateman, and Matthew E. Hurles for input throughout the study, Alex Kondrashov for his suggestions about calculating the selection coefficient, Matthew E. Hurles for the template used to prepare Figure 1, and an anonymous reviewer for helpful comments. This work was supported by The Wellcome Trust.
References
- 1.Ohno S. Springer; Berlin: 1970. Evolution by Gene Duplication. [Google Scholar]
- 2.Olson M.V. When less is more: Gene loss as an engine of evolutionary change. Am. J. Hum. Genet. 1999;64:18–23. doi: 10.1086/302219. [DOI] [PMC free article] [PubMed] [Google Scholar]
- 3.Neel J.V. Diabetes mellitus: A “thrifty” genotype rendered detrimental by “progress”? Am. J. Hum. Genet. 1962;14:353–362. [PMC free article] [PubMed] [Google Scholar]
- 4.Cartegni L., Chew S.L., Krainer A.R. Listening to silence and understanding nonsense: Exonic mutations that affect splicing. Nat. Rev. Genet. 2002;3:285–298. doi: 10.1038/nrg775. [DOI] [PubMed] [Google Scholar]
- 5.Maquat L.E. Nonsense-mediated mRNA decay: splicing, translation and mRNP dynamics. Nat. Rev. Mol. Cell Biol. 2004;5:89–99. doi: 10.1038/nrm1310. [DOI] [PubMed] [Google Scholar]
- 6.Nagy E., Maquat L.E. A rule for termination-codon position within intron-containing genes: When nonsense affects RNA abundance. Trends Biochem. Sci. 1998;23:198–199. doi: 10.1016/s0968-0004(98)01208-0. [DOI] [PubMed] [Google Scholar]
- 7.Mort M., Ivanov D., Cooper D.N., Chuzhanova N.A. A meta-analysis of nonsense mutations causing human genetic disease. Hum. Mutat. 2008;29:1037–1047. doi: 10.1002/humu.20763. [DOI] [PubMed] [Google Scholar]
- 8.Frischmeyer P.A., Dietz H.C. Nonsense-mediated mRNA decay in health and disease. Hum. Mol. Genet. 1999;8:1893–1900. doi: 10.1093/hmg/8.10.1893. [DOI] [PubMed] [Google Scholar]
- 9.Xue Y., Daly A., Yngvadottir B., Liu M., Coop G., Kim Y., Sabeti P., Chen Y., Stalker J., Huckle E. Spread of an inactive form of caspase-12 in humans is due to recent positive selection. Am. J. Hum. Genet. 2006;78:659–670. doi: 10.1086/503116. [DOI] [PMC free article] [PubMed] [Google Scholar]
- 10.MacArthur D.G., North K.N. A gene for speed? The evolution and function of alpha-actinin-3. Bioessays. 2004;26:786–795. doi: 10.1002/bies.20061. [DOI] [PubMed] [Google Scholar]
- 11.Saleh M., Vaillancourt J.P., Graham R.K., Huyck M., Srinivasula S.M., Alnemri E.S., Steinberg M.H., Nolan V., Baldwin C.T., Hotchkiss R.S. Differential modulation of endotoxin responsiveness by human caspase-12 polymorphisms. Nature. 2004;429:75–79. doi: 10.1038/nature02451. [DOI] [PubMed] [Google Scholar]
- 12.Yang N., MacArthur D.G., Gulbin J.P., Hahn A.G., Beggs A.H., Easteal S., North K. ACTN3 genotype is associated with human elite athletic performance. Am. J. Hum. Genet. 2003;73:627–631. doi: 10.1086/377590. [DOI] [PMC free article] [PubMed] [Google Scholar]
- 13.MacArthur D.G., Seto J.T., Raftery J.M., Quinlan K.G., Huttley G.A., Hook J.W., Lemckert F.A., Kee A.J., Edwards M.R., Berman Y. Loss of ACTN3 gene function alters mouse muscle metabolism and shows evidence of positive selection in humans. Nat. Genet. 2007;39:1261–1265. doi: 10.1038/ng2122. [DOI] [PubMed] [Google Scholar]
- 14.Savas S., Tuzmen S., Ozcelik H. Human SNPs resulting in premature stop codons and protein truncation. Hum. Genomics. 2006;2:274–286. doi: 10.1186/1479-7364-2-5-274. [DOI] [PMC free article] [PubMed] [Google Scholar]
- 15.Yamaguchi-Kabata Y., Shimada M.K., Hayakawa Y., Minoshima S., Chakraborty R., Gojobori T., Imanishi T. Distribution and effects of nonsense polymorphisms in human genes. PLoS ONE. 2008;3:e3393. doi: 10.1371/journal.pone.0003393. [DOI] [PMC free article] [PubMed] [Google Scholar]
- 16.The International HapMap Consortium The International HapMap Project. Nature. 2003;426:789–796. doi: 10.1038/nature02168. [DOI] [PubMed] [Google Scholar]
- 17.The International HapMap Consortium A haplotype map of the human genome. Nature. 2005;437:1299–1320. doi: 10.1038/nature04226. [DOI] [PMC free article] [PubMed] [Google Scholar]
- 18.Cann H.M., de Toma C., Cazes L., Legrand M.F., Morel V., Piouffre L., Bodmer J., Bodmer W.F., Bonne-Tamir B., Cambon-Thomsen A. A human genome diversity cell line panel. Science. 2002;296:261–262. doi: 10.1126/science.296.5566.261b. [DOI] [PubMed] [Google Scholar]
- 19.Rosenberg N.A. Standardized subsets of the HGDP-CEPH Human Genome Diversity Cell Line Panel, accounting for atypical and duplicated samples and pairs of close relatives. Ann. Hum. Genet. 2006;70:841–847. doi: 10.1111/j.1469-1809.2006.00285.x. [DOI] [PubMed] [Google Scholar]
- 20.Fan J.B., Oliphant A., Shen R., Kermani B.G., Garcia F., Gunderson K.L., Hansen M., Steemers F., Butler S.L., Deloukas P. Highly parallel SNP genotyping. Cold Spring Harb. Symp. Quant. Biol. 2003;68:69–78. doi: 10.1101/sqb.2003.68.69. [DOI] [PubMed] [Google Scholar]
- 21.Ashurst J.L., Chen C.K., Gilbert J.G., Jekosch K., Keenan S., Meidl P., Searle S.M., Stalker J., Storey R., Trevanion S. The Vertebrate Genome Annotation (Vega) database. Nucleic Acids Res. 2005;33:D459–D465. doi: 10.1093/nar/gki135. [DOI] [PMC free article] [PubMed] [Google Scholar]
- 22.Han A., Kim W.Y., Park S.M. SNP2NMD: A database of human single nucleotide polymorphisms causing nonsense-mediated mRNA decay. Bioinformatics. 2007;23:397–399. doi: 10.1093/bioinformatics/btl593. [DOI] [PubMed] [Google Scholar]
- 23.Ashburner M., Ball C.A., Blake J.A., Botstein D., Butler H., Cherry J.M., Davis A.P., Dolinski K., Dwight S.S., Eppig J.T. Gene ontology: tool for the unification of biology. The Gene Ontology Consortium. Nat. Genet. 2000;25:25–29. doi: 10.1038/75556. [DOI] [PMC free article] [PubMed] [Google Scholar]
- 24.Dennis G., Sherman B.T., Hosack D.A., Yang J., Gao W., Lane H.C., Lempicki R.A. DAVID: Database for Annotation, Visualization, and Integrated Discovery. Genome Biol. 2003;4:3. [PubMed] [Google Scholar]
- 25.Hosack D.A., Dennis G., Sherman B.T., Lane H.C., Lempicki R.A. Identifying biological themes within lists of genes with EASE. Genome Biol. 2003;4:R70. doi: 10.1186/gb-2003-4-10-r70. [DOI] [PMC free article] [PubMed] [Google Scholar]
- 26.Weir B.S., Cockerham C.C. Estimating F-statistics for the analysis of population structure. Evolution. 1984;38:1358–1370. doi: 10.1111/j.1558-5646.1984.tb05657.x. [DOI] [PubMed] [Google Scholar]
- 27.Goudet J. HIERFSTAT, a package for R to compute and test variance components and F-statistics. Mol. Ecol. Notes. 2005;5:184–186. [Google Scholar]
- 28.Nei M. Colombia University Press; New York: 1987. Molecular Evolutionary Genetics. [Google Scholar]
- 29.Nachman M.W., Crowell S.L. Estimate of the mutation rate per nucleotide in humans. Genetics. 2000;156:297–304. doi: 10.1093/genetics/156.1.297. [DOI] [PMC free article] [PubMed] [Google Scholar]
- 30.Sabeti P.C., Reich D.E., Higgins J.M., Levine H.Z., Richter D.J., Schaffner S.F., Gabriel S.B., Platko J.V., Patterson N.J., McDonald G.J. Detecting recent positive selection in the human genome from haplotype structure. Nature. 2002;419:832–837. doi: 10.1038/nature01140. [DOI] [PubMed] [Google Scholar]
- 31.Rozas J., Sánchez-DelBarrio J.C., Messeguer X., Rozas R. DnaSP, DNA polymorphism analyses by the coalescent and other methods. Bioinformatics. 2003;19:2496–2497. doi: 10.1093/bioinformatics/btg359. [DOI] [PubMed] [Google Scholar]
- 32.Tajima F. Statistical method for testing the neutral mutation hypothesis by DNA polymorphism. Genetics. 1989;123:585–595. doi: 10.1093/genetics/123.3.585. [DOI] [PMC free article] [PubMed] [Google Scholar]
- 33.Fu Y.-X., Li W.-H. Statistical tests of neutrality of mutations. Genetics. 1993;133:693–709. doi: 10.1093/genetics/133.3.693. [DOI] [PMC free article] [PubMed] [Google Scholar]
- 34.Fu Y.X. Statistical tests of neutrality of mutations against population growth, hitchhiking and background selection. Genetics. 1997;147:915–925. doi: 10.1093/genetics/147.2.915. [DOI] [PMC free article] [PubMed] [Google Scholar]
- 35.Fay J.C., Wu C.I. Hitchhiking under positive Darwinian selection. Genetics. 2000;155:1405–1413. doi: 10.1093/genetics/155.3.1405. [DOI] [PMC free article] [PubMed] [Google Scholar]
- 36.Hudson R.R. Generating samples under a Wright-Fisher neutral model of genetic variation. Bioinformatics. 2002;18:337–338. doi: 10.1093/bioinformatics/18.2.337. [DOI] [PubMed] [Google Scholar]
- 37.Schaffner S.F., Foo C., Gabriel S., Reich D., Daly M.J., Altshuler D. Calibrating a coalescent simulation of human genome sequence variation. Genome Res. 2005;15:1576–1583. doi: 10.1101/gr.3709305. [DOI] [PMC free article] [PubMed] [Google Scholar]
- 38.Stephens M., Donnelly P. A comparison of bayesian methods for haplotype reconstruction from population genotype data. Am. J. Hum. Genet. 2003;73:1162–1169. doi: 10.1086/379378. [DOI] [PMC free article] [PubMed] [Google Scholar]
- 39.Stephens M., Smith N.J., Donnelly P. A new statistical method for haplotype reconstruction from population data. Am. J. Hum. Genet. 2001;68:978–989. doi: 10.1086/319501. [DOI] [PMC free article] [PubMed] [Google Scholar]
- 40.Bandelt H.J., Forster P., Rohl A. Median-joining networks for inferring intraspecific phylogenies. Mol. Biol. Evol. 1999;16:37–48. doi: 10.1093/oxfordjournals.molbev.a026036. [DOI] [PubMed] [Google Scholar]
- 41.Bahlo M., Griffiths R.C. Inference from gene trees in a subdivided population. Theor. Popul. Biol. 2000;57:79–95. doi: 10.1006/tpbi.1999.1447. [DOI] [PubMed] [Google Scholar]
- 42.Kingman J.F.C. The coalescent. Stochastic Process. Appl. 1982;13:235–248. [Google Scholar]
- 43.Stenson P.D., Ball E.V., Mort M., Phillips A.D., Shiel J.A., Thomas N.S., Abeysinghe S., Krawczak M., Cooper D.N. Human Gene Mutation Database (HGMD): 2003 update. Hum. Mutat. 2003;21:577–581. doi: 10.1002/humu.10212. [DOI] [PubMed] [Google Scholar]
- 44.Gilad Y., Man O., Paabo S., Lancet D. Human specific loss of olfactory receptor genes. Proc. Natl. Acad. Sci. USA. 2003;100:3324–3327. doi: 10.1073/pnas.0535697100. [DOI] [PMC free article] [PubMed] [Google Scholar]
- 45.Gilad Y., Lancet D. Population differences in the human functional olfactory repertoire. Mol. Biol. Evol. 2003;20:307–314. doi: 10.1093/molbev/msg013. [DOI] [PubMed] [Google Scholar]
- 46.Wang X., Grus W.E., Zhang J. Gene losses during human origins. PLoS Biol. 2006;4:e52. doi: 10.1371/journal.pbio.0040052. [DOI] [PMC free article] [PubMed] [Google Scholar]
- 47.Bustamante C.D., Fledel-Alon A., Williamson S., Nielsen R., Hubisz M.T., Glanowski S., Tanenbaum D.M., White T.J., Sninsky J.J., Hernandez R.D. Natural selection on protein-coding genes in the human genome. Nature. 2005;437:1153–1157. doi: 10.1038/nature04240. [DOI] [PubMed] [Google Scholar]
- 48.Williamson S.H., Hernandez R., Fledel-Alon A., Zhu L., Nielsen R., Bustamante C.D. Simultaneous inference of selection and population growth from patterns of variation in the human genome. Proc. Natl. Acad. Sci. USA. 2005;102:7882–7887. doi: 10.1073/pnas.0502300102. [DOI] [PMC free article] [PubMed] [Google Scholar]
- 49.Gorlov I.P., Kimmel M., Amos C.I. Strength of the purifying selection against different categories of the point mutations in the coding regions of the human genome. Hum. Mol. Genet. 2006;15:1143–1150. doi: 10.1093/hmg/ddl029. [DOI] [PubMed] [Google Scholar]
- 50.Sunyaev S., Ramensky V., Koch I., Lathe W., Kondrashov A.S., Bork P. Prediction of deleterious human alleles. Hum. Mol. Genet. 2001;10:591–597. doi: 10.1093/hmg/10.6.591. [DOI] [PubMed] [Google Scholar]
- 51.Dolphin C.T., Beckett D.J., Janmohamed A., Cullingford T.E., Smith R.L., Shephard E.A., Phillips I.R. The flavin-containing monooxygenase 2 gene (FMO2) of humans, but not of other primates, encodes a truncated, nonfunctional protein. J. Biol. Chem. 1998;273:30599–30607. doi: 10.1074/jbc.273.46.30599. [DOI] [PubMed] [Google Scholar]
- 52.Veeramah K.R., Thomas M.G., Weale M.E., Zeitlyn D., Tarekegn A., Bekele E., Mendell N.R., Shephard E.A., Bradman N., Phillips I.R. The potentially deleterious functional variant flavin-containing monooxygenase 2∗1 is at high frequency throughout sub-Saharan Africa. Pharmacogenet. Genomics. 2008;18:877–886. doi: 10.1097/FPC.0b013e3283097311. [DOI] [PMC free article] [PubMed] [Google Scholar]
- 53.Krueger S.K., Siddens L.K., Martin S.R., Yu Z., Pereira C.B., Cabacungan E.T., Hines R.N., Ardlie K.G., Raucy J.L., Williams D.E. Differences in FMO2∗1 allelic frequency between Hispanics of Puerto Rican and Mexican descent. Drug Metab. Dispos. 2004;32:1337–1340. doi: 10.1124/dmd.104.001099. [DOI] [PubMed] [Google Scholar]
- 54.Rubattu S., Stanzione R., Di Angelantonio E., Zanda B., Evangelista A., Tarasi D., Gigante B., Pirisi A., Brunetti E., Volpe M. Atrial natriuretic peptide gene polymorphisms and risk of ischemic stroke in humans. Stroke. 2004;35:814–818. doi: 10.1161/01.STR.0000119381.52589.AB. [DOI] [PubMed] [Google Scholar]
- 55.Barreiro L.B., Laval G., Quach H., Patin E., Quintana-Murci L. Natural selection has driven population differentiation in modern humans. Nat. Genet. 2008;40:340–345. doi: 10.1038/ng.78. [DOI] [PubMed] [Google Scholar]
- 56.Akey J.M., Zhang G., Zhang K., Jin L., Shriver M.D. Interrogating a high-density SNP map for signatures of natural selection. Genome Res. 2002;12:1805–1814. doi: 10.1101/gr.631202. [DOI] [PMC free article] [PubMed] [Google Scholar]
- 57.Weir B.S., Cardon L.R., Anderson A.D., Nielsen D.M., Hill W.G. Measures of human population structure show heterogeneity among genomic regions. Genome Res. 2005;15:1468–1476. doi: 10.1101/gr.4398405. [DOI] [PMC free article] [PubMed] [Google Scholar]
- 58.Prugnolle F., Manica A., Balloux F. Geography predicts neutral genetic diversity of human populations. Curr. Biol. 2005;15:R159–R160. doi: 10.1016/j.cub.2005.02.038. [DOI] [PMC free article] [PubMed] [Google Scholar]
- 59.Rosenberg N.A., Pritchard J.K., Weber J.L., Cann H.M., Kidd K.K., Zhivotovsky L.A., Feldman M.W. Genetic structure of human populations. Science. 2002;298:2381–2385. doi: 10.1126/science.1078311. [DOI] [PubMed] [Google Scholar]
- 60.Sawyer S.L., Berglind L.C., Brookes A.J. Negligible validation rate for public domain stop-codon SNPs. Hum. Mutat. 2003;22:252–254. doi: 10.1002/humu.10256. [DOI] [PubMed] [Google Scholar]
- 61.Ng P.C., Levy S., Huang J., Stockwell T.B., Walenz B.P., Li K., Axelrod N., Busam D.A., Strausberg R.L., Venter J.C. Genetic variation in an individual human exome. PLoS Genet. 2008;4:e1000160. doi: 10.1371/journal.pgen.1000160. [DOI] [PMC free article] [PubMed] [Google Scholar]
- 62.Ross M.T., Grafham D.V., Coffey A.J., Scherer S., McLay K., Muzny D., Platzer M., Howell G.R., Burrows C., Bird C.P. The DNA sequence of the human X chromosome. Nature. 2005;434:325–337. doi: 10.1038/nature03440. [DOI] [PMC free article] [PubMed] [Google Scholar]
- 63.Chomez P., De Backer O., Bertrand M., De Plaen E., Boon T., Lucas S. An overview of the MAGE gene family with the identification of all human members of the family. Cancer Res. 2001;61:5544–5551. [PubMed] [Google Scholar]
- 64.Angata T., Margulies E.H., Green E.D., Varki A. Large-scale sequencing of the CD33-related Siglec gene cluster in five mammalian species reveals rapid evolution by multiple mechanisms. Proc. Natl. Acad. Sci. USA. 2004;101:13251–13256. doi: 10.1073/pnas.0404833101. [DOI] [PMC free article] [PubMed] [Google Scholar]
- 65.Murata M., Warren E.H., Riddell S.R. A human minor histocompatibility antigen resulting from differential expression due to a gene deletion. J. Exp. Med. 2003;197:1279–1289. doi: 10.1084/jem.20030044. [DOI] [PMC free article] [PubMed] [Google Scholar]
- 66.Welch E.M., Barton E.R., Zhuo J., Tomizawa Y., Friesen W.J., Trifillis P., Paushkin S., Patel M., Trotta C.R., Hwang S. PTC124 targets genetic disorders caused by nonsense mutations. Nature. 2007;447:87–91. doi: 10.1038/nature05756. [DOI] [PubMed] [Google Scholar]
Associated Data
This section collects any data citations, data availability statements, or supplementary materials included in this article.
Supplementary Materials
The table is supplied as an Excel spreadsheet and contains all primers used for the genotyping and re-sequencing
The genotype of each sample is provided as a tab-delimited .txt file. The information includes the SNP ID, SNP consequence (nonsense or synonymous), sample ID, population (according to the 37-population division shown in Figure S1B), and genotype
The SNP variation identified in MAGEE2 is provided as a tab-delimited .txt file
This table is provided as an Excel spreadsheet, and the information included is in the following order: The external gene ID (normally the HUGO ID), SNP ID (rs number), chromosome, chromosome position (in build 36), percent of the peptide truncation, whether the SNP is thought to trigger NMD or not (YES or NO), level of heterozygosity calculated according to Nei (Nei 1987; see reference in Document S1), minor-allele frequency, derived-allele frequency, FST (Weir and Cockerham, 1984; see reference in Document S1) (calculated for the 37-population division shown in Figure S1B), SNP number according to the sorting in Figure 2, and SNP number according to the sorting in Figure 3