

Abstract
During brain activation, the decrease in the ratio between cerebral oxygen and carbohydrate uptake (6 O2/(glucose +1/2 lactate); the oxygen–carbohydrate index, OCI) is attenuated by the non-selective β-adrenergic receptor antagonist propranolol, whereas OCI remains unaffected by the β1-adrenergic receptor antagonist metroprolol. These observations suggest involvement of a β2-adrenergic mechanism in non-oxidative metabolism for the brain. Therefore, we evaluated the effect of adrenaline (0.08 μg kg−1 min−1i.v. for 15 min) and noradrenaline (0.5, 0.1 and 0.15 μg kg−1 min−1i.v. for 20 min) on the arterial to internal jugular venous concentration differences (a-v diff) of O2, glucose and lactate in healthy humans. Adrenaline (n= 10) increased the arterial concentrations of O2, glucose and lactate (P < 0.05) and also increased the a-v diff for glucose from 0.6 ± 0.1 to 0.8 ± 0.2 mm (mean ±s.d.; P < 0.05). The a-v diff for lactate shifted from a net cerebral release to an uptake and OCI was lowered from 5.1 ± 1.5 to 3.6 ± 0.4 (P < 0.05) indicating an 8-fold increase in the rate of non-oxidative carbohydrate uptake during adrenaline infusion (P < 0.01). Conversely, noradrenaline (n= 8) did not affect the OCI despite an increase in the a-v diff for glucose (P < 0.05). These results support that non-oxidative carbohydrate consumption for the brain is driven by a β2-adrenergic mechanism, giving neurons an abundant provision of energy when plasma adrenaline increases.
Cerebral energy metabolism is covered almost exclusively by oxidation of glucose since the molar ratio between the cerebral uptake of O2 to that of carbohydrate (the O2–carbohydrate index; OCI) is close to 6 (Quistorff et al. 2008). However, in the resting rat as much as 10% of brain energy turnover may be attributed to non-oxidative metabolism (Siesjö, 1978) and when human subjects are confined in a scanner to be exposed to intense visual stimulation, the non-oxidative carbohydrate consumption for the brain increases progressively as evaluated by a 10-fold greater increase in the cerebral metabolic rate for glucose than that for O2 (Fox et al. 1988). Similarly, with intense activation of the brain during maximal whole body exercise, OCI expressed as (6O2/(glucose +1/2 lactate)) decreases from a resting value of ∼5.7 to 1.7 (Volianitis et al. 2008) suggesting significant non-oxidative carbohydrate consumption for the brain. However, non-oxidative metabolism for the brain has been difficult to accept because the cerebral lactate uptake is proportional to its arterial concentration during exercise (Ide et al. 1999 as reviewed by Quistorff et al. 2008). In addition, the concentration of lactate increases minimally in the cerebrospinal fluid (Dalsgaard et al. 2004b) and it does not accumulate within the brain tissue (Dalsgaard et al. 2004c) suggesting that lactate is used for oxidation (Schurr et al. 1988). Thus lactate, when present above a certain concentration, may be the preferred cerebral energy substrate for the activated brain (Bouzier-Sore et al. 2003; Kemppainen et al. 2005).
In muscles, the influence of catecholamines on glycogenolysis and glycolysis is established (Robison et al. 1971). During maximal exercise there is a marked increase in plasma catecholamine concentrations, which enhances glucose and lactate turnover (Kjaer et al. 1987). Since the brain possesses adrenergic receptors (Minneman et al. 1979), circulating catecholamines may also influence cerebral carbohydrate metabolism (Bryan, 1990) and the non-oxidative cerebral carbohydrate uptake for the activated brain is attenuated following the administration of the combined β1/β2 adrenergic receptor antagonist propranolol both in the rat (Schmalbruch et al. 2002) and in humans (Larsen et al. 2008), whereas the selective β1 adrenergic receptor antagonist metropolol is without an effect (Dalsgaard et al. 2004a).
Taken together, these observations suggest that a β2 adrenergic receptor mechanism has an important role in the regulation of cerebral carbohydrate uptake and metabolism. Based on the relative affinities for the different subtypes of β adrenergic receptors (Molinoff, 1984), we hypothesize that adrenaline, but not noradrenaline, causes an acceleration of non-oxidative carbohydrate consumption by the brain.
Methods
A total of 20 healthy subjects (adrenaline study: 10 subjects (6 males): 24 ± 3 years, 174 ± 8 cm and 69 ± 11 kg; and noradrenaline study: 10 subjects (6 males); 27 ± 7 years, 176 ± 7 cm and 73 ± 12 kg; means and s.d.) participated in the study after providing their written informed consent as approved by the regional ethical committee (H-A-2008-056) and the study conformed to the principles established in the Declaration of Helsinki.
Procedures
The subjects had no restrictions on their diet or physical activity prior to the study and were placed on a hospital bed tilted slightly head-down. Under local anaesthesia (lidocain, 2%) and guided by ultrasound, a catheter (1.6 mm; ES-04706, Arrow International, Reading, PA, USA) was inserted retrograde in the right internal jugular vein and advanced to its bulb at the base of the skull. In two female subjects we abstained from inserting a catheter in the internal jugular vein since the ultrasound image revealed an unusually small vessel diameter (< 3 mm) or because a vasovagal episode was provoked. Therefore venous blood was not obtained in these two subjects in the noradrenaline experiment. A second catheter (1.1 mm) was inserted in the left brachial artery and a third catheter (0.7 mm) in the left subclavian vein through an arm vein for the administration of catecholamines. After catheterization, the subjects were placed supine and they rested for 1 h before the catecholamine was administered to offset changes in OCI caused by ‘arousal’ and the nociceptive stimuli associated with catheterization (Dalsgaard, 2006).
Measurements
Changes in cerebral blood flow (CBF) were identified by middle cerebral artery blood flow velocity (MCA Vmean) with transcranial Doppler sonography through the posterior temporal ultrasound window (Multidop X, DWL, Sipplingen, Germany; Jørgensen et al. 1992; Bein et al. 2006). After obtaining the optimal signal to noise ratio, the probe was fixed by adhesive ultrasonic gel (Tensive, Parker Laboratories, Fairfield, NJ, USA) and secured by a headband. Mean arterial pressure (MAP) was measured through a transducer (Edwards Life Sciences, Irvine, CA, USA) placed at the level of the heart and connected to a monitor (Dialogue-2000 IBC-Danica Electronic, Copenhagen, Denmark) with sampling at 100 Hz (Di-720, Dataq Instruments, Akron, OH, USA) for off-line analysis of HR and CO, as assessed from the pressure curve using Modelflow (Finapres Medical Systems, Amsterdam, the Netherlands) (Bogert & Van Lieshout, 2005).
Experimental protocol and calculations
In the first study, infusion of adrenaline (0.08 μg kg −1 min−1) was commenced 1 h after catheterization. This dose increases the natural killer cell activity and corresponds to the arterial adrenaline concentration during exercise at 75% maximal oxygen uptake (Kappel et al. 1991) and was therefore considered to have a general effect including an effect on cerebral metabolism. The infusion lasted 15 min and was followed by a 15 min recovery period. Arterial and venous blood samples were simultaneously obtained from the artery and the right internal jugular vein in pre-heparinized syringes three times prior to infusion of adrenaline at minutes 0, 30 and 60. After the infusion was initiated, blood samples were obtained at minutes 65, 66, 70, 75 and 80 and thereafter samples were obtained at minutes 85, 90 and 95.
In the second study, after 1 h of recovery from catheterization, saline (30 ml h−1) was infused for 20 min as a control and after 5 min the subjects received noradrenaline in three concentrations comparable to the dose used in the adrenaline study (0.5, 0.1 and 0.15 μg kg−1 min−1 for 20 min each) separated by 5 min. Arterial and venous blood samples were simultaneously obtained at time points 0, 10 and 20 min during the infusions and results were calculated based on the last 10 min.
Blood samples were purged of any atmospheric content and immediately analysed using an ABL 725 (Radiometer, Copenhagen, Denmark). Although pyruvate is a viable carbohydrate source in fuelling cerebral activity, pyruvate was omitted in the analysis based on the assumption that its uptake by the brain is at least an order of magnitude smaller than that of lactate (Rasmussen et al. 2006). The OCI and the similar ratio taking only glucose into account (OGI; Fox et al. 1988) were calculated and both ratios were considered to be independent of changes in CBF (Dalsgaard, 2006).
In the adrenaline study, the cumulated cerebral uptake of glucose, lactate and O2 was calculated from the arterial and internal jugular venous concentrations assuming a resting CBF of 700 ml min−1 (Jørgensen et al. 1992) and adjusted according to changes in MCA Vmean (Quistorff et al. 2008):
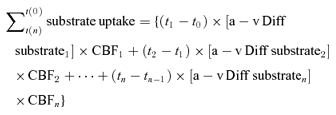 |
The dynamic cumulated cerebral uptake balance between carbohydrates (glucose and lactate) and O2, all expressed in glucose equivalents (glucose +1/2 lactate − 1/6O2) was calculated. This balance reflects the net uptake of glucose and lactate by the brain, which cannot be accounted for by oxidation to CO2 and water and therefore is identified as the non-oxidative carbohydrate uptake.
Statistics
Data are presented as means ±s.d. Changes in response to adrenaline and noradrenaline infusion were detected with a one-way analysis of variance (ANOVA) with repeated measures. In the case of a significant main effect, a post hoc test using Bonferroni multiple corrections was applied for pairwise comparisons. Power calculations indicated that detecting a change in OCI of 1.7 ± 1.3 (mean ±s.d.) with a desired sample size of n= 10 would yield a statistical power of 0.956 and a P-value below 0.05 was considered statistically significant.
Results
Adrenaline infusion
During the 1 h resting period, cardiovascular variables were within the normal range and did not change significantly (Table 1). Infusion of adrenaline increased HR from 62 ± 7 to 90 ± 10 beats min−1 after 1 min (P < 0.05). Thereafter, HR decreased ∼10 beats min−1 but remained elevated compared to the resting value throughout the infusion and 10 min into the recovery (P < 0.05). The MAP decreased in response to the adrenaline infusion reflecting that the systolic BP increased from 123 ± 12 mmHg to a peak of 133 ± 12 mmHg, whereas the diastolic BP decreased from 66 ± 7 to 55 ± 7 mmHg (P < 0.05). The CO was 5.5 ± 1.0 l min−1 at rest and increased to 9.5 ± 1.6 l min−1 at the end of the infusion (P < 0.05) and normalized after 15 min of recovery. The MCA Vmean (42 ± 7 cm s−1) did not significantly change following infusion of adrenaline but was slightly elevated thereafter (45 ± 8 cm s−1; P < 0.05).
Table 1.
Cardiovascular variables during 15 min of intravenous adrenalin infusion at times 65 to 80 min in both table 1 and 2
| 0 | 30 | 60 | 65 | 66 | 70 | 75 | 80 | 85 | 90 | 95 | |
|---|---|---|---|---|---|---|---|---|---|---|---|
| HR (beats min−1) | 60 ± 7 | 59 ± 7 | 62 ± 7 | 66 ± 10 | 90 ± 10* | 79 ± 8* | 80 ± 10* | 82 ± 10* | 77 ± 12* | 70 ± 10* | 68 ± 10 |
| CO (l min−1) | 5.4 ± 1.1 | 5.3 ± 0.9 | 5.5 ± 1.0 | 5.9 ± 0.9 | 8.9 ± 2.1* | 8.9 ± 1.8* | 9.5 ± 1.6* | 9.4 ± 1.5* | 8.3 ± 1.3* | 7.1 ± 1.0 | 6.6 ± 0.9 |
| MAP (mmHg) | 84 ± 8 | 84 ± 8 | 86 ± 8 | 87 ± 9 | 80 ± 12 | 81 ± 6 | 80 ± 6 | 77 ± 7* | 77 ± 11* | 80 ± 10 | 85 ± 8 |
| Sys BP (mmHg) | 121 ± 11 | 119 ± 10 | 123 ± 12 | 125 ± 14 | 119 ± 16 | 133 ± 12* | 132 ± 12* | 127 ± 10 | 124 ± 12 | 126 ± 11 | 126 ± 10 |
| Dia BP (mmHg) | 66 ± 9 | 65 ± 7 | 66 ± 7 | 67 ± 8 | 62 ± 8 | 60 ± 7* | 57 ± 5* | 55 ± 7* | 56 ± 10* | 61 ± 9* | 64 ± 8 |
| MCA Vmean (cm s−1) | — | 43 ± 5 | 41 ± 6 | 42 ± 7 | 43 ± 8 | 43 ± 7 | 43 ± 8 | 42 ± 7 | 45 ± 8* | 44 ± 6 | 44 ± 7 |
Heart rate (HR), cardiac output (CO), mean arterial pressure (MAP), systolic pressure (Sys BP), diastolic pressure (Dia BP) and middle cerebral artery mean blood flow velocity (MCA Vmean) during 15 min of continuous adrenalin infusion.
Different from before infusion (P < 0.05). Values are means ±s.d. (n= 10).
Infusion of adrenaline increased the arterial O2, glucose, and lactate concentrations (P < 0.05; Table 2). Also the a-v diff for glucose showed an increase (from 0.6 ± 0.1 to 0.8 ± 0.2 mm; P < 0.05) and a small net release of lactate at rest shifted to a net uptake. Yet, the fractional extraction of O2 remained unaffected during the infusion, but for glucose it decreased and for lactate it increased (P < 0.05).
Table 2.
Blood metabolites and arterial to internal jugular venous differences for glucose, lactate and O2 during 15 min of intravenous adrenalin infusion at times shown
| 0 | 30 | 60 | 65 | 66 | 70 | 75 | 80 | 85 | 90 | 95 | |
|---|---|---|---|---|---|---|---|---|---|---|---|
| Arterial glucose (mm) | 5.7 ± 0.4 | 5.6 ± 0.3 | 5.5 ± 0.3 | 5.5 ± 0.3 | 5.5 ± 0.2* | 6.0 ± 0.3* | 6.9 ± 0.3* | 7.6 ± 0.4* | 7.6 ± 0.5* | 7.3 ± 0.4* | 7.1 ± 0.4* |
| Arterial lactate (mm) | 0.8 ± 0.2 | 0.7 ± 0.3 | 0.7 ± 0.4 | 0.7 ± 0.3 | 0.8 ± 0.3 | 1.1 ± 0.6* | 1.5 ± 0.7* | 1.7 ± 0.8* | 1.6 ± 0.6* | 1.6 ± 0.7* | 1.5 ± 0.6* |
| Arterial O2 (mm) | 8.3 ± 0.9 | 8.2 ± 0.8 | 8.3 ± 0.7 | 8.4 ± 0.7 | 8.5 ± 0.7 | 8.6 ± 0.7 | 8.6 ± 0.7* | 8.6 ± 0.7* | 8.4 ± 0.7 | 8.3 ± 0.8 | 8.3 ± 0.8 |
| A-V diff glucose (mm) | 0.7 ± 0.3 | 0.6 ± 0.2 | 0.6 ± 0.1 | 0.7 ± 0.2 | 0.7 ± 0.1 | 0.7 ± 0.2 | 0.8 ± 0.2* | 0.8 ± 0.2 | 0.6 ± 0.2 | 0.5 ± 0.3 | 0.6 ± 0.2 |
| A-V diff lactate (mm) | −0.1 ± 0.0 | −0.1 ± 0.1 | 0.0 ± 0.0 | 0.0 ± 0.1 | 0.0 ± 0.1 | 0.1 ± 0.2 | 0.1 ± 0.1 | 0.1 ± 0.1 | 0.1 ± 0.1 | 0.1 ± 0.2 | 0.1 ± 0.1 |
| a-v diff O2 (mm) | 3.0 ± 0.7 | 2.8 ± 0.6 | 2.7 ± 0.5 | 3.0 ± 0.5 | 3.0 ± 0.6 | 3.0 ± 0.6 | 3.0 ± 0.6 | 2.9 ± 0.4 | 2.7 ± 0.4 | 2.7 ± 0.4 | 2.8 ± 0.4 |
| EGlucose (%) | 12 ± 4 | 11 ± 3 | 11 ± 2 | 12 ± 2 | 12 ± 2 | 12 ± 3 | 12 ± 2 | 10 ± 2 | 8 ± 2* | 8 ± 3* | 9 ± 2 |
| ELactate (%) | −9 ± 8 | −8 ± 9 | −6 ± 10 | −8 ± 20 | −1 ± 18 | 3 ± 21 | 6 ± 15* | 6 ± 9* | 5 ± 10* | 4 ± 13* | 3 ± 9 |
| EOxygen (%) | 35 ± 6 | 34 ± 5 | 33 ± 4 | 36 ± 4 | 35 ± 5 | 35 ± 5 | 35 ± 5 | 34 ± 4 | 33 ± 4 | 33 ± 3 | 34 ± 2 |
Arterial glucose, lactate and O2, arterial to internal jugular venous differences (a-v diff) of glucose, lactate and O2, and the fractional extraction (Esubstrate) of glucose, lactate and O2 during 15 min of continuous adrenalin infusion.
Different from before infusion (P < 0.05). Values are means ±s.d. (n= 10).
Following catheterization, the OGI (4.0 ± 0.7) and OCI (4.2 ± 0.9) were below the theoretical resting value of 6, and prior to the infusion of adrenaline, OGI and OCI recovered to 4.8 ± 0.9 and 5.1 ± 1.5, respectively (Fig. 1). Nevertheless, adrenaline reduced the two ratios to 3.8 ± 0.4 and 3.6 ± 0.4, respectively (P < 0.05), and both indices returned to the preinfusion values (4.9 ± 1.0 and 4.6 ± 1.0, respectively) after termination of adrenaline infusion.
Figure 1. The O2-to-glucose index (OGI) and the O2-to-carbohydrate index (OCI) at rest and during adrenaline infusion. Values are means ±s.e.m.

*P < 0.05 compared to baseline (n= 10).
The O2 uptake rate increased from 1.8 ± 0.4 to 2.1 ± 0.5 mmol min−1 following adrenaline infusion (P < 0.05; Fig. 2) whereafter it remained elevated compared to rest (P < 0.05). The uptake rate for glucose increased from 0.4 ± 0.1 to 0.5 ± 0.1 mmol min−1 during adrenaline infusion (P < 0.05) but recovered when the infusion was terminated (P < 0.05). The lactate release before the infusion (expressed as a negative uptake rate of −0.03 ± 0.03 mmol min−1) was reversed to an uptake rate of 0.06 ± 0.14 mmol min−1 that stayed elevated during the recovery (P < 0.001). Calculating the carbohydrate to O2 uptake balance revealed an increase in the surplus carbohydrate uptake rate from 0.3 ± 0.2 to 2.2 ± 1.3 mmol min−1 during the infusion that remained higher after infusion was terminated (P < 0.001).
Figure 2. Cummulated uptake rates of O2, glucose and lactate and the total uptake balance (glucose +1/2lactate – 1/6O2 before, during and after adrenaline infusion.

Values are means ±s.e.m. for n= 10. *P < 0.05 compared to baseline, †P < 0.05 compared to infusion.
Noradrenaline infusion
During saline infusion the cardiovascular variables remained stable (Table 3). HR was not affected by the lowest noradrenaline concetration, but decreased from 57 ± 8 to 49 ± 10 (P < 0.05) during infusion at the highest infusion rate. The CO remained constant in response to any noradrenaline concentration. MAP increased gradually from 89 ± 7 mmHg during saline infusion to 99 ± 8, 108 ± 9 and 115 ± 11 mmHg (P < 0.05) with increased noradrenaline infusion, and the increase was caused by gradual increases in both systolic and diastolic BP. The MCA Vmean was 57 ± 11 cm s−1 during saline infusion and showed a small decrease to 55 ± 12 cm s−1 (P < 0.05) during the lowest noradrenaline concentration. However, MCA Vmean was not different from baseline during infusion of the two highest noradrenaline concentrations.
Table 3.
Cardiovascular variables, blood metabolites and arterial to internal jugular venous differences for glucose, lactate and O2 during infusion of saline and different concentrations of noradrenaline (NA)
| Saline | Low NA | Medium NA | High NA | |
|---|---|---|---|---|
| HR (beats min−1) | 57 ± 8 | 52 ± 9 | 51 ± 10* | 49 ± 10* |
| CO (l min−1) | 4.8 ± 1.0 | 4.7 ± 0.7 | 4.8 ± 0.7 | 4.8 ± 0.7 |
| MAP (mmHg) | 89 ± 7 | 99 ± 8* | 108 ± 9*† | 115 ± 11*† |
| Sys BP (mmHg) | 123 ± 8 | 135 ± 12* | 146 ± 15*† | 157 ± 22*† |
| Dia BP (mmHg) | 70 ± 6 | 78 ± 6* | 84 ± 6 | 87 ± 7 |
| MCA Vmean (cm s−1) | 56.9 ± 11.2 | 54.8 ± 11.9* | 55.0 ± 11.0 | 55.0 ± 11.7 |
| Arterial glucose (mm) | 5.8 ± 0.6 | 6.0 ± 0.5 | 6.6 ± 0.7* | 7.1 ± 0.8* |
| Arterial lactate (mm) | 0.81 ± 0.23 | 0.80 ± 0.19 | 0.79 ± 0.13 | 0.82 ± 0.13 |
| Arterial O2 (mm) | 8.19 ± 0.50 | 8.45 ± 0.49* | 8.56 ± 0.46* | 8.65 ± 0.51* |
| a-v diff glucose (mm) | 0.58 ± 0.12 | 0.66 ± 0.07* | 0.67 ± 0.14* | 0.65 ± 0.12 |
| a-v diff lactate (mm) | −0.03 ± 0.05 | 0.00 ± 0.07 | −0.02 ± 0.05 | −0.02 ± 0.05 |
| a-v diff O2 (mm) | 2.77 ± 0.53 | 3.40 ± 1.56 | 3.16 ± 0.61 | 3.12 ± 0.63 |
Heart rate (HR), cardiac output (CO), mean arterial pressure (MAP), systolic pressure (Sys BP), diastolic pressure (Dia BP), middle cerebral artery mean blood flow velocity (MCA Vmean), arterial glucose, lactate and O2 and arterial to internal jugular venous differences (a-v diff) of glucose, lactate and O2 during saline and different doses of noradrenaline infusion. Low NA (0.05 μg kg−1 min−1), medium NA (0.1 μg kg−1 min−1) and high NA (0.15 μg kg−1 min−1).
Different from before infusion (P < 0.05)
different from preceding value (P < 0.05). Values are means ±s.d. (n= 10) except for a-v diff (n= 8).
Infusion of noradrenaline increased the arterial concentrations of O2 and glucose (P < 0.05) comparable to adrenaline, but the arterial lactate concentration remained unaffected (Table 3). Consequently, the a-v diff for glucose increased from 0.6 ± 0.1 to ∼0.7 ± 0.1 with the lowest noradrenaline concentrations (P < 0.05), but was not significantly increased during infusion of the highest noradrenaline concentration. The a-v diff for lactate and O2 did not change during noradrenaline infusion.
During saline infusion OGI was 5.0 ± 0.7 and OCI was 5.2 ± 0.7, which is slightly below the theoretical resting value of ∼6, but similar to the values obtained before adrenaline infusion. There were no statistically significant changes in OGI or OCI in response to noradrenaline infusion although a trend towards a decrease with the lowest noradrenaline concentration (P= 0.07) was detected (Fig. 3) and both OGI and OCI were unaffected by saline infusion.
Figure 3. The O2-to-glucose index (OGI) and the O2-to-carbohydrate index (OCI) during saline infusion and during infusion of different doses of noradrenaline (NA).

Low NA (0.5 μg kg−1 min−1), medium NA (1.0 μg kg−1 min−1) and high NA (1.5 μg kg−1 min−1). Values are means ±s.e.m.*P < 0.05 compared to saline infusion (n= 8).
Discussion
The important finding of this study is that infusion of adrenaline, but not of noradrenaline, caused a decrease in the OGI and OCI qualitatively similar to the decreases observed during visual stimulation (Fox et al. 1988) and maximal exercise (Dalsgaard, 2006). We therefore suggest that adrenaline is responsible for the increase in non-oxidative cerebral carbohydrate consumption with intensified neuronal activity. A possible explanation for this finding is that adrenaline causes an increased glycogenolytic and glycolytic flux of the brain, as it is known to do in skeletal muscles. These results support that a β2-adrenergic mechanism is involved in non-oxidative carbohydrate consumption for brain, but the premise for that conclusion is that adrenaline can penetrate the blood–brain barrier (BBB).
Decreases in OGI and OCI have been observed during intense visual stimulation in the rat (Schmalbruch et al. 2002) and in humans confined in a PET scanner (Fox et al. 1988) and similar decreases have been reported during maximal whole body exercise where the OCI may become as low as 1.7 (Quistorff et al. 2008). Confinement in a scanner, intense visual stimulation and maximal whole body exercise have in common that circulating catecholamines increase and since catecholamines stimulate gluconeogenesis in the liver and glycogenolysis in muscles (Robison et al. 1971), the increases in the arterial concentrations of glucose and lactate in response to adrenaline are to be expected. The lack of increase in arterial lactate in response to noradrenaline is because of the low affinity of noradrenaline for β2 adrenergic receptors.
Adrenaline appears to stimulate the cerebral uptake of glucose and lactate by a β2 adrenergic receptor mechanism (Schmalbruch et al. 2002; Dalsgaard et al. 2004a; Larsen et al. 2008). In support, β1, β2 and β3 adrenergic receptor subtypes are present in the brain (Rainbow et al. 1984; Rodriguez et al. 1995) and the β2 adrenergic receptor acts on glycogenolysis in astrocytes, whereas the β3 adrenergic receptor stimulates glucose uptake in astrocytes via translocation of glucose transporters (GLUT; Gibbs et al. 2007).
The transport of glucose across the BBB is mediated via GLUT1, with the majority of transporters on the abluminal membrane and with a large intracellular store (Farrel & Pardrigde, 1991; Simpson et al. 2007). Increased translocation of GLUT1 in response to adrenaline would be considered to increase the glucose uptake. However, the transport of glucose via GLUT1 is exclusively mediated by the concentration gradient and glucose in brain extracellular fluid remains at 1–1.5 mm (McNay & Gold, 1999). Therefore, an increased arterial glucose concentration as observed in response to influence of both adrenaline and noradrenaline would increase brain glucose uptake (Deuticke, 1982) although it cannot be excluded that glucose transport through the BBB was facilitated by catecholamines. Similarly lactate crosses the BBB via monocarboxylate transporters (MCT1; Bergersen, 2007; Simpson et al. 2007) and transport of lactate across the BBB is accelerated in proportion to its arterial concentration (Ide et al. 1999). However, lactate needs to be metabolized or transferred to neurons or glia cells (astrocytes), in order to maintain a sufficient concentration gradient. While noradrenaline enhances the expression of MCT2 in cultured neurons (Pierre et al. 2003; Chenal & Pellerin, 2007), adrenaline causes reversal of a small cerebral release of lactate to an uptake.
Adrenaline accelerated the calculated surplus carbohydrate uptake not accounted for by oxidative metabolism 8-fold (Fig. 2). Since the calculations were performed in order to integrate the decreases in OCI and OGI, similar calulations in the noradrenaline study were not performed. Nevertheless, catecholamines must penetrate BBB in order to affect cerebral glycogen metabolism and the BBB is, in some areas, permeable to adrenaline (Weil-Malherbe et al. 1959; Zakusov et al. 1972). Osmotic damage to the BBB increases the passage of noradrenaline with a resultant increase in regional CBF secondary to an increase in cerebral oxygen and glucose consumption (MacKenzie et al. 1976b; Edvinsson et al. 1978) and endogenous noradrenaline exerts similar effects on cerebral metabolism to those observed during its systemic infusion (MacKenzie et al. 1976a). Furthermore, increases in CBF and cerebral O2 consumption with an elevation in MAP have been reported following intravenous infusion of adrenaline (Dahlgren et al. 1980), although it remains that catecholamines may pass the BBB at a normal MAP (Abdul-Rahman et al. 1979).
We can only speculate on the fate of the surplus carbohydrate uptake seen in response to adrenaline. Infusion of adrenaline has shown a 2-fold increase in the cerebral metabolic rate of O2 and a concomitant 2-fold increase in cerebral glucose content (Dahlgren et al. 1980). To meet the increased energy demand more glucose and lactate are taken up by the brain. Stimulation of glutamatergic neurons requires energy and oxidative phosphorylation and in parallel, but delayed in time, glutamate reuptake in astrocytes led to increased energy demand. Consequently, glycolysis in astrocytes is increased causing increased lactate production, which supports oxidative metabolism in neurons and replenishes the extracellular pool (Schurr et al. 1999) in addition to lactate taken up from the circulation. The level of glucose-6-phosphatase in astrocytes is extremely low and astrocytes do not release glucose (Dringen & Hamprecht, 1993; Magistretti et al. 1999). However, the lactate dehydrogenase isoenzyme LDH5 is present in astrocytes, favouring the reduction of pyruvate to lactate, whereas the neurons only encompass LDH1, which catalyses the formation of pyruvate from lactate (Dringen et al. 1993). The distribution of LDH isoenzymes and of MCTs in neurons and astrocytes (Bergersen, 2007) supports that astrocytes generate lactate, which is transported to neurons for oxidation. Furthermore, the glycogen phosphorylase in astrocytes is under allosteric control and responsive to the energy status of the cell, and astrocytes can release metabolites such as lactate derived from glycogen when energy demand is elevated (Brown et al. 2003) as sensory stimulation activates glycogenolysis in the rat (Swanson et al. 1992; Cruz & Dienel, 2002). A stoichiometric relationship between cerebral glucose metabolism and glutamate neurotransmitter cycling of 1 : 1 exists (Sibson et al. 1998), which indicates that the increase in cerebral metabolism caused by adrenaline is followed by a surplus uptake of carbohydrates (mainly glucose; Fig. 2) that may be non-oxidative since it cannot be accounted for by O2 uptake.
A limitation to this study is that we did not evaluate the extraction ratio for glucose and lactate over the brain. The calculation needs to be quantified on data derived by, e.g. the use of stable isotopes as established for skeletal muscles (Brooks, 1998). Yet, it remains that a decrease in the OCI through increased uptake of carbohydrate was stimulated by adrenaline and provides support to the concept that cerebral non-oxidative carbohydrate uptake is mediated through a β2 adrenergic mechanism.
These findings extent the current knowledge on the regulation of brain metabolism in humans. It appears that the findings in the original study by Fox et al. 1988) may be explained by the stress associated with the confinement in the scanner. Adrenaline and possibly other β2 adrenergic agonists seem to have a stimulating effect on brain non-oxidative carbohydrate metabolism and we speculate whether adrenaline accelerates glycolysis in astrocytes to provide an immediate energy source for neurons.
Acknowledgments
The study was funded by a grant from the Danish Research Agency (the Strategic Programme for Young Scientists) no. 2117-05-0095, and by the Faculty of Health Sciences, University of Copenhagen. P.B. is the recipient of a poctdoctoral fellowship from the Fonds de la recherche en santé du Quebec (FRSQ).
References
- Abdul-Rahman A, Dahlgren N, Johansson BB, Siesjö BK. Increase in local cerebral blood flow induced by circulating adrenaline: involvement of blood–brain barrier dysfunction. Acta Physiol Scand. 1979;107:227–232. doi: 10.1111/j.1748-1716.1979.tb06467.x. [DOI] [PubMed] [Google Scholar]
- Bein B, Meybohm P, Cavus E, Tonner PH, Steinfath M, Scholz J, Doerges V. A comparison of transcranial doppler with near infrared spectroscopy and indocyanine green during hemorrhagic shock: prospective experimental study. Crit Care. 2006;10:R18–R25. doi: 10.1186/cc3980. [DOI] [PMC free article] [PubMed] [Google Scholar]
- Bergersen LH. Is lactate food for neurons? Comparison of monocarboxylate transporter subtypes in brain and muscle. Neuroscience. 2007;145:11–19. doi: 10.1016/j.neuroscience.2006.11.062. [DOI] [PubMed] [Google Scholar]
- Bogert LW, Van Lieshout JJ. Non-invasive pulsatile arterial pressure and stroke volume changes from the human finger. Exp Physiol. 2005;90:437–446. doi: 10.1113/expphysiol.2005.030262. [DOI] [PubMed] [Google Scholar]
- Bouzier-Sore AK, Voisin P, Canioni P, Magistretti PJ, Pellerin L. Lactate is a preferential oxidative energy substrate over glucose for neurons in culture. J Cereb Blood Flow Metab. 2003;23:1298–1306. doi: 10.1097/01.WCB.0000091761.61714.25. [DOI] [PubMed] [Google Scholar]
- Brooks GA. Mammalian fuel utilization during sustained exercise. Comp Biochem Physiol. 1998;120:89–107. doi: 10.1016/s0305-0491(98)00025-x. [DOI] [PubMed] [Google Scholar]
- Brown AM, Tekkok SB, Ransom BR. Glycogen regulation and functional role in mouse white matter. J Physiol. 2003;549:501–512. doi: 10.1113/jphysiol.2003.042416. [DOI] [PMC free article] [PubMed] [Google Scholar]
- Bryan RM., Jr Cerebral blood flow and energy metabolism during stress. Am J Physiol Heart Circ Physiol. 1990;259:H269–H280. doi: 10.1152/ajpheart.1990.259.2.H269. [DOI] [PubMed] [Google Scholar]
- Chenal J, Pellerin L. Noradrenaline enhances the expression of the neuronal monocarboxylate transporter MCT2 by translational activation via stimulation of PI3K/Akt and the mTOR/S6K pathway. J Neurochem. 2007;102:389–397. doi: 10.1111/j.1471-4159.2007.04495.x. [DOI] [PubMed] [Google Scholar]
- Cruz NF, Dienel GA. High glycogen levels in brains of rats with minimal enviromental stimuli: implications for metabolic contributions of working astrocytes. J Cereb Blood Flow Metab. 2002;22:1476–1489. doi: 10.1097/01.WCB.0000034362.37277.C0. [DOI] [PubMed] [Google Scholar]
- Dahlgren N, Rosén I, Sakabe T, Siesjö BK. Cerebral functional, metabolic and circulatory effects of intravenous infusion of adrenaline in the rat. Brain Res. 1980;184:143–152. doi: 10.1016/0006-8993(80)90593-4. [DOI] [PubMed] [Google Scholar]
- Dalsgaard MK. Fueling cerebral activity in exercising man. J Cereb Blood Flow Metab. 2006;26:731–750. doi: 10.1038/sj.jcbfm.9600256. [DOI] [PubMed] [Google Scholar]
- Dalsgaard MK, Ogoh S, Dawson EA, Yoshiga CC, Quistorff B, Secher NH. Cerebral carbohydrate cost of physical exertion in humans. Am J Physiol Regul Integr Comp Physiol. 2004a;287:R534–R540. doi: 10.1152/ajpregu.00256.2004. [DOI] [PubMed] [Google Scholar]
- Dalsgaard MK, Ott P, Deal F, Juul A, Pedersen BK, Warberg J, Fahrenkrug J, Secher NH. The CSF and arterial to internal jugular venous differences hormonal differences during exercise in humans. Exp Physiol. 2004b;89:271–277. doi: 10.1113/expphysiol.2003.026922. [DOI] [PubMed] [Google Scholar]
- Dalsgaard MK, Quistorff B, Danielsen ER, Selmer C, Vogelsang T, Secher NH. A reduced cerebral metabolic ratio in exercise reflects metabolism and not accumulation of lactate within the brain. J Physiol. 2004c;554:571–578. doi: 10.1113/jphysiol.2003.055053. [DOI] [PMC free article] [PubMed] [Google Scholar]
- Deuticke B. Monocarboxylate transport in erythrocytes. J Membr Biol. 1982;70:89–103. doi: 10.1007/BF01870219. [DOI] [PubMed] [Google Scholar]
- Dringen R, Gebhardt R, Hamprecht B. Glycogen in astrocytes: possible function as lactate supply for neighboring cells. Brain Res. 1993;623:208–214. doi: 10.1016/0006-8993(93)91429-v. [DOI] [PubMed] [Google Scholar]
- Dringen R, Hamprecht B. Differences in glycogen metabolism in astroglia-rich primary cultures and sorbitol-selected astroglial cultures derived from mouse brain. Glia. 1993;8:143–149. doi: 10.1002/glia.440080302. [DOI] [PubMed] [Google Scholar]
- Edvinsson L, Hardebo JE, MacKenzie ET, Owman CH. Effect of exogenous noradrenaline on local cerebral blood flow after osmotic opening of the blood–brain barrier in the rat. J Physiol. 1978;274:149–156. doi: 10.1113/jphysiol.1978.sp012140. [DOI] [PMC free article] [PubMed] [Google Scholar]
- Farrel CL, Pardrigde WM. Blood–brain barrier glucose transporter is asymmetrically distributed on brain capillary endothelial luminal and abluminal membranes: An electron microscopic immunogold study. Proc Natl Acad Sci U S A. 1991;88:5779–5783. doi: 10.1073/pnas.88.13.5779. [DOI] [PMC free article] [PubMed] [Google Scholar]
- Fox PT, Raichle ME, Mintun MA, Dence C. Nonoxidative glucose consumption during focal physiologic neural activity. Science. 1988;241:462–464. doi: 10.1126/science.3260686. [DOI] [PubMed] [Google Scholar]
- Gibbs ME, Hutchinson DS, Summers RJ. Role of β-adrenoceptors in memory consolidation: β3-adrenoceptors act on glucose uptake and β2-adrenoceptors on glycolysis. Neuropsychopharmacol. 2008;33:2384–2397. doi: 10.1038/sj.npp.1301629. [DOI] [PubMed] [Google Scholar]
- Ide K, Horn A, Secher NH. Cerebral metabolic response to submaximal exercise. J Appl Physiol. 1999;87:1604–1608. doi: 10.1152/jappl.1999.87.5.1604. [DOI] [PubMed] [Google Scholar]
- Jørgensen LG, Perko G, Secher NH. Regional cerebral artery mean flow velocity and blood flow during dynamic exercise in humans. J Appl Physiol. 1992;73:1825–1830. doi: 10.1152/jappl.1992.73.5.1825. [DOI] [PubMed] [Google Scholar]
- Kappel M, Tvede N, Galbo H, Haahr PM, Kjaer M, Linstow M, Klarlund K, Pedersen BK. Evidence that the effect of physical exercise on NK cell activity is mediated by epinephrine. J Appl Physiol. 1991;70:2530–2534. doi: 10.1152/jappl.1991.70.6.2530. [DOI] [PubMed] [Google Scholar]
- Kemppainen J, Aalto S, Fujimoto T, Kalliokoski KK, Langsjo J, Oikonen V, Rinne J, Nuutila P, Knuuti J. High intensity exercise decreases global brain glucose uptake in humans. J Physiol. 2005;568:323–332. doi: 10.1113/jphysiol.2005.091355. [DOI] [PMC free article] [PubMed] [Google Scholar]
- Kjaer M, Secher NH, Galbo H. Physical stress and catecholamine release. Bailliere's Clin Endocrin Metab. 1987;1:279–298. doi: 10.1016/s0950-351x(87)80064-2. [DOI] [PubMed] [Google Scholar]
- Larsen TS, Rasmussen P, Overgaard M, Secher NH, Nielsen HB. Non-selective β-adrenergic blockade prevents reduction of the cerebral metabolic ratio during exhaustive exercise in humans. J Physiol. 2008;586:2807–2815. doi: 10.1113/jphysiol.2008.151449. [DOI] [PMC free article] [PubMed] [Google Scholar]
- MacKenzie ET, McCulloch J, Murray HA. Influence of endogenous norepinephrine on cerebral blood flow and metabolism. Am J Physiol. 1976a;231:489–494. doi: 10.1152/ajplegacy.1976.231.2.489. [DOI] [PubMed] [Google Scholar]
- MacKenzie ET, McCulloch J, O'Keane M, Pickard JD, Murray HA. Cerebral circulation and norepinephrine: relevance of the blood–brain barrier. Am J Physiol. 1976b;231:483–488. doi: 10.1152/ajplegacy.1976.231.2.483. [DOI] [PubMed] [Google Scholar]
- McNay EC, Gold PE. Extracellular glucose concentration in the rat hippocampus measured by zero-net-flux: effects of microdialysis flow rate, strain and age. J Neurochem. 1999;72:785–790. doi: 10.1046/j.1471-4159.1999.720785.x. [DOI] [PubMed] [Google Scholar]
- Magistretti PJ, Pellerin L, Rothman DL, Shulman RG. Energy on demand. Science. 1999;283:496–497. doi: 10.1126/science.283.5401.496. [DOI] [PubMed] [Google Scholar]
- Minneman KP, Dibner MD, Wolfe BB, Molinoff PB. β1- and β2-Adrenergic recptors in rat cerebral cortex are independently regulated. Science. 1979;204:866–868. doi: 10.1126/science.35829. [DOI] [PubMed] [Google Scholar]
- Molinoff PB. Alpha- and beta-adrenergic receptor subtypes properties, distribution and regulation. Drugs. 1984;28:1–15. doi: 10.2165/00003495-198400282-00002. [DOI] [PubMed] [Google Scholar]
- Pierre K, Debernardi R, Magistretti PJ, Pellerin L. Noradrenaline enhances monocarboxylate transporter 2 expression in cultured mouse cortical neurons via a translational regulation. J Neurochem. 2003;86:1468–1476. doi: 10.1046/j.1471-4159.2003.01964.x. [DOI] [PubMed] [Google Scholar]
- Quistorff B, Secher NH, Van Lieshout JJ. Lactate fuels the human brain during exercise. FASEB J. 2008;22:3443–3449. doi: 10.1096/fj.08-106104. [DOI] [PubMed] [Google Scholar]
- Rainbow TC, Parsons B, Wolfe BB. Quantitative autoradiography of β1- and β2-adrenergic receptors in rat brain. Proc Natl Acad Sci U S A. 1984;81:1585–1589. doi: 10.1073/pnas.81.5.1585. [DOI] [PMC free article] [PubMed] [Google Scholar]
- Rasmussen P, Plomgaard P, Krogh-Madsen R, Kim YS, van Lieshout JJ, Secher NH, Quistorff B. MCA Vmean and the arterial lactate-to-pyruvate ratio correlate during rhythmic handgrip. J Appl Physiol. 2006;101:1406–1411. doi: 10.1152/japplphysiol.00423.2006. [DOI] [PubMed] [Google Scholar]
- Robison GA, Butcher RW, Sutherland EW. Cyclic AMP. New York: Academic Press; 1971. [Google Scholar]
- Rodriguez M, Carillon C, Coquerel A, Le Fur G, Ferrara P, Caput D, Shire D. Evidence for the presence of. β. 3-adrenergic receptor mRNA in the human brain. Brain Res Mol Brain Res. 1995;29:369–375. doi: 10.1016/0169-328x(94)00274-i. [DOI] [PubMed] [Google Scholar]
- Schmalbruch IK, Linde R, Paulson OB, Madsen PL. Activation-induced resetting of cerebral metabolism and flow is abolished by β-adrenergic blockade with propranolol. Stroke. 2002;33:251–255. doi: 10.1161/hs0102.101233. [DOI] [PubMed] [Google Scholar]
- Schurr A, Miller JJ, Payne RS, Rigor BM. An increase in lactate output by brain tissue serves to meet the energy needs of glutamate activated neurons. J Neurosci. 1999;19:34–39. doi: 10.1523/JNEUROSCI.19-01-00034.1999. [DOI] [PMC free article] [PubMed] [Google Scholar]
- Schurr A, West CA, Rigor B. Lactate-supported synaptic function in the rat hippocampal slice preparation. Science. 1988;240:1326–1328. doi: 10.1126/science.3375817. [DOI] [PubMed] [Google Scholar]
- Sibson NR, Dhankhar A, Mason GF, Rothman DL, Behar KL, Shulman RG. Stoichiometric coupling of brain glucose metabolism and glutamatergic neuronal activity. Proc Natl Acad Sci U S A. 1998;95:316–321. doi: 10.1073/pnas.95.1.316. [DOI] [PMC free article] [PubMed] [Google Scholar]
- Siesjö BK. Brain Energy Metabolism. 1st edn. New York: John Wiley & Sons; 1978. pp. 101–110. [Google Scholar]
- Simpson IA, Carruthers A, Vanucci SJ. Supply and demand in cerebral energy metabolism: the role of nutrient transporters. J Cereb Blood Flow Metab. 2007;27:1766–1791. doi: 10.1038/sj.jcbfm.9600521. [DOI] [PMC free article] [PubMed] [Google Scholar]
- Swanson RA, Morton MM, Sagar SM, Sharp FR. Sensory stimulation induces local cerebral glycogenolysis: demonstration by autoradiography. Neuroscience. 1992;51:451–461. doi: 10.1016/0306-4522(92)90329-z. [DOI] [PubMed] [Google Scholar]
- Volianitis S, Fabricius-Bjerre A, Overgaard A, Strømstad M, Bjarrum M, Carlson C, Petersen NT, Rasmussen P, Secher NH, Nielsen HB. The cerebral metabolic ratio is not affected by oxygen availability during maximal exercise in humans. J Physiol. 2008;586:107–112. doi: 10.1113/jphysiol.2007.142273. [DOI] [PMC free article] [PubMed] [Google Scholar]
- Weil-Malherbe H, Axelrod J, Tomchick R. Blood–brain barrier for adrenaline. Science. 1959;129:1226–1227. doi: 10.1126/science.129.3357.1226. [DOI] [PubMed] [Google Scholar]
- Zakusov VV, Vysotskaya NB, Tolmacheva NS. Penetration of cathecolamines through the blood–brain barrier. Byull Eksper Biol Med. 1972;73:64–66. [PubMed] [Google Scholar]