

Abstract
Vertebrate retinal progenitor cells (RPCs) undergo a robust proliferative expansion to produce enough cells for the retina to form appropriately. Vsx2 (formerly Chx10), a homeodomain protein expressed in RPCs, is required for sufficient proliferation to occur. Sonic Hedgehog protein (SHH), secreted by retinal ganglion cells (RGCs), activates Hedgehog (Hh) signaling in RPCs and is also required for sufficient proliferation to occur. Therefore, we sought to determine if reduced Hh signaling is a contributing factor to the proliferation changes that occur in the absence of Vsx2. To do this, we examined Shh expression and Hh signaling activity in the homozygous ocular retardation J (orJ) mouse, which harbors a recessive null allele in the Vsx2 gene. We found that Shh expression and Hh signaling activity are delayed during early retinal development in orJ mice and this correlates with a delay in the onset of RGC differentiation. At birth, reduced expression of genes regulated by Hh signaling was observed despite the production of SHH ligand. orJ RPCs respond to pre-processed recombinant SHH ligand (SHH-N) in explant culture as evidenced by increased proliferation and expression of Hh target genes. Interestingly, proliferation in the orJ retina is further inhibited by cyclopamine, an antagonist of Hh signaling. Our results suggest that reduced Hh signaling contributes to the reduced level of RPC proliferation in the orJ retina, thereby revealing a role for Vsx2 in mediating mitogen signaling.
Keywords: retina, eye, ocular retardation J, histogenesis, stem cell, homeobox, homeodomain, Sonic Hedgehog, Hhip, Gli1
INTRODUCTION
Mammalian retinal progenitor cells (RPCs) undergo multiple rounds of proliferative cell division to generate the millions of cells necessary to comprise a typical retina. In mice, RPC proliferation begins at embryonic day 10 (E10) and lasts 3 weeks, until post-natal day 10 (P10; all times approximate). From the beginning of this period, some of the generated cells exit the cell cycle and differentiate (Young, 1985), producing all seven major retinal cell classes in a highly specific and sequential, but overlapping, order (Livesey and Cepko, 2001). Therefore, RPC proliferation is crucial not only for generating the necessary number of cells, but also for ensuring sufficient progenitors are available for the production of all retinal cell types. Disruptions of this process in either direction can lead to alterations in retinal structure and function, with severe disruptions resulting in microphthalmia or retinoblastoma. Thus, normal retinal development requires precise regulation of RPC proliferation (reviewed in (Donovan and Dyer, 2005; Levine and Green, 2004)).
Proliferation in the retina, as in other tissues, is a process influenced by a number of intrinsic and extrinsic factors. Homeodomain and cell cycle proteins are cell-intrinsic factors necessary for proper RPC proliferation (reviewed in (Levine and Green, 2004)). Additionally, cell-extrinsic factors, such as mitogens, are also important in promoting RPC proliferation (reviewed in (Dakubo and Wallace, 2004; Yang, 2004)). However, little is known regarding if and how these different factors coordinate their activities to drive RPC proliferation during retinal development.
The Vsx2 gene (formerly Chx10; Mouse Genome Database (URL: http://www.informatics.jax.org)) encodes a homeodomain-containing transcription factor that is expressed by RPCs from the beginning of retinal development, during optic cup formation. RPCs continue to express Vsx2 throughout their proliferative period, but as they differentiate, Vsx2 expression is lost in all postmitotic retinal cell types, except bipolar interneurons and a subset of Muller glia. Mice and humans with mutations in Vsx2/VSX2 exhibit microphthalmia, or small eyes, a condition resulting in part from a profound defect in RPC proliferation that leads to a severe reduction in retinal cell number (Bar-Yosef et al., 2004; Bone-Larson et al., 2000; Burmeister et al., 1996; Dhomen et al., 2006; Ferda Percin et al., 2000; Green et al., 2003; Konyukhov and Sazhina, 1971; Livne-Bar et al., 2006). Interestingly, Vsx2 apparently utilizes multiple mechanisms to control RPC proliferation. For example, Vsx2 regulates cell cycle progression by preventing accumulation of the cyclin-dependent kinase inhibitor protein p27Kip1 via a CyclinD1-dependent mechanism (Ccnd1; formerly referred to as CycD1) (Green et al., 2003). Vsx2 also prevents expression of the transcription factor Mitf. Mitf expression in orJ RPCs biases them towards a pigmented cell fate, which appears to include a more restricted proliferative expansion (Horsford et al., 2005; Rowan et al., 2004). Later in retinal development, Vsx2 has additional roles in specifying neural cell fate: inhibiting rod photoreceptor generation, and promoting bipolar cell generation (Belecky-Adams et al., 1997; Dorval et al., 2006; Hatakeyama et al., 2001; Livne-Bar et al., 2006; Rowan and Cepko, 2004; Rutherford et al., 2004; Toy et al., 2002). However, these roles appear to be largely independent of its roles in promoting proliferation (Green et al., 2003; Livne-Bar et al., 2006). Despite these advances in understanding the roles of Vsx2 in retinal development, the full extent of its activity is not yet known.
Sonic Hedgehog (Shh) is a member of the Hedgehog (Hh) family of genes encoding secreted signaling molecules. Like other Hh family members (Indian Hedgehog (IHH) and Desert Hedgehog (DHH) in mammals), SHH activates the Hh signaling network (Cohen, 2003; Ingham and McMahon, 2001; Nybakken and Perrimon, 2002; Varjosalo and Taipale, 2007). Binding of Hh ligand to the transmembrane receptor, Patched homolog 1 (Ptc1), relieves Ptc1-mediated inhibition of Smoothened (Smo) activity, leading to activation of the Gli family of transcriptional regulators, which ultimately alters gene expression in the target cell. Transcriptional targets of the Hh signaling pathway (referred to hereafter as Hh target genes) include both positive and negative regulators of the Hh signaling network, cell cycle regulators, extrinsic signaling molecules, cell specification and differentiation genes (Ho and Scott, 2002; Oliver et al., 2003). Transcription of these target genes is often context-dependent, which is not surprising given the diverse roles attributed to Hh signaling (Cohen, 2003; Ingham and McMahon, 2001).
SHH is both a well-established and well-characterized retinal mitogen. In the mouse retina, production and secretion of SHH by retinal ganglion cells (RGCs) closely follows the central-to-peripheral wave of RGC differentiation (Wang et al., 2005; Dakubo et al., 2003), which begins around E11.5. RGC-derived SHH activates Hh signaling in adjacent RPCs, as evidenced by changes in Hh target gene expression (Wang et al., 2005). Active Hh signaling in the murine retina overlaps the principal period of proliferative expansion and is both necessary and sufficient for RPC proliferation. Treatment with recombinant, pre-processed SHH protein (SHH-N) (Jensen and Wallace, 1997; Levine et al., 1997) or constitutive activation of Hh signaling (Moshiri and Reh, 2004) increases murine RPC proliferation, while conditional ablation of Shh (Wang et al., 2005; Wang et al., 2002) or treatment with anti-SHH antibodies (Wallace and Raff, 1999) decreases proliferation. Recent work in Xenopus and zebrafish suggests that the effects of SHH on proliferation are accomplished by acceleration of the G1 and G2 phases of the cell cycle (Locker et al., 2006).
In addition to the fact that both Vsx2 and Shh are critical regulators of RPC proliferation, Shh conditional knockout mice exhibit ocular phenotypes similar to orJ mice, including disrupted retinal lamination and microphthalmia (Dakubo et al., 2003; Wang et al., 2002). In this study, we investigated whether another facet of proliferative control mediated by Vsx2 involves Hh signaling.
METHODS
Nomenclature
Many commonly used gene names and symbols are changing to conform to nomenclature rules implemented by the Mouse Genome Nomenclature Committee and HUGO Gene Nomenclature Committee. Relevant to this study are: Vsx2 for Chx10; Pou4f2 for Brn3b; Ccnd1 for Cyclin D1/CycD1.
Animals
orJ mice were obtained from Jackson labs (Bar Harbor, ME). The orJ and + (wild type) alleles were determined by PCR and restriction digests with mouse tail DNA (Burmeister et al., 1996). All mice were on a 129/Sv background. Animals were housed and cared for according to IACUC guidelines. Previous work ((Rowan and Cepko, 2004) and our unpublished observations) suggests that eye development in heterozygous orJ (orJ/+) mice is phenotypically indistinguishable from that in wild type (+/+) mice. Therefore, mice with these genotypes were considered equivalent and are referred to hereafter as wild type. Homozygous orJ (orJ/orJ) mice are referred to as orJ.
In situ hybridization
After dissection in Hank’s buffered saline solution (HBSS), embryonic heads and P0 eyes were fixed overnight at 4 °C with 4% paraformaldehyde (PFA) in phosphate-buffered saline (PBS, pH 7.5) or 4% formaldehyde in PBS/2 mM EGTA, followed by cryoprotection and storage at −80 °C. Sections (12 µm) were cut and stored at −20 °C until use. In situ hybridization was performed as previously described (Green et al., 2003; Schaeren-Wiemers and Gerfin-Moser, 1993). Probes used in this study were digoxigenin-labeled anti-sense probes against Shh, Gli1, Ptc1, Ptc2, Hedgehog interacting protein (Hhip), and Vsx2.
Immunohistochemistry
After dissection in HBSS, embryonic head or retinal tissue was fixed in 4% PFA in PBS for 1 to 3 hr at room temperature or overnight at 4 °C. Tissue fixation was followed by cryoprotection and storage at −80 °C until sectioning. Sections (10 µm for E12.5 cultured retinal explants and 12 µm for all other samples) were cut and stored at −20 °C until use.
Sections were pre-treated for 30 minutes in block buffer (2% normal goat or donkey serum, 0.15% TritonX-100, and 0.01% sodium azide in PBS). Sections were then labeled with primary antibodies diluted in block buffer. The primary antibodies used in this study include rabbit anti-acetylated Class III beta-Tubulin (acTUBB3; Tuj1 antibody; Covance, Richmond, CA); rat anti-bromodeoxyuridine (BrdU; clone ICR1; Accurate Chemical and Scientific Corporation, New York, NY); goat anti-POU4F2 (Brn3b antibody; Santa Cruz Biotechnology, Santa Cruz, CA); rabbit anti-phosphorylated Histone H3 (pHH3; Upstate Biotechnology, Lake Placid, NY), mouse anti-PCNA (clone PC10; Dako, Carpinteria, CA) and rabbit anti-SHH (Santa Cruz Biotechnology, Santa Cruz, CA). Hydrochloric acid treatment (2N HCl; 1 hr at room temperature) was performed prior to incubation with the BrdU antibody. Antigen unmasking (0.18 mM Citric Acid, 77 µM Sodium Citrate, final working concentrations, pH 6.0, 15 minutes at 90–95 °C) was performed prior to incubation with the PCNA antibody. Sections were then labeled with species-specific secondary antibodies conjugated to Alexafluor 488 or 568 (Invitrogen, Carlsbad, CA). Nuclei were stained with 4,6-diamidino-2-phenylindole (DAPI; Fluka, Switzerland), and slides were mounted with glass coverslips for microscopy.
When immunohistochemistry was performed after in situ hybridization on the same sections, pre-treatment with block buffer was omitted and antibodies were diluted in in situ buffer B1 (0.1 M Tris, pH 7.5, 0.15 M NaCl) plus 1% goat serum. In situ buffer B1 was used in place of PBS for rinse steps.
Semi-quantitative RT-PCR (sqRT-PCR) and analysis
Dissected retinal tissue was rapidly frozen by submersion into liquid nitrogen and stored at −80 °C until use. Total RNA was isolated using the RNeasy® Mini or RNeasy® Micro Spin Protocol for isolation of total RNA from animal cells (Qiagen, Valencia, CA). cDNA for use in RT-PCR was synthesized from 100 ng total RNA using the ReactionReady First Strand cDNA Synthesis kit (SuperArray Bioscience Corporation, Frederick, MD). Analysis of relative gene expression was performed according to the RT2 End-Point PCR Assay Protocol using RT2 PCR Primer Sets for each gene of interest (SuperArray Bioscience Corporation, Frederick, MD). The PCR conditions for all genes were as follows: preheat, 95 °C for 15 minutes; cycling, 95 °C for 30 seconds followed by 55 °C for 30 seconds and 72 °C for 30 seconds. The number of PCR cycles for each gene were as follows: 25 cycles, beta-Actin (Actb); 30 cycles, Ccnd1, Gli3, and Smo; 33 cycles, Pou4f2, Gli1, Gli2, Hhip, Ptc1, Ptc2, and Shh. Cycle number was determined based on optimization curves generated for each primer set (Supplement Fig. S1). Actb served as a control for RNA input for each sample run. Gels were analyzed using ImageJ software (NIH). Three to seven samples (pooled or unpooled) were analyzed. Student’s unpaired t-test or Welch’s Two Sample t-test were performed to determine statistical significance as appropriate (based on results of the F-test of Variances).
Western blots
Sample preparation and western blots were performed as previously described (Clark et al., 2008). Primary antibodies used included: rabbit anti-SHH; mouse anti-ACTB (Chemicon, Temecula, CA); mouse anti-CCND1 (Santa Cruz Biotechnology). Enhanced chemiluminescent detection of horseradish peroxidase was performed using SuperSignal West Dura (Pierce Biotechnology, Rockford, IL), and captured using a ChemiDoc XRS imaging system (Bio-Rad, Hercules, CA). Specificity controls for SHH immunoreactivity are presented in Supplemental Figure S2.
Retinal explant cultures
Whole retinal tissue with the lens and vitreal chamber intact was dissected away from surrounding tissues in HBSS and placed into cell culture plates. For P0 samples, retinal explants were cultured in 24-well cell culture plates containing 1–2 ml of culture medium (DMEM/F12; Invitrogen), 0.6% glucose, 0.1125% NaHCO3, 5 mM Hepes, 1% FBS, 1.5 µM thymidine, Glutamax (0.5X, Invitrogen), 25 µg/ml insulin (Sigma, St. Louis, MO), 100 µg/ml transferrin (Sigma), 60 µM putrescine (Sigma), 30 nM selenium (Sigma), 20 nM progesterone (Sigma), and Penicillin/Streptomycin (1X, Invitrogen)). E12.5 retinal explants were cultured in 48-well cell culture plates containing 450 µl of culture medium.
To test the effects of SHH treatment, one explant from each mouse was cultured in the absence of SHH-N, while the explant from the contralateral eye was cultured in the presence of 108 ng/ml SHH-N (Levine et al., 1997). Cultures were incubated at 37 °C and 5% CO2, with nutating to ensure good perfusion of solutions throughout the retina. For proliferation assays, explants were cultured for 24 hours, with BrdU present at a final concentration of 10 µg/ml for the last two hours for P0 samples and 30 minutes for the E12.5 samples. Explants from a minimum of 4 mice were analyzed for each age, genotype and condition. For western blots, at minimum of three explants from separate mice were cultured for eight hours. At the end of the culture period, lens and vascular tissues were removed and discarded. The isolated retinas were pooled according to genotype and condition prior to protein extraction. For gene expression measurements by sqRT-PCR, explants were cultured for 8 hr. Lens and vascular tissues were separated from retinal tissue prior to RNA isolation. Explants from at least four mice were analyzed for each genotype and condition.
To test the effects of cyclopamine, one explant per mouse was cultured with 0.41% (v/v) DMSO added to the media as a vehicle control, while the explant from the contralateral eye was cultured in the presence of 10 µM cyclopamine (Toronto Research Chemicals, North York, Ontario) in 0.41% (v/v) DMSO. For in situ analyses, explants were cultured for 16 hours. For proliferation analyses, explants were cultured for 24 hours with BrdU present at a final concentration of 10 µg/ml for the last two hours. Explants from a minimum of four mice were analyzed for each condition.
Marker quantification and statistical analyses
Quantification of BrdU+, pHH3+, and PCNA+ cells was accomplished by direct counting in retinal sections. For wild type samples, images of the regions between the central and peripheral domains were analyzed. For orJ samples, the entire retinal cross section was analyzed. Images for BrdU and PCNA were collected on an Olympus Fluoview 1000 confocal microscope. Images for pHH3 were collected on a Nikon E600 epifluorscence microscope. Cell counts were done in Photoshop (Adobe) and Image J (NIH). Retinal area was calculated by determining the pixel area using ImageJ and converting to area in mm2. The apical/ventricular surface distance was calculated by determining the length of this surface in pixels using ImageJ and converting to length in mm. Multiple regions counted from the same retinal section were summed while multiple regions from the same retina but different sections were averaged. Student’s paired t-test was performed to determine the statistical significance of the effects of SHH-N or cylopamine treatment between paired samples of each genotype. Tabulated cell counts for the P0 explant experiments are shown in Supplementary Tables 1 – 3.
RESULTS
Altered Hh signaling during embryonic stages in the orJ retina coincides with a delay in Shh expression
To determine whether Vsx2 is necessary for Hh signaling in the developing embryonic retina, we compared the spatial and temporal expression patterns of Shh and Hh target genes in wild type and orJ retinas. For this purpose, we have chosen general transcriptional targets of Hh signaling whose expression is upregulated in response to elevated levels of Hh signaling, including: Gli1, Ptc1, Ptc2, Hedgehog Interacting Protein (Hhip), and Cyclin D1 (Ccnd1). Since SHH production and Hh target gene upregulation are tightly correlated to the central-to-peripheral wave of RGC differentiation, multiple developmental ages were examined.
We first examined gene expression patterns at E12.5 (Fig. 1), an early stage of retinal development at which RGCs have begun to differentiate in the central retina of wild type mice. We find clear evidence of Hh signaling activity in wild type retinas, in the form of Gli1 mRNA expression in RPCs. This expression is restricted to the central retina and stronger on the dorsal side (large arrow, Fig. 1A). In contrast, we fail to detect Gli1 mRNA in orJ retinas at this age (Fig. 1B). However, we find strong Gli1 expression in extra-retinal tissue of orJ mice, as in wild type mice, presumably due to extra-retinal sources of Hh ligands (arrowheads, Fig. 1A,B; (Dakubo et al., 2003)).
Figure 1. Expression patterns of Hh target genes at E12.5.

Gli1 (A, B), Ptc1 (C, D) and Hhip (E, F) mRNA expression was detected in wild type retinas, but not in orJ retinas. Arrows in (A) and (E) demarcate Gli1 and Hhip expression in the dorsal retina, while closed arrowheads indicate areas of signal outside the retina. In situ hybridization for Vsx2 mRNA (G, H) serves as a control. Open arrowheads in (H) indicate reduced expression of Vsx2 in the extreme periphery of orJ retinas. Ventral is to the left in all panels. Scale bar: 200 µm. C, cornea; EOM, extra-ocular mesenchyme; L, lens; NR, neural retina; RPE, retinal pigmented epithelium; D, dorsal; V, ventral.
The Hh target genes Ptc1 and Hhip are also expressed, albeit weakly, in the central retina of wild type mice, but were not detected in orJ retinas (Fig. 1C–F). Shh and Ptc2 mRNAs were difficult to detect at this age in both genotypes (not shown). Since Vsx2 mRNA is expressed strongly in the orJ retina, we used it as both a positive control for the orJ retinal tissue and a marker of RPCs (Fig. 1G,H). Open arrowheads in Fig. 1H point to reduced Vsx2 expression in the extreme retinal periphery (see below). Taken together, our data indicate Hh signaling is aberrantly absent during this early period of retinal development in orJ mice.
We next examined gene expression patterns at E15.5, a stage of retinal development at which the wave of RGC differentiation has reached the peripheral retina in wild type mice. In situ hybridization reveals Shh expression in the nascent RGC layer, extending to the peripheral retina of wild type mice (arrows, Fig. 2A). However, Shh expression is only observed in the central retina of orJ mice at this age (arrows, Fig. 2B). We also observed a corresponding restriction of Hh target gene expression territories. In wild type mice, expression of the Hh target genes Gli1 and Ptc1 in RPCs extends to the peripheral retina (Fig. 2C,E), similar to the extent of Shh expression. In orJ retinas, however, expression of Gli1 and Ptc1 is centrally restricted (Fig. 2D,F). Ptc2 expression was again difficult to detect in wild type and orJ retinas at this age (data not shown). These gene expression patterns indicate that in orJ mice, unlike wild type mice of the same age, Hh signaling is absent in the peripheral E15.5 retina. In situ hybridization for Vsx2 mRNA (Fig. 2I,J) shows that the absence of peripheral Hh target gene expression is not due to an absence of RPCs with the possible exception of the extreme retinal periphery, where a reduction of Vsx2 expression is correlated with a propensity toward transdifferentiation (open arrowheads in Fig. 1H and Fig. 2J; Horsford et al., 2005; Rowan et al., 2004). Interestingly, these centrally restricted expression territories for Shh and the Hh target genes are reminiscent of those observed for wild type retinas at earlier stages of development (Fig. 1; Dakubo et al., 2003; Wang et al., 2005). Taken together with the E12.5 expression patterns, these findings suggest a delay, both in the expression of Shh and activation of Hh signaling. Consistent with this, Gli1 mRNA and SHH protein expression extend to the peripheral retina in orJ animals by P0 (Fig. 5 and Fig. 7).
Figure 2. Expression patterns of Shh and Hh target genes at E15.5.
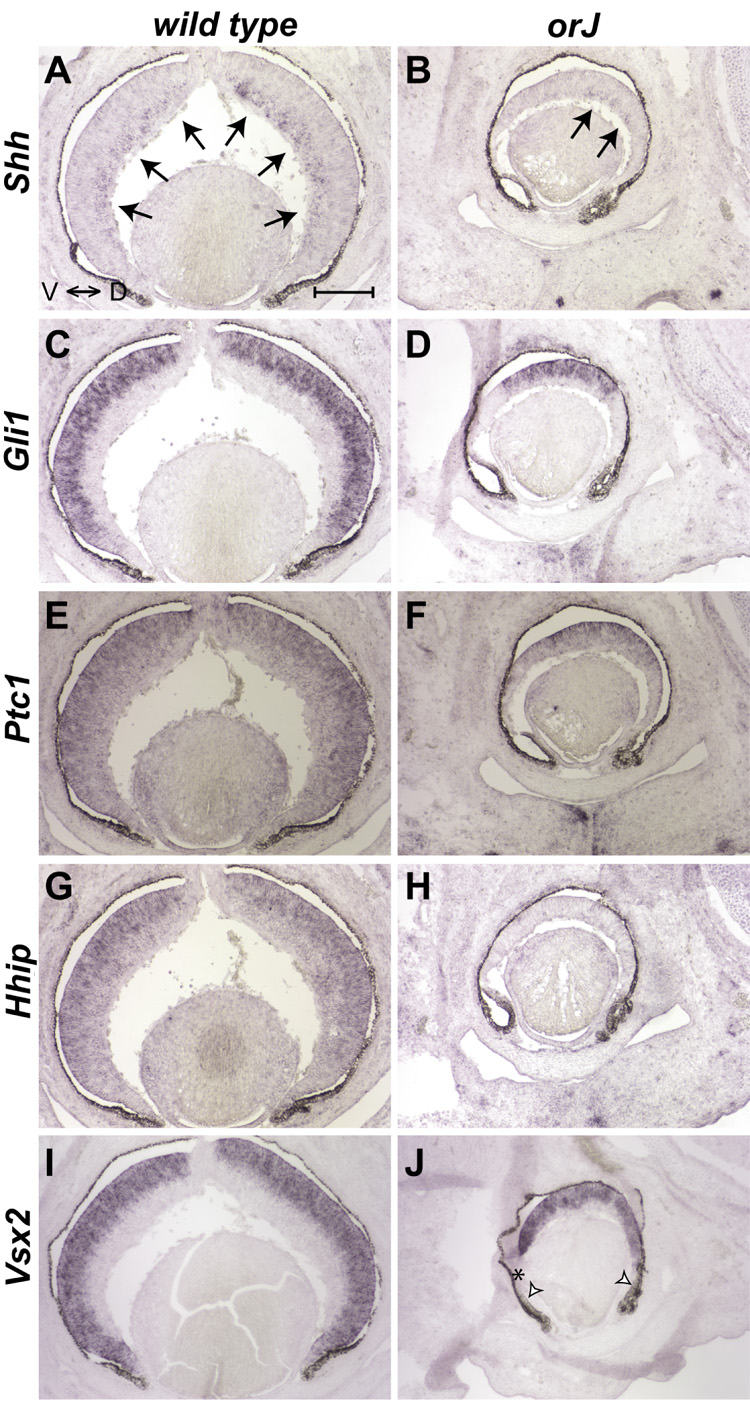
Shh mRNA (A, B) expression extends to the peripheral retina in wild type eyes, but is restricted to the central region in orJ retinas. Areas of retinal expression indicated with arrows. Gli1 (C) and Ptc1 (E) transcripts were also detected in wild type retinas, with expression extending to the peripheral retina. However, their expression in the orJ retina (D, F) was centrally restricted. Hhip mRNA expression was detected in wild type retinas (G), but not in orJ retinas (H). In situ hybridization for Vsx2 mRNA (I, J) serves as a control. Open arrowheads in (J) indicate regions of presumptive transdifferentiated retina. Asterisk in (J) indicates that lack of Vsx2 expression is an artifact due to tissue folding. Ventral is to the left in all panels. Scale bar: 200 µm.
While Gli1 and Ptc1 exhibit altered expression territories in the orJ retina, their levels appear normal where expressed (Fig. 2D,F compared to 2C,E). This indicates that even in the absence of Vsx2, RPCs retain some ability to respond to SHH ligand. However, the expression of another Hh target gene, Hhip, suggests that the response of RPCs to SHH is altered to some extent, even in the central retina of orJ mice. While the pattern of Hhip expression is comparable to those of Gli1 and Ptc1 in the wild type retina, Hhip mRNA is undetectable in orJ retinas (Fig. 2G,H).
The delay in Hh signaling activity correlates with delayed RGC production
Since RPCs have been shown to only respond to RGC-derived SHH in the mouse (Dakubo et al., 2003); and our data) and RGC differentiation is delayed in the orJ retina (Bone-Larson et al., 2000), we sought to determine if Hh signaling activity in the orJ retina correlates with the extent to which the peripherally-spreading wave of RGC differentiation has progressed.
To begin to address this question, retinal sections were examined for Gli1 mRNA expression by in situ hybridization and acetylated class III beta-Tubulin (acTUBB3) by immunohistochemistry on the same sections. Gli1 expression is an indicator of active Hh signaling and acTUBB3 serves as a marker of postmitotic neurons. While acTUBB3+ cells and Gli1 expression extend to the peripheral retina of wild type mice at E15.5 (Fig. 3A–C), orJ retinas at this age exhibit a centrally restricted domain of acTUBB3+ cells (Fig. 3D–F), consistent with delayed neurogenesis in the orJ retina (note: acTUBB3+ cells more peripheral than the solid lines are located within the vitreal space, not the neural retina). Despite this delay, the spatial boundary of Gli1 expression in the orJ retina aligns with, or is slightly more centrally restricted than, the boundary for acTUBB3 immunoreactivity (Fig. 3E,F). These expression patterns are similar to what is observed in the E12.5 wild type retina (Fig. 3G–I), a stage where the initial wave of neurogenesis is still in the process of progressing towards the periphery. We also found that many of the acTUBB3+ cells also expressed POU4F2 (formerly BRN3B), a marker of a major subset of RGCs (Fig. 3J–L). These data indicate that the relationship between activation of the Hh signaling network and RGC differentiation shown for normal retinal development (Wang et al., 2005) is maintained in the orJ retina.
Figure 3. Hh signaling activity correlates with RGC differentiation in both wild type and orJ retinas.
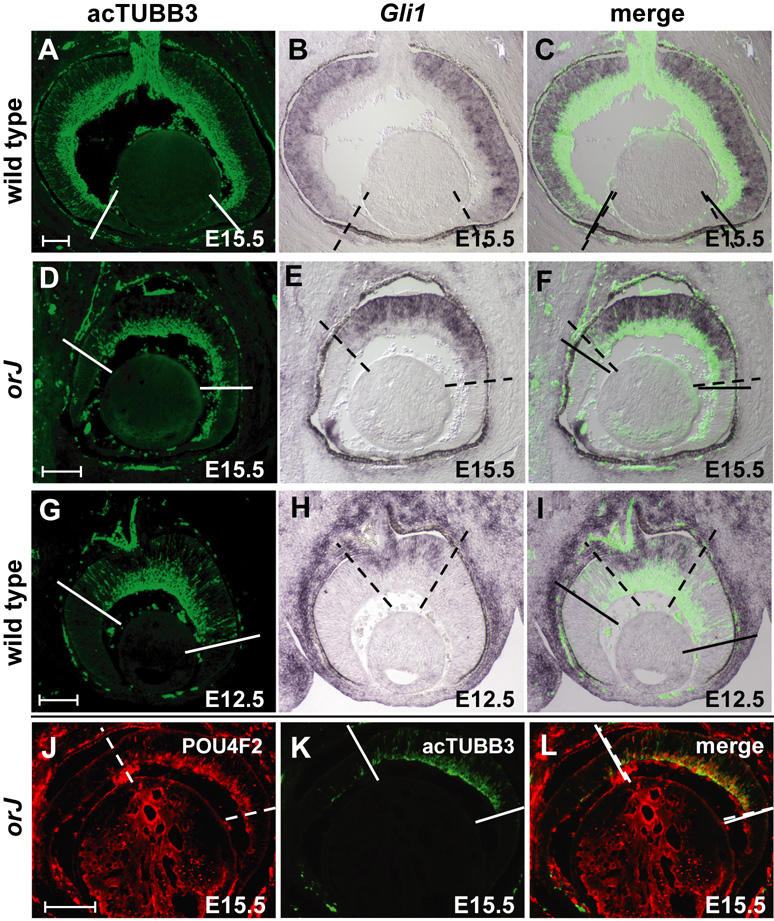
(A–I) Solid and dashed lines indicate the extent of acTUBB3 immunoreactivity and Gli1 mRNA expression, respectively. (A–C) In E15.5 wild type retinas, both acTUBB3 immunoreactivity and Gli1 expression extend to the peripheral retina. (D–F) In E15.5 orJ retinas, both acTUBB3 signal and Gli1 expression are more centrally restricted. Note that acTUBB3-positive cells peripheral to the dashed line in (D) are not located in the retinal neuroepithelium. (G–I) Patterns of acTUBB3 and Gli1 in E12.5 wild type retinas are centrally restricted. (J–L) Expression of POU4F2 in the E15.5 orJ retina correlates well with acTUBB3 staining, indicating that many of the acTUBB3-positive cells are RGCs. Ventral is to the left in all panels. Scale bars: 200 µm for (A–I); 100 µm for (J–L).
To address this further, we sought to determine whether orJ RPCs are competent to respond to SHH ligand prior to the onset of neurogenesis and the appearance of endogenous RGC-derived SHH. To test this, organotypic retinal explants from E12.5 orJ mice were maintained in the presence or absence of recombinant, N-terminal SHH protein (SHH-N) for 24 hr and examined for proliferation and neurogenesis. Proliferation was assessed by BrdU incorporation and neurogenesis was assessed by acTUBB3 immunoreactivity. PCNA was used to assess the relative size of the RPC population since it is a comprehensive marker of RPCs (Barton and Levine, in press). We found that orJ RPCs exhibited a significant increase in BrdU+ cells in response to SHH-N treatment without any apparent changes in the proportion of PCNA+ or acTUBB3+ cells (Fig. 4). These observations indicate that naive orJ RPCs are able to increase proliferation in response to SHH ligand and that SHH-N is acting directly on the RPCs as neurogenesis was not initiated. In sum, our data indicate that the delay in Hh signaling activity negatively impacts proliferation and the delay is primarily the consequence of limited SHH production due to the delay of RGC differentiation in the embryonic orJ retina.
Figure 4. SHH-N treatment promotes proliferation in embryonic organotypic retinal explant cultures from orJ mice.
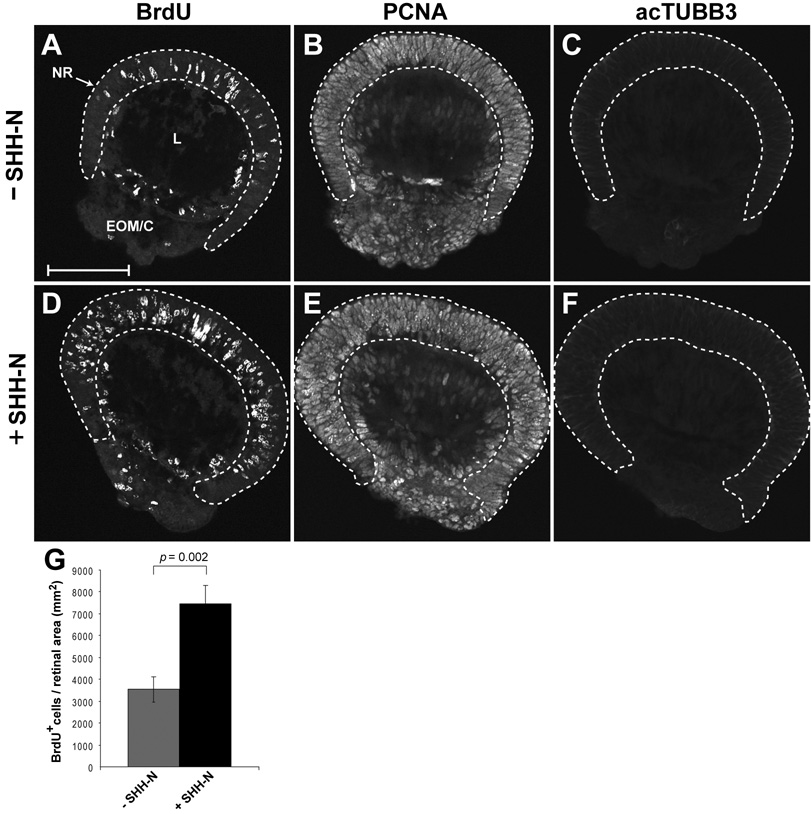
E12.5 explants were cultured in the absence (A–C) or presence (D–F) of SHH-N for 24 hr with BrdU added for the last 30 min. (A, D) BrdU incorporation. (B, E) PCNA immunoreactivity. (C, F) acTUBB3 immunoreactivity. Retinal tissue is contained within the dashed lines. Scale bar: 100 µm. (G) Quantification of BrdU+ cells as a function of retinal area (mm2). Each bar represents the mean ± standard error of the mean (SEM). p values calculated using Student’s paired t-test
Shh signaling is altered in the orJ retina at birth despite the presence of SHH ligand
Reduced proliferation persists in the orJ retina at perinatal ages (Dhomen et al., 2006; Green et al., 2003; Livne-Bar et al., 2006). We therefore wished to determine if Hh signaling is altered at P0. To do this, we examined the expression patterns of Hh target genes by in situ hybridization and determined their relative expression levels by sqRT-PCR.
In situ hybridization shows that Gli1 mRNA is abundantly expressed in RPCs of wild type P0 retinas (Fig. 5A(*)). However, in the orJ retina, Gli1 expression is reduced, patchy and more variable (Fig. 5B(*)). Ptc1 is expressed in the wild type retina, but appears reduced in the orJ retina (Fig. 5C(*),D(*)). Ptc2 mRNA was undetectable in both cases (Fig. 5E(*),F(*)). As at the earlier ages, Hhip expression is obvious in the wild type retina but undetectable in the orJ retina (Fig. 5G(*),H(*)). In situ hybridization for Vsx2 mRNA (Fig. 5I(*),J(*)) serves as a control and reveals strong expression, regardless of genotype.
Figure 5. Expression patterns of Hh target genes at P0.
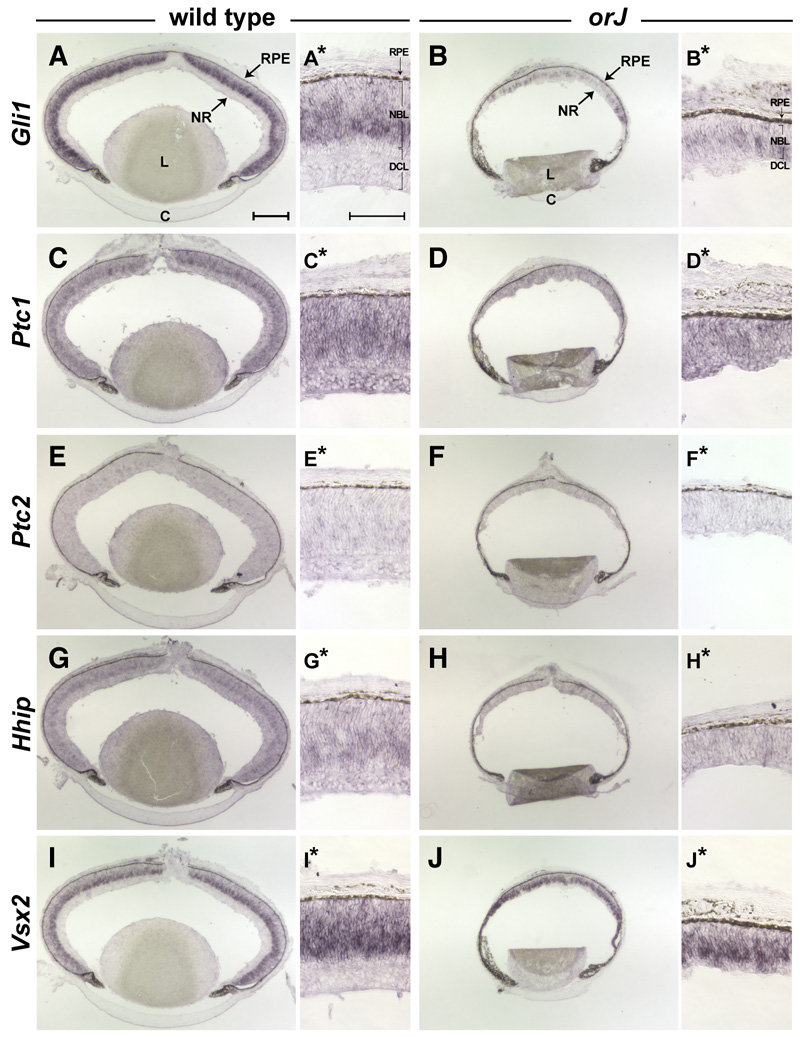
In situ hybridization for the Hh target genes Gli1 (A(*), B(*)) and Ptc1 (C(*), D(*)) reveals reduced expression for both genes in orJ retinas at P0. (E(*), F(*)) Ptc2 mRNA expression is undetectable in either genotype. (G(*), H(*)) Hhip transcript is expressed in wild type retinas, but absent in orJ retinas. (I(*), J(*)) In situ hybridization for Vsx2 mRNA serves as a control. Scale bars: 250 µm (A–J); 40 µm (A*–J*). NBL, neuroblast layer; DCL, differentiated cell layer.
To determine the relative expression levels of the Hh target genes, we performed sqRT-PCR on equivalent amounts of total RNA from P0 wild type and orJ retinas (Fig 6). The relative expression levels of Gli1, Ptc2, Hhip, and Ccnd1 were significantly lower in the orJ retina compared to wild type. Ptc1 was the only target gene that did not show a significant change in expression level.
Figure 6. Quantification of relative expression levels for Hh network components in P0 wild type and orJ retinas by sqRT-PCR.
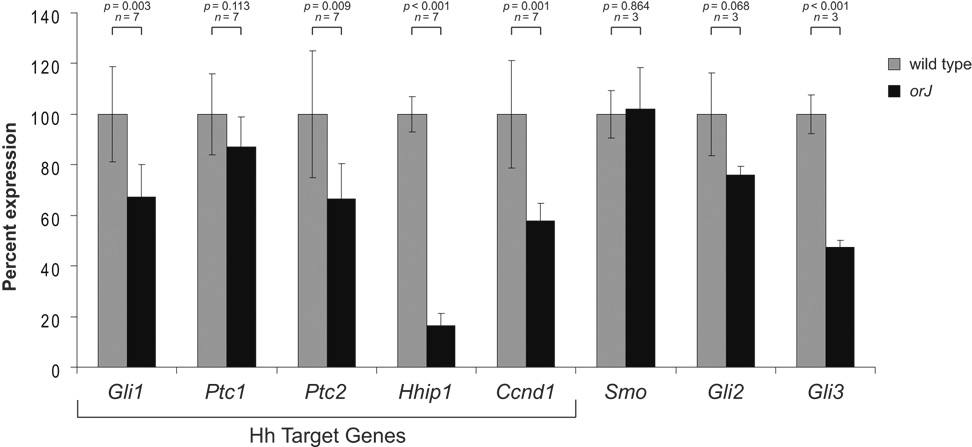
The mean wild type expression level for each gene was set at 100 percent with the orJ level presented as a percent of wild type expression. Hh target genes are those genes whose expression levels are generally considered as indicators of pathway activity‥ Bars represent the mean ± standard deviation. n refers to the number of independently isolated RNA samples. p values calculated by Student’s unpaired t-test or Welch’s two sample t-test, as appropriate (based on results of an F test of variances). See Supplemental Figure S1 for sqRT-PCR optimization curves.
We also examined the expression of Smo, Gli2, and Gli3, essential components of the signaling pathway (Fig. 6; Supplemental Fig. S1). Only Gli3 was significantly downregulated in the orJ retina, although Gli2 exhibited a similar trend. These observations demonstrate that Hh signaling, as measured by the level of target gene expression, is reduced in the newborn orJ retina, and at least one component of the cell-intrinsic portion of the pathway, Gli3, is significantly reduced.
In addition to Hh target genes and important signaling components, we assessed the production and availability of SHH in the retina at P0. We determined the relative levels of Shh mRNA expression by sqRT-PCR and found that its expression is reduced in the newborn orJ retina (Fig. 7A). Pou4f2, which is believed to regulate Shh expression in RGCs (Mu et al., 2004), is expressed at levels that are not significantly different from wild type (Fig. 7A). Western blots show strong SHH expression in the orJ retinas, although it may be expressed at reduced levels compared to wild type (Fig. 7B; Supplemental Fig. S2). Immunohistochemistry reveals that SHH protein is localized to the nascent RGC layer, with expression extending to the peripheral retina (Fig. 7C–F; Supplemental Fig. S2). Together, these experiments show that SHH ligand is expressed in the newborn orJ retina in a manner similar to wild type, although the RT-PCR and western blot data indicate a reduced level of expression.
Figure 7. Shh expression at P0.
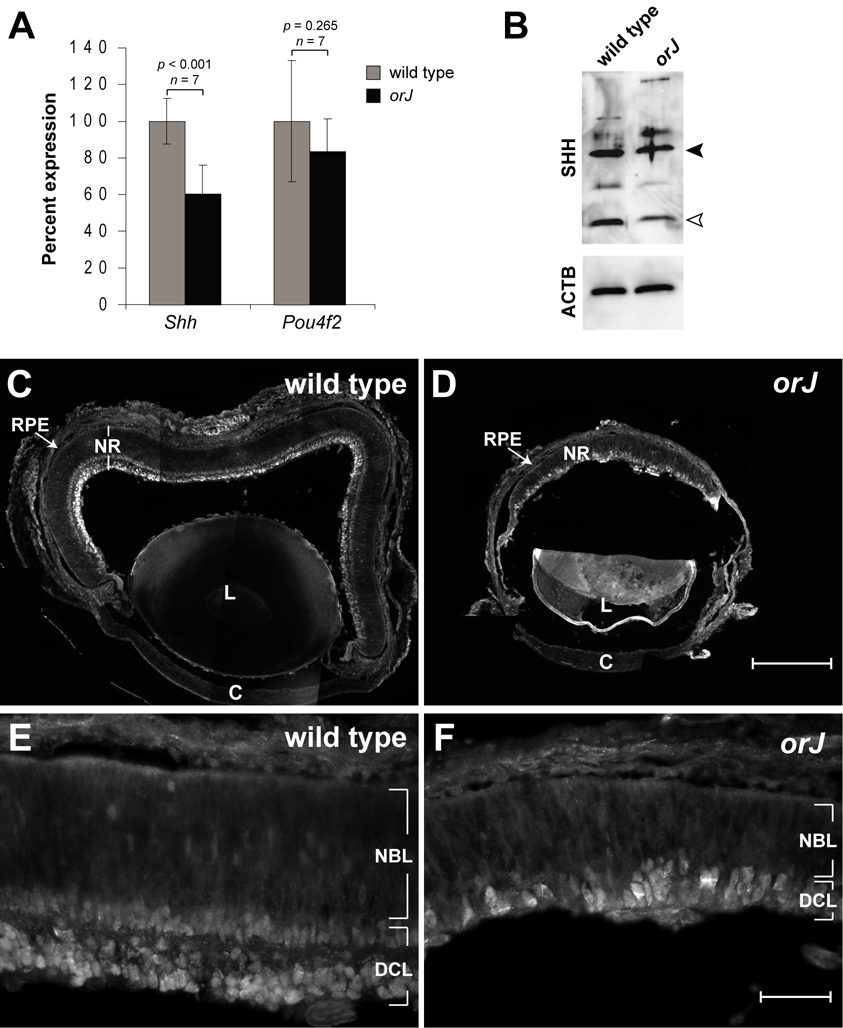
(A) Relative expression levels of Shh and Pou4f2 mRNAs in wild type and orJ retinas as determined by sqRT-PCR. Bars represent the mean ± standard deviation. n and p values are defined as described in Fig. 6. (B) Relative expression of SHH protein in wild type and orJ retinal protein lysates. Closed arrowhead points to band consistent with size of full-length SHH and open arrowhead points to band consistent with size of the N-terminal fragment of SHH. Blot was reprobed to show ACTB expression as an independent measure for protein loading. (C–F) Spatial expression of SHH protein in wild type and orJ eyes. Scale bars: 200 µm for (C, D); 50 µm for (E, F). See Supplemental Figure S2 for anti-SHH immunoreactivity controls.
Neonatal orJ RPCs respond to exogenous and endogenous SHH in explant cultures
To determine if neonatal orJ RPCs are able to respond to exogenous SHH, we treated P0 retinal explants with SHH-N for 24 hr and assayed for proliferation. We observed significant increases in BrdU+ and pHH3+ cells in SHH-N treated explants compared to untreated explants from both wild type (Fig. 8A,B,D,E,G,H; Supplemental Table 1) and orJ mice (Fig. 8J,K,M,N,P,Q; Supplemental Table 2). Similarly, western blot analyses revealed that an 8 hr exposure of SHH-N was also sufficient to increase CCND1 protein levels, regardless of genotype (Fig. 9). These observations demonstrate that despite evidence of attenuated endogenous Hh signaling in vivo, orJ RPCs can increase proliferation in response to exogenous SHH. Interestingly, the relative proportion of PCNA+ cells did not change in either genotype (Fig. 8C,F,I,L,O.R; Supplemental Tables 1 and 2), suggesting that SHH-N stimulates cell cycle progression in RPCs rather than changing the rate of cell cycle exit (see Discussion).
Figure 8. SHH-N treatment promotes proliferation in neonatal explants within 24 hr.
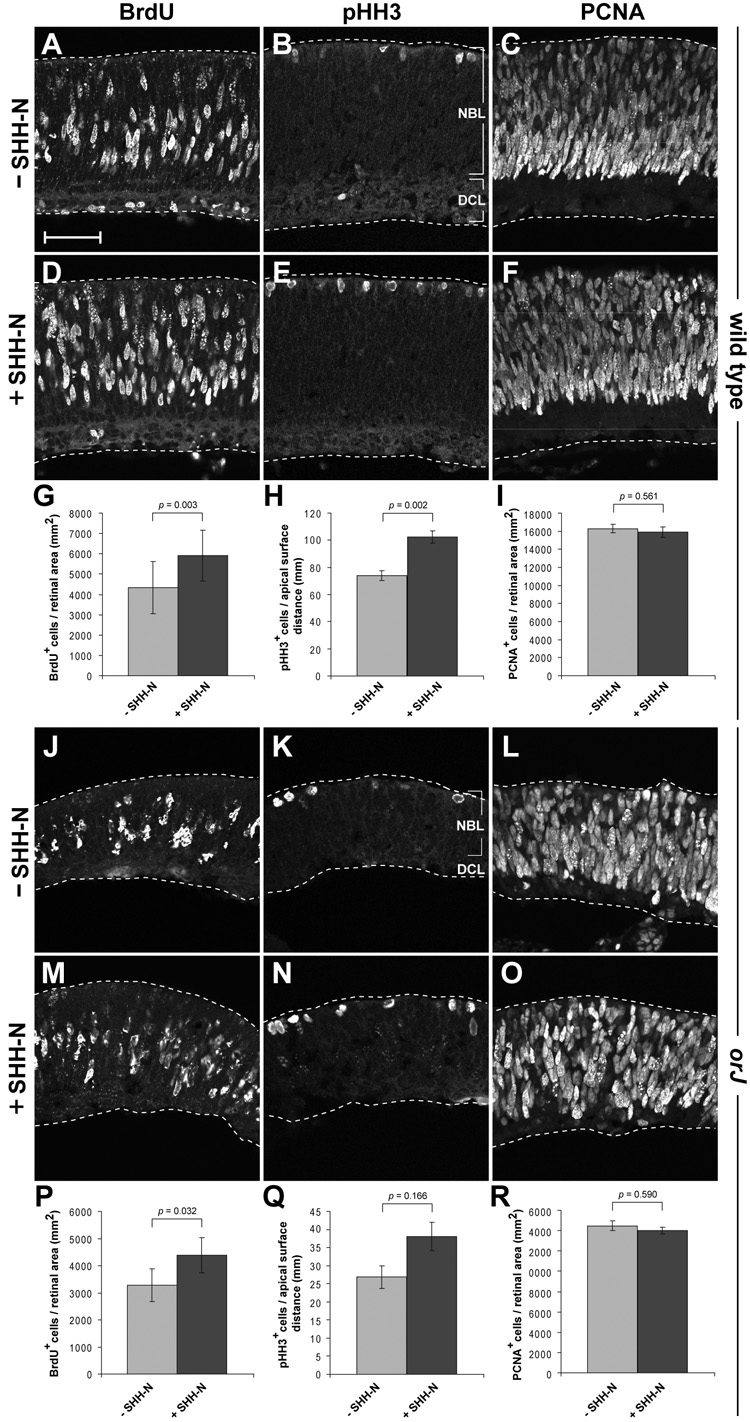
BrdU (A, D), pHH3 (B, E), and PCNA (C, F) immunoreactivity in wild type explants after 24 hr in culture. Quantification of BrdU+ (G), pHH3+ (H), and PCNA+ (I) cells in wild type explants as a function of retinal area (G, I) and length of the apical surface of the retina (H). BrdU (J, M), pHH3 (K, N), and PCNA (L, O) immunoreactivity in orJ explants after 24 hr in culture. Quantification of BrdU+ (P), pHH3+ (Q), and PCNA+ (R) cells in wild type explants as a function of retinal area (P, R) and length of the apical surface of the retina (Q). Bars represent mean ± SEM. p values calculated using Student’s paired t-test. Scale bar: 50 µm.
Figure 9. CCND1 expression in retinal explants after 8 hr of culture.
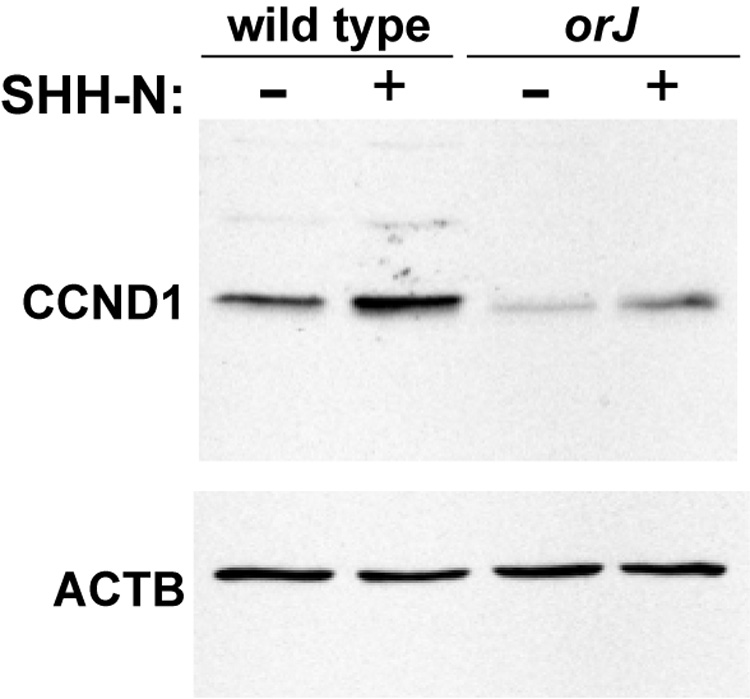
Western blot of total retinal protein isolated from retinal explants cultured in the presence (+) or absence (−) of SHH-N and probed with anti-CCND1. Blot was reprobed with anti-ACTB.
To assess whether the SHH-N mediated proliferative response correlated with stimulation of the Hh signaling pathway, we examined the expression of Hh target genes after culturing P0 retinal explants in the presence or absence of SHH-N for 8 hr by sqRT-PCR (Fig. 10; Table 1 and Table 2). Regardless of genotype, we observed that SHH-N treatment generally resulted in elevated expression levels of Hh target genes when compared to untreated explants after 8 hr (Fig. 10; Table 1). When compared to the baseline expression levels (t = 0), however, wild type and orJ explants exhibited different behaviors. In wild type explants, SHH-N treatment did not cause gene expression levels to increase in a significant manner over baseline levels, whereas in explants not exposed to SHH-N, gene expression levels declined (Fig. 10; Table 2). In contrast, orJ explants treated with SHH-N showed elevated gene expression whereas untreated explants showed little change in expression when compared to baseline levels (Fig. 10; Table 2). In sum, these observations show that SHH-N stimulates the Hh signaling pathway in the orJ retina, although the modulations of target gene expression differ between genotypes.
Figure 10. SHH-N treatment stimulates expression of Hh target genes in explant culture.
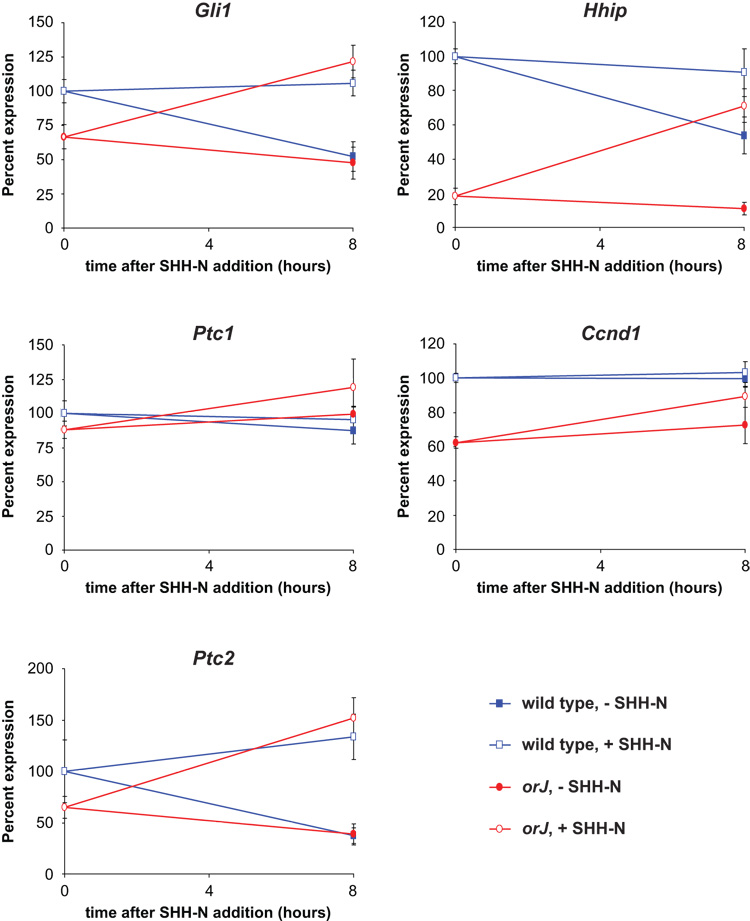
Relative expression levels of Hh target genes from retinal explants after 8 hr in culture. All data points are relative to the wild type expression level at 0 hr (set at 100%). 0 hr is defined as isolated retinal tissue frozen immediately after dissection. The expression level for each genotype at 0 hr is referred to in the text as the baseline expression level. Data points represent the mean ± standard deviation. p-values are provided in Table 1 and Table 2.
Table 1.
Expression level changes due to SHH-N treatment at 8 hr
| transcript | genotype | mean diff. +/− st.dev. 1 | p-value 2 |
|---|---|---|---|
| Ccnd1 | wild type | 249.75 +/− 279.59 | 0.172 |
| orJ | 1058.07 +/− 302.72 | 0.006 | |
| Gli1 | wild type | 1876.94 +/− 447.19 | 0.003 |
| orJ | 2593.01 +/− 691.73 | 0.005 | |
| Ptc1 | wild type | 412.62 +/− 222.30 | 0.034 |
| orJ | 994.47 +/− 1215.65 | 0.20 | |
| Ptc2 | wild type | 780.06 +/− 115.85 | 0.001 |
| orJ | 918.50 +/− 239.46 | 0.005 | |
| Hhip | wild type | 876.37 +/− 208.11 | 0.003 |
| orJ | 1435.12 +/− 187.14 | 0.0006 |
mean is calculated for the differences in pixel area measurements of ethidium bromide stained PCR products run through agarose for SHH-N treated versus untreated explants of each genotype. Samples are paired (n=4).
p-values calculated by paired Student’s t-test.
Table 2.
Relative expression levels at baseline (t=0hr) and 8 hr in culture
| transcript | genotype | baseline1 | − SHH-N1 | p-value2,3 | + SHH-N1 | p-value2,4 |
|---|---|---|---|---|---|---|
| Ccnd1 | wild type | 100 +/− 2.70 | 99.58 +/− 5.03 | 0.89 | 103.50 +/− 6.06 | 0.33 |
| orJ | 62.40 +/− 3.50 | 72.49 +/− 10.50 | 0.12 | 89.11 +/− 6.14 | 0.0003 | |
| Gli1 | wild type | 100 +/− 8.36 | 52.24 +/− 10.99 | 0.0004 | 105.84 +/− 9.25 | 0.38 |
| orJ | 66.75 +/− 8.71 | 47.60 +/− 11.55 | 0.038 | 121.65 +/− 11.93 | 0.0003 | |
| Ptc1 | wild type | 100 +/− 8.99 | 87.32 +/− 9.92 | 0.11 | 95.41 +/− 8.97 | 0.50 |
| orJ | 87.91 +/− 6.11 | 99.40 +/− 5.69 | 0.033 | 118.89 +/− 20.84 | 0.029 | |
| Ptc2 | wild type | 100 +/− 30.30 | 37.26 +/− 7.85 | 0.007 | 133.53 +/− 21.99 | 0.12 |
| orJ | 65.15 +/− 10.66 | 38.74 +/− 10.30 | 0.012 | 152.10 +/− 19.57 | 0.0002 | |
| Hhip | wild type | 100 +/− 4.45 | 53.74 +/− 10.90 | 0.0002 | 90.52 +/− 13.88 | 0.24 |
| orJ | 18.14 +/− 4.88 | 10.95 +/− 3.49 | 0.053 | 71.17 +/− 9.73 | 6.7e-05 |
For each transcript, values +/− st. dev. are normalized to the wild type baseline measurement set at 100 (n=4). Values in − SHH-N and + SHH-N are after 8hr in culture.
Unpaired Student’s t-tests were done to determine if the values derived from samples taken after 8 hr in culture are statistically significant from the baseline values. For each statistical comparison, the 8 hr measurements were compared to the baseline value of the same genotype (p < 0.05 reveals a statistically significant difference).
p-value for comparison between baseline and −SHH-N.
p-value for comparison between baseline and +SHH-N.
While these explant experiments revealed that orJ RPCs are able to respond to exogenous ligand, it remains that Hh target gene expression is substantially reduced in vivo even though endogenous ligand is expressed. Thus, we sought to confirm that orJ RPCs are in fact responding to the endogenous, RGC-derived SHH ligand in vivo by performing two independent analyses. First, we directly compared the P0 patterns of Gli1 mRNA and acTUBB3 on the same retinal sections. As at E15.5 we found the highest levels of Gli1 expression adjacent to acTUBB3-positive cells in both wild type and orJ retinas (data not shown), which is consistent with the idea that signaling is most robust near the cells that produce the ligand. Second, we performed explant cultures of P0 orJ retinas in the presence or absence of cyclopamine, a pharmacological inhibitor of Hh signaling (Chen et al., 2002; Cooper et al., 1998; Frank-Kamenetsky et al., 2002; Incardona et al., 1998; Taipale et al., 2000). After a 16 hr culture period, we found Gli1 expression was reduced in response to cyclopamine treatment (Fig. 11A,C), while Vsx2 expression remained unchanged (Fig. 11B,D). Thus, endogenous Hh signaling activity in the orJ retina is sufficient to promote some level of Hh target gene expression. Furthermore, cyclopamine-treated explants exhibited a reduction in proliferation as indicated by significant reductions in the numbers of BrdU+, pHH3+, and PCNA+ cells as compared to explants treated with vehicle alone (Fig. 11E–M; Supplemental Table 3). These data indicate orJ RPCs are responding to endogenous, RGC-derived SHH, at the levels of target gene expression and proliferation.
Figure 11. Endogenous SHH promotes proliferation in P0 orJ retinas.
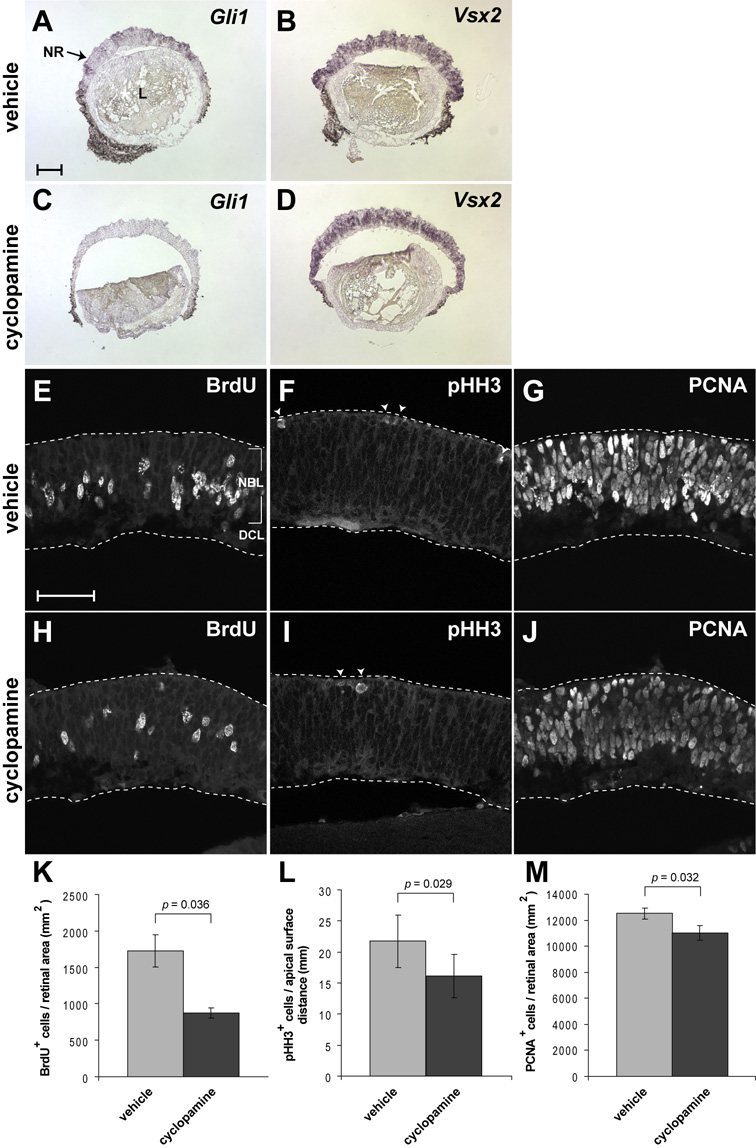
orJ retinal explants were cultured in vehicle alone (0.41% v/v DMSO) or 10 µM cyclopamine (in 0.41% v/v DMSO) for 16 hr (A–D) or 24 hr (E–J). (A, C) Gli1 mRNA expression. (B, D) Vsx2 mRNA expression. BrdU (E, H), pHH3 (F, I), and PCNA (G, J) immunoreactivity. Closed arrowheads in (F, I) indicate pHH3+ cells at the apical surface of the retina. Quantification of BrdU+ (K), pHH3+ (L), and PCNA+ (M) cells as a function of retinal area (K, M) and length of the apical surface of the retina (L). Bars represent mean ± SEM. p values calculated using the Student’s paired t-test. Scale bar: 120 µm (A–D), 50 µm (E–J).
DISCUSSION
In this study, we have elucidated some key elements in the relationship between Vsx2 and Shh in promoting RPC proliferation in the developing retina. At early embryonic stages, a delay in Hh signaling in the orJ retina correlates with a delay in RGC development. At birth, SHH ligand is produced by RGCs and RPCs respond to it, but Hh signaling in the orJ retina occurs at a reduced level compared to wild type. Our observations lead us to propose that Vsx2 has important roles in ensuring the correct timing and magnitude of Hh signaling in the retina, which ultimately contributes to proper execution of the histogenetic program.
Retinal Hh target genes
Our analyses of Hh target gene expression in the mouse retina have revealed several features of their expression and regulation in this tissue. We have presented the first documented expression of Hhip in the retina, as well as information regarding its transcriptional regulation in RPCs in response to SHH, thereby revealing its usefulness as an indicator of Hh signaling activity in the mouse retina. Gli1, Ptc2, and Hhip are all highly responsive Hh target genes in the retina. High levels of their expression are dependent upon active Hh signaling, as evidenced by the large expression difference between SHH-N treated and untreated explants within a short culture period. Although Ptc1 expression is a useful indicator of Hh signaling activity in other systems, we found Ptc1 to be relatively unresponsive to changes in the level of retinal Hh signaling activity. Ptc1 exhibits little to no change in expression after explant culturing in the presence or absence of SHH-N. Furthermore, while reduced expression of the other analyzed Hh target genes indicates reduced Hh signaling in the orJ retina, Ptc1 expression is not significantly different across genotypes. Our findings are consistent with observations made in other retinal explant cultures (Wang et al., 2002) and in the Pou4f2−/− retina, which exhibits reduced Shh expression (Mu et al., 2004).
The delays in Shh expression and Hh signaling activity in the orJ retina are a consequence of delayed RGC differentiation during embryonic development
Our gene expression studies of components of the Hh signaling network revealed drastically altered mRNA expression territories for Shh and the Hh target genes Gli1, Ptc1, and Hhip in the orJ retina during embryonic stages. The lack of expression at E12.5 and centrally restricted expression patterns observed in orJ retinas at E15.5 are reminiscent of the wild type expression patterns observed for earlier ages (our data; (Dakubo et al., 2003; Wang et al., 2005)). However, at birth, the expression territories (most notably SHH and Gli1) extend to the peripheral retina, similar to wild type. Based on these observations, we conclude that the central-to-peripheral wave of Shh expression and Hh signaling still occurs in the orJ retina, but is delayed.
RGC differentiation is also delayed in the orJ retina (Bone-Larson et al., 2000), and our data are consistent with central-to-peripheral waves of Shh and Hh target gene expression following a peripherally-spreading wave of RGC differentiation (Wang et al., 2005). It appears then, that the relationship between Hh signaling and RGC differentiation is maintained in the orJ retina. Thus, the limited spatial extent of Hh signaling activity during embryonic retinal development may be due, in large part, to the altered availability of SHH ligand, owing to a developmental delay in its cellular source, the RGCs.
Extra-retinal sources of Hh ligands, such as Ihh (Dakubo et al., 2003; Levine et al., 1997), are expressed during the early embryonic period, and the high level of Gli1 expression in the periocular mesenchyme of the orJ mouse suggests they are still present. Even so, they do not activate Hh signaling in the retina. This is consistent with previous findings that the only source of Hh ligand to which RPCs respond is RGC-derived Shh (Dakubo et al., 2003).
This delay in RGC differentiation limits the exposure of RPCs to SHH, which could contribute to the proliferation deficiency characteristic of orJ RPCs, since proliferation is an established response of RPCs to Hh signaling. Consistent with this idea is our finding that naïve orJ RPCs are competent to respond to stimulation of the Hh pathway. Additionally, mouse models in which RGCs either fail to mature (Brown et al., 2001; Le et al., 2006; Mu et al., 2004), are ablated with toxin (Mu et al., 2005), or do not express Shh (Wang et al., 2005; Wang et al., 2002) exhibit decreased RPC proliferation. The sum of these observations supports a model in which the proliferative expansion of the embryonic retina is mechanistically dependent on the production of RGCs (Mu et al., 2005) and perhaps more generally, on the production of postmitotic cells. The delay in RGC differentiation in the orJ retina may also limit the availability of other mitogens, such as GDF8/myostatin (Mu et al., 2004) and VEGF (Hashimoto et al., 2006; Yang and Cepko, 1996). How Vsx2 contributes to the correct timing for the onset of RGC production is not known.
Reduced Hh signaling and proliferative expansion in the neonatal orJ retina
In addition to the changes observed in the embryonic retina, our analysis of several Hh target genes reveals that Hh signaling remains reduced in the neonatal orJ retina, even though signaling is activated by E15.5 and extends out to the peripheral retina by birth. Since the proportions of the wild type and orJ RPC populations relative to their total cell populations do not differ at P0 (Green et al., 2003), the reductions in Hh target gene expression in the orJ retina are likely due to changes in gene regulation rather than to changes in cell composition. This conclusion is supported by our observation that SHH-N treatment significantly enhances Hh target gene expression within 8 hr.
How might Hh signaling influence orJ RPCs? Our explant experiments indicate that the role of Hh signaling is complex. SHH-N treatment increased the relative proportions of cells in S and M phases (as measured by BrdU and pHH3 immunoreactivity) without influencing the relative proportion of RPCs as indicated by PCNA immunoreactivity (Barton and Levine, in press). These observations suggest that the primary influence of SHH-N is to shorten the time orJ RPCs spend in G1 and/or G2. While cyclopamine treatment had the opposite effect on the relative proportions of BrdU+ and pHH3+ cells, it also caused a reduction in the orJ RPC population as inferred by the decrease in PCNA+ cells. In this case, the reduced proliferation could be due to prolongation of the G1 and/or G2 phases in addition to enhanced cell cycle exit. Taken together, it appears then, that a high level of Hh signaling primarily influences cell cycle progression in orJ RPCs whereas a low level of Hh signaling may help to maintain the orJ RPC population. Consistent with these ideas are the findings that the orJ RPC population is at the correct proportion at birth (Green et al., 2003; unpublished observations), that the cell cycle time of orJ RPCs is longer than wild type and is primarily due to an increase in G1 time (Konyukhov and Sazhina, 1971; unpublished observations), and Hh signaling is active, but at a reduced level in the orJ retina (this paper). In sum, we propose that Hh signaling is likely a limiting factor for the proliferative expansion of orJ RPCs. Thus, in addition to any direct roles Vsx2 has in regulating cell cycle progression and other aspects of RPC behavior, we propose that reduced signaling in at least one growth factor pathway also contributes to the proliferation problems characteristic of the orJ retina.
Hh signaling is tightly controlled at almost every step of the pathway, from ligand production to activity of the transcriptional effectors. Changes in any of these processes impact the level of signaling activity (Cohen, 2003; Ingham, 1998; Ingham and McMahon, 2001; Nybakken and Perrimon, 2002; Varjosalo and Taipale, 2007). Our expression data revealed that the expression of Shh mRNA and protein are reduced in the orJ retina at P0. Whether these drops in expression are sufficient to completely account for the level of reduced signaling is unclear. Interestingly, orJ cells that expressed SHH appeared to do so in a robust manner. Since processing and secretion of HH ligands are under complex control and defects in these mechanisms could also contribute to reduced signaling levels, it is possible that problems of this nature are further limiting the exposure of SHH to orJ RPCs. Importantly, alterations in Hh signaling and proliferation due to reduced expression or to problems in processing or secretion indicate that non-cell autonomous changes may contribute to the orJ phenotype since Chx10 is not expressed in RGCs.
Although reduced ligand production likely contributes to the diminished levels of Hh signaling in the orJ retina, there is also ample precedence for the involvement of extracellular molecules in modulating the magnitude of Hh signaling through their influence on ligand dispersion and/or reception (Cohen, 2003; Ingham, 1998; Ingham and McMahon, 2001; Nybakken and Perrimon, 2002; Varjosalo and Taipale, 2007). In addition to being transcriptional targets, Hhip and Ptc2 are also extracellular regulators of Hh signaling. Their reduced expression in the orJ retina, however, is not likely to account for the changes in Hh signaling levels. Hhip functions as a negative regulator resulting in attenuated Hh signaling (Chuang et al., 2003; Chuang and McMahon, 1999). Thus, its expression change is counter to Hhip being a mechanistic explanation of reduced Hh signaling in the orJ retina. Although Ptc2 exhibits high binding affinity for Hh ligands (Carpenter et al., 1998), it lacks the ability to mediate SHH-stimulated signaling and inhibits SHH function (Rahnama et al., 2004). Based on these findings, Ptc2 also functions as a negative regulator. Thus, although it appears that reduced Hhip and Ptc2 expression cannot explain the reduced levels of Hh signaling in the orJ retina, they do provide strong evidence that a change in Hh signaling is occurring. Gas1, a GPI-anchored membrane protein, is negatively regulated by Hh signaling (Allen et al., 2007) and is upregulated in the embryonic orJ retina (Rowan et al., 2004). Whether this elevated expression is the result of reduced Hh signaling or an unrelated change caused by the absence of Vsx2 is not known. Additionally, since Gas1 can act as a positive (Allen et al., 2007; Lee et al., 2001b; Liu et al., 2002; Liu et al., 2001) or negative (Cobourne et al., 2004; Lee et al., 2001a) regulator of Hh signaling, it is difficult to predict the consequences of its change in expression.
Changes in the intracellular portion of the pathway could also alter Hh signaling, but whether these types of changes are causal factors for reduced signaling and proliferation is unclear. We found that cyclopamine treatment further reduced Gli1 expression and proliferation, and SHH-N treatment stimulated target gene expression and proliferation. While these findings demonstrate that the intracellular portion of the Hh pathway is functional in the orJ retina, we cannot conclude that the response observed in the orJ explants is equivalent to a ‘wild type response’. This is because the behavior of orJ and wild type explants are qualitatively different. Wild type explants treated with SHH-N exhibit maintenance of their baseline expression levels for most target genes, indicating that wild type RPCs are responding maximally. Furthermore, target gene expression in wild type explants not exposed to SHH-N drop below baseline levels, indicating that continuous exposure to ligand is necessary to sustain expression levels. In contrast, orJ explants exposed to SHH-N show stimulation above baseline levels and most target genes do not drop below baseline levels in untreated explants. Furthermore, since the baseline levels of Hh regulators and cell intrinsic effectors differ in the orJ retina compared to wild type (e.g. Gli1, Ptc2, Hhip, Gli3), a direct comparison of the quality of response to SHH-N between the orJ and wild type RPCs is not easily accomplished. Thus, while our data shows that the intrinsic portion of the Hh pathway is functioning in orJ RPCs, it is possible that alterations in this part of the pathway are also causing changes in RPC behavior.
In sum, our data provide evidence for a model in which Vsx2 promotes RPC proliferation in a non-cell autonomous manner by ensuring proper RGC differentiation and Hh signaling during embryonic retinal development, which is in addition to its cell autonomous functions in RPCs. Furthermore, we propose that Hh signaling is a limiting factor for RPC proliferation in the absence of Vsx2. While Shh expression is reduced in the orJ retina, the loss of Vsx2 may also impact the Hh pathway downstream of ligand expression, by altering the expression of components of the Hh signaling network, or by maintaining an environment in which RPCs can respond appropriately to SHH ligand. While more work is needed to identify the molecular mechanisms by which Vsx2 regulates RPC proliferation, our work highlights the complex interactions between the tissue-restricted cell-intrinsic factor Vsx2 and Hh signaling, in their contributions to the proliferative expansion of cell number during retinal histogenesis.
Supplementary Material
ACKNOWLEDGMENTS
We thank Dr. Henk Roelink, University of Washington, for SHH-N protein and Dr. Valerie Wallace, Ottawa Health Research Institute, Canada, for Hh network-related plasmids. We also thank Drs. Sabine Fuhrmann, Scott Kuwada, Henk Roelink, and Sen Wu for advice regarding antibodies.
We thank Drs. Sabine Fuhrmann, Henk Roelink, and Tom Reh for critical reading of the manuscript and members of the Fuhrmann and Levine laboratories, especially Todd Raleigh and Amy Kircher, for their insights and assistance.
Funding Support: Career Development Award to E.M.L. from Research to Prevent Blindness, Inc., Foundation Fighting Blindness, and the National Eye Institute (EY013760); NEI Vision Core Grant (EY0014800); Ruth Kirchstein NRSA from the NEI to E.S.G.
Footnotes
Publisher's Disclaimer: This is a PDF file of an unedited manuscript that has been accepted for publication. As a service to our customers we are providing this early version of the manuscript. The manuscript will undergo copyediting, typesetting, and review of the resulting proof before it is published in its final citable form. Please note that during the production process errors may be discovered which could affect the content, and all legal disclaimers that apply to the journal pertain.
REFERENCES
- Allen BL, et al. The Hedgehog-binding proteins Gas1 and Cdo cooperate to positively regulate Shh signaling during mouse development. Genes Dev. 2007;21:1244–1257. doi: 10.1101/gad.1543607. [DOI] [PMC free article] [PubMed] [Google Scholar]
- Bar-Yosef U, et al. CHX10 mutations cause non-syndromic microphthalmia/anophthalmia in Arab and Jewish kindreds. Hum Genet. 2004;115:302–309. doi: 10.1007/s00439-004-1154-2. [DOI] [PubMed] [Google Scholar]
- Barton KM, Levine EM. Expression patterns and cell cycle profiles of PCNA, MCM6, Cyclin D1, Cyclin A2, Cyclin B1, and phosphorylated Histone H3 in the developing mouse retina. Dev Dyn. 2008 doi: 10.1002/dvdy.21449. In press. [DOI] [PubMed] [Google Scholar]
- Belecky-Adams T, et al. Pax-6, Prox 1, and Chx10 homeobox gene expression correlates with phenotypic fate of retinal precursor cells. Invest Ophthalmol Vis Sci. 1997;38:1293–1303. [PubMed] [Google Scholar]
- Bone-Larson C, et al. Partial rescue of the ocular retardation phenotype by genetic modifiers. J Neurobiol. 2000;42:232–247. doi: 10.1002/(sici)1097-4695(20000205)42:2<232::aid-neu7>3.0.co;2-4. [DOI] [PubMed] [Google Scholar]
- Brown NL, et al. Math5 is required for retinal ganglion cell and optic nerve formation. Development. 2001;128:2497–2508. doi: 10.1242/dev.128.13.2497. [DOI] [PMC free article] [PubMed] [Google Scholar]
- Burmeister M, et al. Ocular retardation mouse caused by Chx10 homeobox null allele: impaired retinal progenitor proliferation and bipolar cell differentiation. Nat Genet. 1996;12:376–384. doi: 10.1038/ng0496-376. [DOI] [PubMed] [Google Scholar]
- Carpenter D, et al. Characterization of two patched receptors for the vertebrate hedgehog protein family. Proc Natl Acad Sci U S A. 1998;95:13630–13634. doi: 10.1073/pnas.95.23.13630. [DOI] [PMC free article] [PubMed] [Google Scholar]
- Chen JK, et al. Inhibition of Hedgehog signaling by direct binding of cyclopamine to Smoothened. Genes Dev. 2002;16:2743–2748. doi: 10.1101/gad.1025302. [DOI] [PMC free article] [PubMed] [Google Scholar]
- Chuang PT, et al. Feedback control of mammalian Hedgehog signaling by the Hedgehog-binding protein, Hip1, modulates Fgf signaling during branching morphogenesis of the lung. Genes Dev. 2003;17:342–347. doi: 10.1101/gad.1026303. [DOI] [PMC free article] [PubMed] [Google Scholar]
- Chuang PT, McMahon AP. Vertebrate Hedgehog signalling modulated by induction of a Hedgehog-binding protein. Nature. 1999;397:617–621. doi: 10.1038/17611. [DOI] [PubMed] [Google Scholar]
- Clark AM, et al. Negative regulation of Vsx1 by its paralog Chx10/Vsx2 is conserved in the vertebrate retina. Brain Research. 2008;1192:99–113. doi: 10.1016/j.brainres.2007.06.007. [DOI] [PMC free article] [PubMed] [Google Scholar]
- Cobourne MT, et al. Restriction of sonic hedgehog signalling during early tooth development. Development. 2004;131:2875–2885. doi: 10.1242/dev.01163. [DOI] [PubMed] [Google Scholar]
- Cohen MM., Jr The hedgehog signaling network. Am J Med Genet A. 2003;123:5–28. doi: 10.1002/ajmg.a.20495. [DOI] [PubMed] [Google Scholar]
- Cooper MK, et al. Teratogen-mediated inhibition of target tissue response to Shh signaling. Science. 1998;280:1603–1607. doi: 10.1126/science.280.5369.1603. [DOI] [PubMed] [Google Scholar]
- Dakubo GD, Wallace VA. Hedgehogs and retinal ganglion cells: organizers of the mammalian retina. Neuroreport. 2004;15:479–482. doi: 10.1097/00001756-200403010-00019. [DOI] [PubMed] [Google Scholar]
- Dakubo GD, et al. Retinal ganglion cell-derived sonic hedgehog signaling is required for optic disc and stalk neuroepithelial cell development. Development. 2003;130:2967–2980. doi: 10.1242/dev.00515. [DOI] [PubMed] [Google Scholar]
- Dhomen NS, et al. Absence of chx10 causes neural progenitors to persist in the adult retina. Invest Ophthalmol Vis Sci. 2006;47:386–396. doi: 10.1167/iovs.05-0428. [DOI] [PMC free article] [PubMed] [Google Scholar]
- Donovan SL, Dyer MA. Regulation of proliferation during central nervous system development. Semin Cell Dev Biol. 2005;16:407–421. doi: 10.1016/j.semcdb.2005.02.012. [DOI] [PubMed] [Google Scholar]
- Dorval KM, et al. CHX10 targets a subset of photoreceptor genes. J Biol Chem. 2006;281:744–751. doi: 10.1074/jbc.M509470200. [DOI] [PubMed] [Google Scholar]
- Ferda Percin E, et al. Human microphthalmia associated with mutations in the retinal homeobox gene CHX10. Nat Genet. 2000;25:397–401. doi: 10.1038/78071. [DOI] [PubMed] [Google Scholar]
- Frank-Kamenetsky M, et al. Small-molecule modulators of Hedgehog signaling: identification and characterization of Smoothened agonists and antagonists. J Biol. 2002;1:10. doi: 10.1186/1475-4924-1-10. [DOI] [PMC free article] [PubMed] [Google Scholar]
- Green ES, et al. Genetic rescue of cell number in a mouse model of microphthalmia: interactions between Chx10 and G1-phase cell cycle regulators. Development. 2003;130:539–552. doi: 10.1242/dev.00275. [DOI] [PubMed] [Google Scholar]
- Hashimoto T, et al. VEGF activates divergent intracellular signaling components to regulate retinal progenitor cell proliferation and neuronal differentiation. Development. 2006;133:2201–2210. doi: 10.1242/dev.02385. [DOI] [PMC free article] [PubMed] [Google Scholar]
- Hatakeyama J, et al. Roles of homeobox and bHLH genes in specification of a retinal cell type. Development. 2001;128:1313–1322. doi: 10.1242/dev.128.8.1313. [DOI] [PubMed] [Google Scholar]
- Ho KS, Scott MP. Sonic hedgehog in the nervous system: functions, modifications and mechanisms. Curr Opin Neurobiol. 2002;12:57–63. doi: 10.1016/s0959-4388(02)00290-8. [DOI] [PubMed] [Google Scholar]
- Horsford DJ, et al. Chx10 repression of Mitf is required for the maintenance of mammalian neuroretinal identity. Development. 2005;132:177–187. doi: 10.1242/dev.01571. [DOI] [PubMed] [Google Scholar]
- Incardona JP, et al. The teratogenic Veratrum alkaloid cyclopamine inhibits sonic hedgehog signal transduction. Development. 1998;125:3553–3562. doi: 10.1242/dev.125.18.3553. [DOI] [PubMed] [Google Scholar]
- Ingham PW. Transducing Hedgehog: the story so far. Embo J. 1998;17:3505–3511. doi: 10.1093/emboj/17.13.3505. [DOI] [PMC free article] [PubMed] [Google Scholar]
- Ingham PW, McMahon AP. Hedgehog signaling in animal development: paradigms and principles. Genes Dev. 2001;15:3059–3087. doi: 10.1101/gad.938601. [DOI] [PubMed] [Google Scholar]
- Jensen AM, Wallace VA. Expression of Sonic hedgehog and its putative role as a precursor cell mitogen in the developing mouse retina. Development. 1997;124:363–371. doi: 10.1242/dev.124.2.363. [DOI] [PubMed] [Google Scholar]
- Konyukhov BV, Sazhina MV. Genetic control over the duration of G 1 phase. Experientia. 1971;27:970–971. doi: 10.1007/BF02135780. [DOI] [PubMed] [Google Scholar]
- Le TT, et al. Math5 is required for both early retinal neuron differentiation and cell cycle progression. Dev Biol. 2006;295:764–778. doi: 10.1016/j.ydbio.2006.03.055. [DOI] [PubMed] [Google Scholar]
- Lee CS, et al. Evidence that the WNT-inducible growth arrest-specific gene 1 encodes an antagonist of sonic hedgehog signaling in the somite. Proc Natl Acad Sci U S A. 2001a;98:11347–11352. doi: 10.1073/pnas.201418298. [DOI] [PMC free article] [PubMed] [Google Scholar]
- Lee CS, et al. Transdifferentiation of the ventral retinal pigmented epithelium to neural retina in the growth arrest specific gene 1 mutant. Dev Biol. 2001b;236:17–29. doi: 10.1006/dbio.2001.0280. [DOI] [PubMed] [Google Scholar]
- Levine EM, Green ES. Cell-intrinsic regulators of proliferation in vertebrate retinal progenitors. Semin Cell Dev Biol. 2004;15:63–74. doi: 10.1016/j.semcdb.2003.09.001. [DOI] [PubMed] [Google Scholar]
- Levine EM, et al. Sonic hedgehog promotes rod photoreceptor differentiation in mammalian retinal cells in vitro. J Neurosci. 1997;17:6277–6288. doi: 10.1523/JNEUROSCI.17-16-06277.1997. [DOI] [PMC free article] [PubMed] [Google Scholar]
- Liu Y, et al. Growth arrest specific gene 1 acts as a region-specific mediator of the Fgf10/Fgf8 regulatory loop in the limb. Development. 2002;129:5289–5300. doi: 10.1242/dev.129.22.5289. [DOI] [PubMed] [Google Scholar]
- Liu Y, et al. Growth arrest specific gene 1 is a positive growth regulator for the cerebellum. Dev Biol. 2001;236:30–45. doi: 10.1006/dbio.2000.0146. [DOI] [PubMed] [Google Scholar]
- Livesey FJ, Cepko CL. Vertebrate neural cell-fate determination: lessons from the retina. Nat Rev Neurosci. 2001;2:109–118. doi: 10.1038/35053522. [DOI] [PubMed] [Google Scholar]
- Livne-Bar I, et al. Chx10 is required to block photoreceptor differentiation but is dispensable for progenitor proliferation in the postnatal retina. Proc Natl Acad Sci U S A. 2006;103:4988–4993. doi: 10.1073/pnas.0600083103. [DOI] [PMC free article] [PubMed] [Google Scholar]
- Locker M, et al. Hedgehog signaling and the retina: insights into the mechanisms controlling the proliferative properties of neural precursors. Genes Dev. 2006;20:3036–3048. doi: 10.1101/gad.391106. [DOI] [PMC free article] [PubMed] [Google Scholar]
- Moshiri A, Reh TA. Persistent progenitors at the retinal margin of ptc+/− mice. J Neurosci. 2004;24:229–237. doi: 10.1523/JNEUROSCI.2980-03.2004. [DOI] [PMC free article] [PubMed] [Google Scholar]
- Mu X, et al. Discrete gene sets depend on POU domain transcription factor Brn3b/Brn-3.2/POU4f2 for their expression in the mouse embryonic retina. Development. 2004;131:1197–1210. doi: 10.1242/dev.01010. [DOI] [PubMed] [Google Scholar]
- Mu X, et al. Ganglion cells are required for normal progenitor- cell proliferation but not cell-fate determination or patterning in the developing mouse retina. Curr Biol. 2005;15:525–530. doi: 10.1016/j.cub.2005.01.043. [DOI] [PubMed] [Google Scholar]
- Nybakken K, Perrimon N. Hedgehog signal transduction: recent findings. Curr Opin Genet Dev. 2002;12:503–511. doi: 10.1016/s0959-437x(02)00333-7. [DOI] [PubMed] [Google Scholar]
- Oliver TG, et al. Transcriptional profiling of the Sonic hedgehog response: a critical role for N-myc in proliferation of neuronal precursors. Proc Natl Acad Sci U S A. 2003;100:7331–7336. doi: 10.1073/pnas.0832317100. [DOI] [PMC free article] [PubMed] [Google Scholar]
- Rahnama F, et al. Distinct roles of PTCH2 splice variants in Hedgehog signalling. Biochem J. 2004;378:325–334. doi: 10.1042/BJ20031200. [DOI] [PMC free article] [PubMed] [Google Scholar]
- Rowan S, Cepko CL. Genetic analysis of the homeodomain transcription factor Chx10 in the retina using a novel multifunctional BAC transgenic mouse reporter. Dev Biol. 2004;271:388–402. doi: 10.1016/j.ydbio.2004.03.039. [DOI] [PubMed] [Google Scholar]
- Rowan S, et al. Transdifferentiation of the retina into pigmented cells in ocular retardation mice defines a new function of the homeodomain gene Chx10. Development. 2004;131:5139–5152. doi: 10.1242/dev.01300. [DOI] [PubMed] [Google Scholar]
- Rutherford AD, et al. Delayed expression of the Crx gene and photoreceptor development in the Chx10-deficient retina. Invest Ophthalmol Vis Sci. 2004;45:375–384. doi: 10.1167/iovs.03-0332. [DOI] [PubMed] [Google Scholar]
- Schaeren-Wiemers N, Gerfin-Moser A. A single protocol to detect transcripts of various types and expression levels in neural tissue and cultured cells: in situ hybridization using digoxigenin-labelled cRNA probes. Histochemistry. 1993;100:431–440. doi: 10.1007/BF00267823. [DOI] [PubMed] [Google Scholar]
- Taipale J, et al. Effects of oncogenic mutations in Smoothened and Patched can be reversed by cyclopamine. Nature. 2000;406:1005–1009. doi: 10.1038/35023008. [DOI] [PubMed] [Google Scholar]
- Toy J, et al. Effects of homeobox genes on the differentiation of photoreceptor and nonphotoreceptor neurons. Invest Ophthalmol Vis Sci. 2002;43:3522–3529. [PubMed] [Google Scholar]
- Varjosalo M, Taipale J. Hedgehog signaling. J Cell Sci. 2007;120:3–6. doi: 10.1242/jcs.03309. [DOI] [PubMed] [Google Scholar]
- Wallace VA, Raff MC. A role for Sonic hedgehog in axon-to-astrocyte signalling in the rodent optic nerve. Development. 1999;126:2901–2909. doi: 10.1242/dev.126.13.2901. [DOI] [PubMed] [Google Scholar]
- Wang Y, et al. Retinal ganglion cell-derived sonic hedgehog locally controls proliferation and the timing of RGC development in the embryonic mouse retina. Development. 2005;132:5103–5113. doi: 10.1242/dev.02096. [DOI] [PubMed] [Google Scholar]
- Wang YP, et al. Development of normal retinal organization depends on Sonic hedgehog signaling from ganglion cells. Nat Neurosci. 2002;5:831–832. doi: 10.1038/nn911. [DOI] [PubMed] [Google Scholar]
- Yang K, Cepko CL. Flk-1, a receptor for vascular endothelial growth factor (VEGF), is expressed by retinal progenitor cells. J Neurosci. 1996;16:6089–6099. doi: 10.1523/JNEUROSCI.16-19-06089.1996. [DOI] [PMC free article] [PubMed] [Google Scholar]
- Yang XJ. Roles of cell-extrinsic growth factors in vertebrate eye pattern formation and retinogenesis. Semin Cell Dev Biol. 2004;15:91–103. doi: 10.1016/j.semcdb.2003.09.004. [DOI] [PMC free article] [PubMed] [Google Scholar]
- Young RW. Cell differentiation in the retina of the mouse. Anat Rec. 1985;212:199–205. doi: 10.1002/ar.1092120215. [DOI] [PubMed] [Google Scholar]
Associated Data
This section collects any data citations, data availability statements, or supplementary materials included in this article.