Abstract
The structure of a cytosine–cytosine (CC) mismatch-containing RNA molecule derived from a hairpin structure in the thymidylate synthase mRNA that binds the aminoglycoside paromomycin with high affinity was determined using nuclear magnetic resonance (NMR) spectroscopy. The cytosines in the mismatch form a noncanonical base pair where both cytosines are uncharged and stack within the stem of the RNA structure. Binding to paromomycin was analyzed using isothermal titration calorimetry (ITC) to demonstrate the necessity of the CC mismatch and to determine the affinity dissociation constant of this RNA to paromomycin to be 0.5 ± 0.3 μM. The CC mismatch, and the neighboring GC base pairs experienced the highest degree of chemical shift changes in their H6 and H5 resonances indicating that paromomycin binds in the major groove at the CC mismatch site. In comparing the structure of CC mismatch RNA with a fully Watson–Crick GC base paired stem, the CC mismatch is shown to confer a widening of the major groove. This widening, combined with the dynamic nature of the CC mismatch, enables binding of paromomycin to this RNA molecule.
Keywords: NMR spectroscopy, RNA structure, paromomycin, aminoglycoside–RNA interaction
INTRODUCTION
The roles played by RNA in biology are rapidly expanding as new functions performed by RNA are discovered. RNA is at the center of such vital cellular processes, such as RNA interference (Rana 2007) and gene regulation by riboswitches (Montange and Batey 2008). As new roles for RNA become evident, the ability to influence and manipulate the function of RNA through the binding of small molecules gains importance (Chow and Bogdan 1997; Thomas and Hergenrother 2008). A classic example of RNA–small molecule interactions is found in the aminoglycoside class of antibiotics that interacts with the ribosomal A-site. Structures of A-site RNA bound to members of the aminoglycoside family of molecules reveal that this class of ligand specifically binds one groove of the RNA and interact primarily with the mismatched or nonduplex regions of RNA (Fourmy et al. 1996; Carter et al. 2000; Vicens and Westhof 2001). In addition to aminoglycosides, a number of other small molecules that bind the ribosomal A-site have been identified using a variety of different screening methods (Swayze et al. 2002; Yu et al. 2003; Foloppe et al. 2004; He et al. 2004; Maddaford et al. 2004).
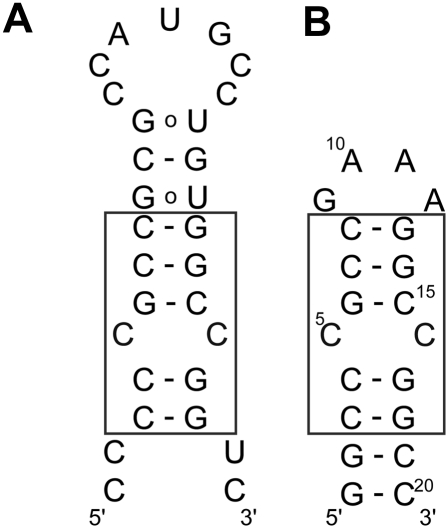
Aside from the binding of aminoglycosides to the ribosomal A-site, this class of antibiotics is a promiscuous binder and interacts with a large number of non-A-site containing RNA molecules. These include RNA/DNA triplexes and duplexes, RNA aptamers, ribozymes, tRNA, and at protein binding sites on RNA molecules (Chow and Bogdan 1997; Thomas and Hergenrother 2008). Another RNA motif known to bind aminoglycosides, and the focus of this paper, is a cytosine–cytosine (CC) mismatch found in a hairpin structure in the mRNA that codes for the human thymidylate synthase (TS) protein, TS mRNA construct (TSMC) RNA (Fig. 1; Tok et al. 1999). Recently, a combinatorial screening study of internal loop structures for aminoglycoside binding pulled out a CC mismatch in many RNA constructs (Disney et al. 2008). Understanding the interaction of aminoglycosides with this non-A-site molecule could provide useful information related to the development of antibiotics with increased specificity for the ribosomal A-site, and lower affinity for non-A-site targets. Conversely, an understanding of the CC mismatch structure and how it binds aminoglycosides may aid in the development of ligands specific for this RNA motif.
FIGURE 1.
(A) Secondary structure of the CC mismatch containing mRNA hairpin that binds the enzyme thymidylate synthase. The binding site for the enzyme is the AUG sequence in the loop. (B) Secondary structure of TSMC RNA molecule used in this study. The boxed region shows the sequence important for aminoglycoside binding, common to both constructs.
The TSMC RNA hairpin is one of two binding sites for the TS enzyme on its mRNA and is an example of an autoinhibitory feedback mechanism for controlling the translation of the TS enzyme (Chu et al. 1993). The binding site for TS is at the translational initiation codon (AUG), which is located in the loop of a hairpin structure that contains a characteristic “cytosine bulge” in its stem (Fig. 1). As the function of TS is to methylate dUMP to dTMP (Carreras and Santi 1995), the autofeedback mechanism of TS binding on its own mRNA is necessary for indirectly controlling the rate of cell replication. A stringent regulation of this biochemical process is needed to circumvent the overexpression of TS, decrease high levels of dTMP, and reduce the potential for tumor growth (Hashimoto et al. 1988, 2006). As a result of its importance in metabolic pathways TS is an important anticancer drug target.
In order to better understand and potentially influence the TS interaction with its mRNA, Tok and co-workers have investigated the interaction between members of the aminoglycoside molecular family and the CC mismatch containing mRNA hairpin (Tok et al. 1999). However, structural information for this therapeutically important interaction is not known. In this paper, we present the structure of the CC mismatch from TSMC (Fig. 1B), identify its paromomycin binding surface, and determine the affinity of paromomycin for the TSMC RNA.
RESULTS
ITC demonstrates that the CC mismatch is critical for paromomycin binding
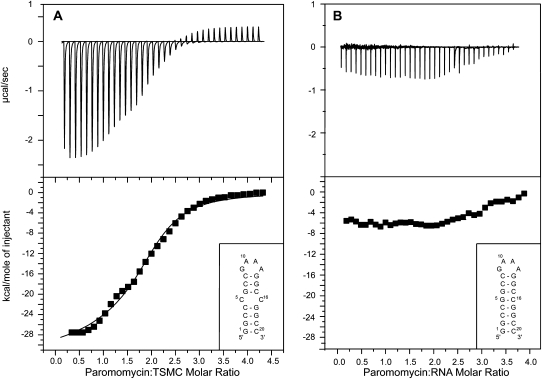
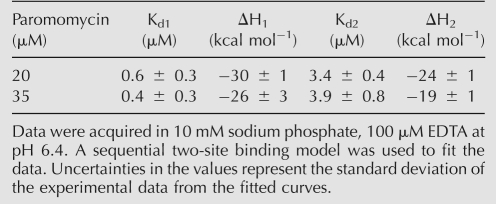
The affinity of TSMC for paromomycin and the importance of the CC mismatch in TSMC–paromomycin interaction were assayed using isothermal titration calorimetry (ITC) (Fig. 2). In the thermogram of TSMC interacting with paromomycin (Fig. 2A), with buffer conditions of 10 mM sodium phosphate at pH 6.4, 100 μM EDTA, 20°C, two binding events with different affinities were determined to be taking place as evident in the curvilinear shape of the binding curve. The data best fit a sequential two-site binding model. Two ITC experiments were performed with paromomycin concentrations of 20 and 35 μM, the affinity and enthalpy of binding are given in Table 1.
FIGURE 2.
(A) Isothermal titration calorimetry (ITC) profile of the paromomycin–TSMC interaction at pH 6.4, 10 mM sodium phosphate, 100 μM EDTA, recorded at 20°C. Two paromomycin molecules bind each TSMC RNA and a sequential two-site binding model was used to fit the data. (B) ITC profile of the titration of paromomycin into a RNA molecule where the CC mismatch in TSMC is replaced by a GC base pair. No binding is observed in B demonstrating the importance of the CC mismatch in paromomycin recognition.
TABLE 1.
ITC-derived binding parameters for the interaction of paromomycin and TSMC RNA
In the case of a TSMC mutant, where the CC mismatch is substituted with a GC base pair (Fig. 2B), no specific binding is observed under the same conditions. This clearly indicates the importance of the CC mismatch for TSMC binding paromomycin. Other buffer conditions were also tested for TSMC–paromomycin binding using ITC methods. At pH values of 4.7, 8.0, and 8.8 no binding was observed. For these three conditions, the thermogram resembled that shown in Figure 2B.
NMR assignments of TSMC
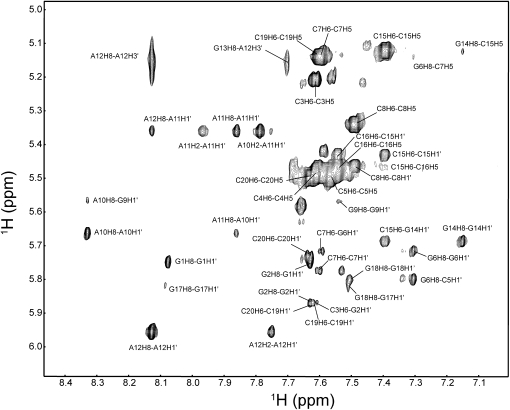
As a basis for structural and binding studies, the NMR spectrum of TSMC RNA was assigned. Following the H8 or H6 to H1′ connectivities in a two-dimensional (2D) 1H-1H NOESY acquired in 2H2O (Fig. 3), the nonexchangeable 1H signals in the stem of TSMC were successfully assigned using established NMR techniques (Wüthrich 1986; Varani et al. 1996; Wijmenga and van Buuren 1998; Flinders and Dieckmann 2006). The aromatic–anomeric “walk” assignment starts at G1 and continues to C3 where it is interrupted. It resumes at C7–C8, breaks for the tetraloop and resumes from G13 to C16 and then G18 to C20. All intranucleotide H8 (or H6) to H1′ cross peaks are medium to weak in the TSMC, which is consistent with the formation of anti-base conformations. The G13 H1′ signal is upfield shifted to 3.71 ppm as is typical for a H1′ proton 3′ to a GNRA-type tetraloop (Jucker et al. 1996; Amarasinghe et al. 2001). Near complete 1H and 13C assignments of TSMC were obtained using a set of 2D 1H-13C HSQC spectra, and three-dimensional (3D) 1H-13C HCCH-TOCSY, 3D 1H-13C HCCH-COSY, and 13C-HSQC-NOESY experiments assigned in a manner previously reported from our laboratory (Johnson and Donaldson 2006; Beribisky et al. 2007).
FIGURE 3.
Aromatic–anomeric region of the NOESY (τm = 250 msec) of TSMC in 2H2O acquired at 20°C. Assignments are labeled in the spectrum.
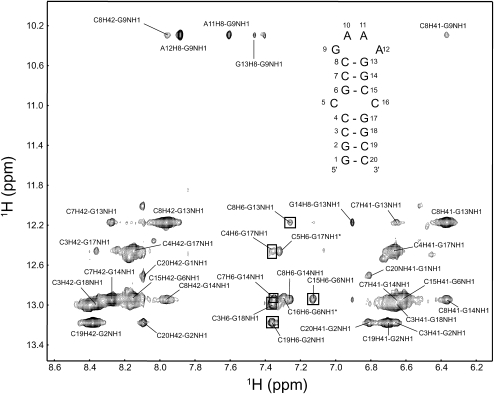
A 2D 1H-1H NOESY and 2D 1H-15N HSQC spectra optimized for both amino and imino detection with the RNA in H2O were run to assign the exchangeable resonances in TSMC. A set of imino–imino NOEs were observed connecting the stem base pairs from G2 to G17, from G6 to G13, and from G13 to the upfield G9 imino in the GNRA tetraloop (Fig. 1). An NOE contact between the imino protons of guanines in the base pairs adjacent to the CC mismatch was not observed. The terminal G1 imino was also not observed, presumably due to its rapid exchange with the solvent. Cytosine amino (H41 and H42) peaks were observed and assigned for all nucleotides (C3, C4, C7, C8, C15, C19, and C20) with the exception of the two cytosines in the CC mismatch.
Structure determination of TSMC
The aromatic–anomeric walk and the imino–imino walk in the 2D 1H-1H NOESY spectra acquired in 2H2O and H2O, respectively, defines the TSMC stem as being comprised of four canonical Watson–Crick base pairs in the lower stem and three canonical Watson–Crick base pairs in the upper stem, which flanks the CC mismatch. The GAAA tetraloop in TSMC exhibits the same pattern of NOEs as seen in previous structures of GNRA-type tetraloop folds and the same distinct chemical shifts indicating that this sequence forms a typical GNRA-type tetraloop structure.
The C5–C16 mismatch in TSMC forms a structure where both rings are positioned in the stem stacked with their adjacent base pairs. NOEs between C5H6 and G17H1 and C16H6 and G6H1 define the position of the bases in the CC mismatch as being internal and not bulged out (Fig. 4). Using the nomenclature of Leontis and Westhof (2001) this base pair is classified as being cis. Though a complete set of aromatic–anomeric NOEs typical of A-form helix, are not seen at the CC mismatch, two of these NOEs are observed at and adjacent to the CC mismatch. These NOEs are those between C16H6 and C15H1′ and G6H8 and C5H1′ (Fig. 3). These NOEs indicate that the stem at the CC mismatch retains some helical character, but is not completely A-form.
FIGURE 4.
Imino–amino region in the NOESY of TSMC in H2O recorded at 5°C. Selected assignments are labeled in the spectrum. Key NOE contacts (C16H6-G6NH1 and C5H6-G17NH1) designated with asterisks, provide direct evidence that the cytosine bases in the CC mismatch are internal. The NOE between C20H6 and G1NH1 protons in the first GC base pair peak were not observed, likely due to fast breathing motions of the terminal residues of TSMC.
The two cytosine nucleotides involved in the CC mismatch (C5 and C16) are uncharged in the buffer conditions used for structure determination. This is shown by the absence of unassigned imino protons in the 1H-15N HSQC at the expected chemical shift of a protonated cytosine N3 atom. Additionally, TOCSY spectra of TSMC were recorded at pH values of 4.7, 6.4, and 8.0. All cytosine H5/H6 correlations show significant chemical shift changes between spectra acquired at these three pH values. If a cytosine had an abnormally high pK a for its N3 atom, and was therefore protonated in this pH range, there should not be a significant change in the TOCSY spectrum when changing from pH 4.7 to 6.4.
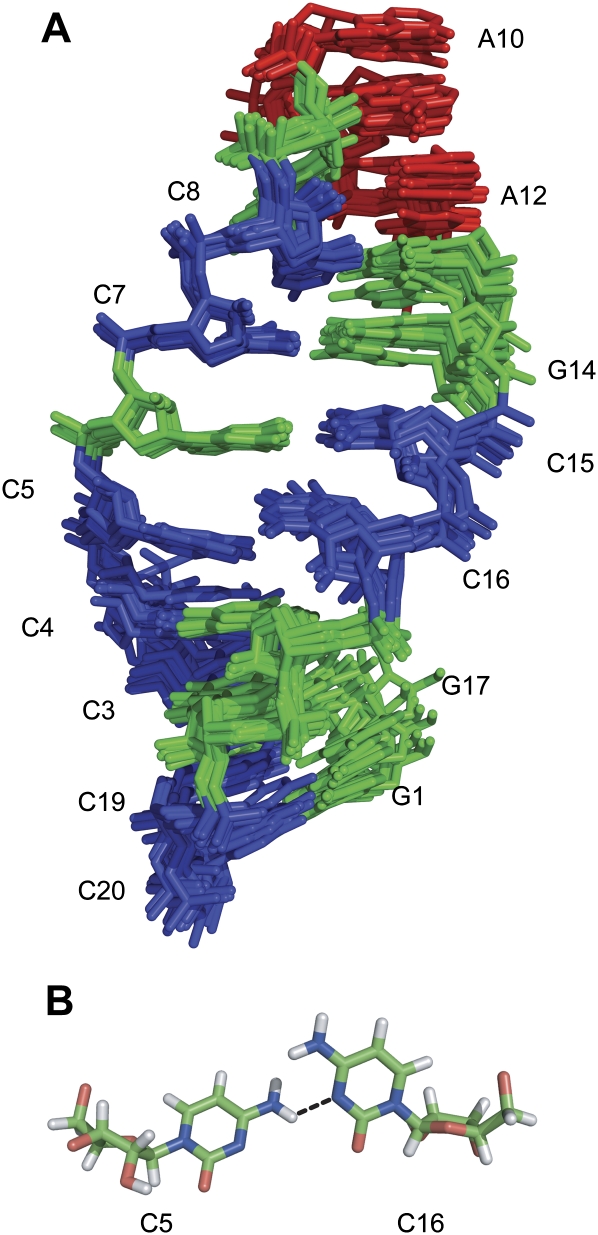
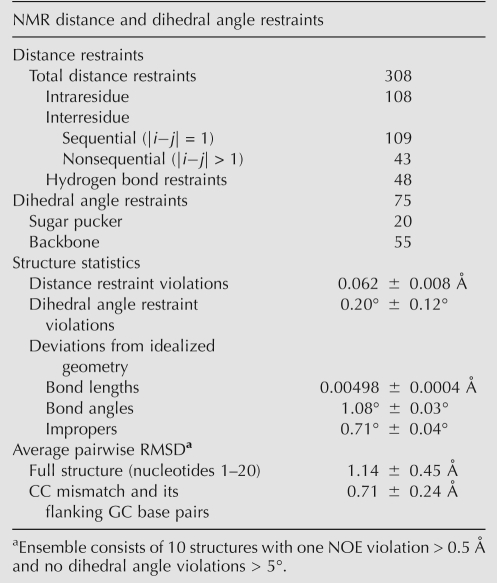
The structure of TSMC was determined using 260 NOE-derived distance restraints, 75 dihedral angle restraints, 48 hydrogen bond restraints, and 7 sets of base pair planarity restraints. Fifty structures were calculated, with the 10 having the lowest energy being used to represent the structure of TSMC (Fig. 5A). For the final ensemble there were no dihedral angle violations greater than 5 degrees, and only one NOE violation greater than 0.5 Å. The pairwise RMSD using all heavy atoms for the full structure (1.14 ± 0.45 Å) and the CC mismatch and its surrounding GC base pairs (0.71 ± 0.24 Å) indicate that this structure is well defined (Table 2).
FIGURE 5.
(A) Superposition of the 10 lowest energy structures of TSMC. The structures are represented in stick form with adenine nucleotides colored red, guanine nucleotides colored green, and cytosine nucleotides colored blue. All heavy atoms were used for the superposition. (B) Structure of the C5–C16 mismatched base pair. The dotted line indicates the putative hydrogen bond between C5 NH42 and C16 N3.
TABLE 2.
Structural statistics of the ensemble of 10 TSMC structures
The structure of TSMC consists of four canonical Watson–Crick GC base pairs in the lower stem and three canonical Watson–Crick GC base pairs in the upper stem that flank the CC mismatch. The GAAA tetraloop in TSMC forms a typical GNRA-type tetraloop with the three adenine purine rings stacked on top of each other. The structural ensemble (Fig. 5A) shows the right-handed twist of the A-form RNA helix in both the upper and lower stem regions.
The CC mismatch is well defined in the TSMC structure. The two cytosine pyrimidine rings are neutral and stack with their neighboring bases. Base stacking is shown by an aromatic–aromatic NOE between C15H6 and C16H6. The CC mismatch structure is also stabilized by a putative hydrogen bond between C5NH42 and C16N3 (Fig. 5A). This CC mismatch disrupts the typical backbone geometry of an A-form helix. This is shown by breaks in the NOE connectivities found in the anomeric–aromatic walk between the cytosines in the mismatch and its adjacent nucleotides.
Binding of paromomycin by TSMC monitored by NMR
Binding of TSMC to paromomycin was monitored by changes in the NMR spectrum of the RNA in the absence and presence of an increasing concentration of ligand. A 2D TOCSY spectrum in 2H2O was recorded of the free TSMC and at 13 points up to a final molar ratio of paromomycin to TSMC RNA of 3.6:1. Above this molar ratio, significant precipitation prevented further titration points from being obtained. The H6-H5 correlation region of pyrimidine nucleotides in the TOCSY spectra was used to analyze the binding interaction. This region is especially useful as it provides a direct window into the CC mismatch, as well as for every base pair of the TSMC stem.
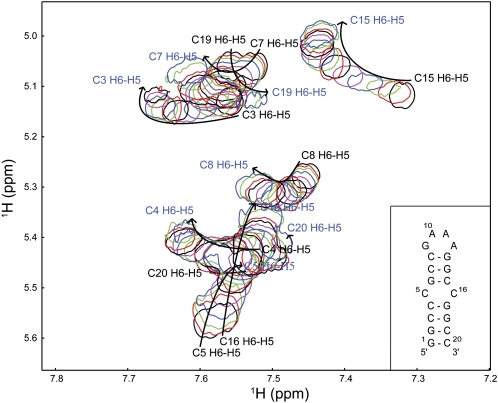
An overlay of the 14 TOCSY spectra of TSMC free and in the presence of increasing concentrations of paromomycin is shown in Figure 6. All H6/H5 correlations change chemical shift as paromomycin is added. All of the peaks are in fast exchange on the NMR time scale and a population averaged chemical shift is observed. This is opposed to slow exchange in which a bound peak appears as the free peak disappears. The correlations do not move in a straight line throughout the entire course of the titration. Instead, the peaks show a curved trajectory indicating that two binding events are occurring. All of the H6/H5 correlations appear at every point of the titration with the exception of C5. For C5, a residue in the CC mismatch, the H6/H5 correlation is not visible after the eighth point of the titration, corresponding to a molar ratio of 1.4:1, paromomycin:TSMC. Presumably, this residue experiences exchange-broadening motions that result in the disappearance of this peak when bound to paromomycin. For some nucleotides line broadening is observed during the course of the titration, with these resonances sharpening up at the end point. An example of this line shape change is seen for titration point 4 for C15 and point 7 for C15 and C8. This indicates that these resonances approach being in intermediate exchange on the NMR time scale. We note that the pattern of chemical shift changes observed with paromomycin addition is distinct in both direction and magnitude from that observed when changing the sample pH. Disappointingly, the chemical shift dispersion for TSMC, already poor in the free spectrum, becomes worse upon paromomycin binding.
FIGURE 6.
NMR analysis of paromomycin binding to TSMC RNA. An overlay of 2D TOCSY spectra of TSMC acquired at paromomycin:TSMC molar ratios of 0:1, 0.3:1, 0.5:1, 0.7:1, 1:1, 1.3:1, 1.4:1, 1.6:1, 1.8:1, 2.1:1, 2.3:1, 2.5:1, 2.9:1, and 3.6:1. The colors are shown in a repeating cycle of black, red, green, blue, and magenta. The arrows indicate the direction of the peak shift, with the free assignments in black and bound assignments in blue type. The inset shows the secondary structure of the TSMC RNA. Spectra were acquired in 10 mM sodium phosphate at pH 6.4, 100 μM EDTA at 20°C in 99.9% 2H2O.
Identification of the CC mismatch as the paromomycin binding site
The changes in chemical shifts of the H6/H5 correlations with paromomycin binding were fit to a sequential two-site binding model. The H6/H5 correlations follow a curved trajectory implying that more than one binding site for paromomycin is present in TSMC. At the start of the titration the first, high affinity, binding site becomes occupied with chemical shift changes reflecting this event being observed up to about point seven in the titration series, 1.4:1 paromomycin:RNA. Next, a second, lower affinity, binding event takes place with its chemical shift changes being reflected in the last seven titration points. Due to this curvilinear trajectory we used a sum of incremental displacements between successive H6/H5 peaks in the TOCSY spectra, and not a simple chemical shift change between the start and each titration point as used to represent the fraction bound in a single site binding model (Johnson et al. 1996). The fraction bound was calculated from the sum of incremental displacements up to a particular point in the titration series divided by the total sum of incremental displacements (Equation 1 in Materials and Methods).
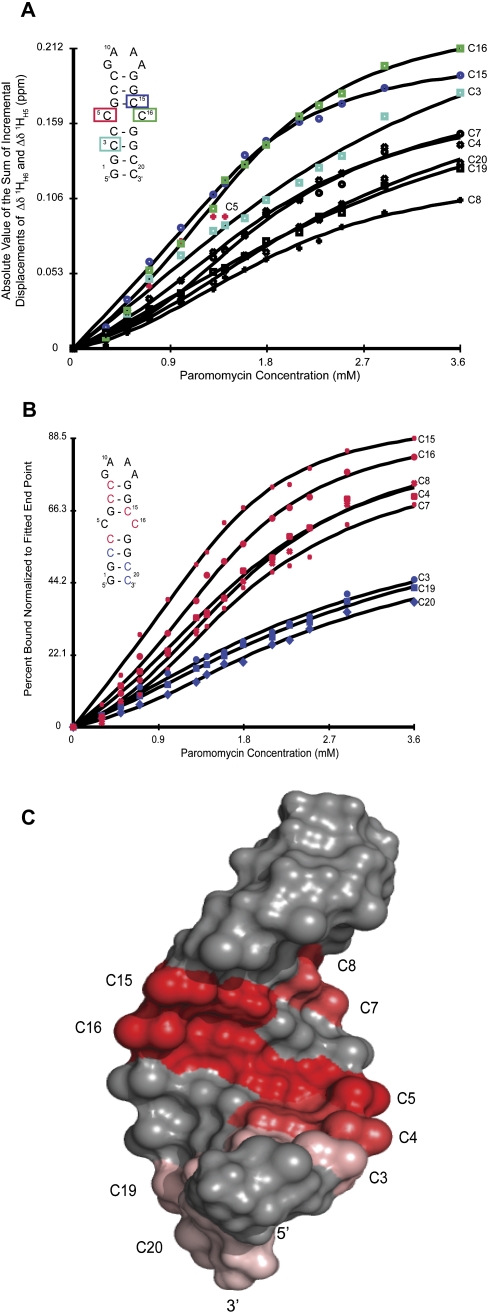
Figure 7 shows the fits of the chemical shift perturbation data versus paromomycin concentration to a sequential two-site binding model. The affinity constant was not determined from these fits as ITC showed that binding is too tight to be determined accurately from chemical shift perturbations at the concentration used for NMR studies, 1.4 mM. In Figure 7A the residues that change chemical shift most with ligand binding are C16, C15, C3, C7, C4, C20, C19, and C8. In Figure 7B, the y-axis is represented by the percent bound, normalized to the fitted end point of the respective cytosine. During the fit to the binding model the value of the final chemical shift is fit to the data, with the final point from the titration being the initial estimate for this value. Therefore, Figure 7B reflects the level of saturation reached during the titration. Here we can see two distinct groups of cytosine nucleotides. The first group, comprised of C15, C16, C8, C4, and C7, are saturated the most and are all located in the upper part of the stem. The second grouping, C3, C19, and C20, are unsaturated relative to the first group and all are located in the lower base pairs of the stem.
FIGURE 7.
Fit of the chemical shift perturbations for TSMC binding paromomycin. (A) Direct plot of the sum of the incremental displacements for the H6/H5 correlations for all of the cytosine residues of TSMC. The four cytosine nucleotides that move most upon paromomycin binding are shown in color, C16 (green), C15 (blue), C5 (red), and C3 (cyan). Note that C5 disappears due to line broadening at titration point 6 (1.4:1, paromomycin:TSMC). (B) Plot of percent bound normalized to the fitted end point of each cytosine residue. The nucleotides C4, C7, C8, C15, and C16 experience the highest levels of paromomycin saturation and are shown in red. The residues C3, C19, and C20 are characterized by a much lower degree of saturation at the final paromomycin:TSMC molar ratio of 3.6:1, and are shown in blue. (C) Chemical shift perturbation mapped onto the structure of TSMC. The percent bound by the final titration point is mapped onto the cytosine residues of the TSMC structure using a red color gradient. C5, the residue that line broadens and disappears is shown in red here. A high affinity site is located at the CC mismatch and is characterized by a concentration of residues in dark red. The lower affinity site is near the base of the stem and is marked by residues in pink.
Chemical shift changes were used to monitor paromomycin binding to TSMC RNA. Changes in chemical shift can arise due to direct interaction between the ligand and the RNA or from indirect structural changes in RNA resulting from paromomycin binding. Keeping this in mind, it is possible to deduce structural information on the nucleotides at the paromomycin binding site from the patterns of chemical shift perturbations. Figure 7 shows which nucleotide chemical shifts are most affected by paromomycin binding. Nucleotides C16, C15, and C3 experience the greatest magnitude of chemical shift change with binding (Fig. 7A). Additionally, C5 experiences one of the largest changes in chemical shift with binding until the peak exchange broadens out and is not visible after the sixth addition of paromomycin. All of these nucleotides are part of the CC mismatch or within one or two flanking base pairs, demonstrating that the CC mismatch is the primary binding site for paromomycin. Nucleotides C7, C4, C20, C19, and C8 experience a decreasing amount of chemical shift changes with paromomycin binding.
Further insight into the location of the binding sites can be obtained from Figure 7B. From the fit of the chemical shift data to the binding model, a final value of the fully bound chemical shift was determined. Using this final value, a percentage of the paromomycin saturation for each TSMC cytosine was obtained. This percent saturation was mapped onto the structure of TSMC in Figure 7C. Here two distinct groups of nucleotides are seen. The first, comprised of C15, C16, C8, C4, and C7, are most likely affected by binding at the high affinity site and their identity reflects the location of the high affinity site being comprised of the CC mismatch and adjacent base pairs. The second group, consisting of C3, C19, and C20, are significantly less saturated by the final titration point. Their bound chemical shift primarily reflects binding at the second, low affinity site. The location of this binding site is near the terminus of the stem. It is worth noting that C3 lies midpoint between the two binding sites and its magnitude of chemical shift change is large (Fig. 7A), though its percent saturation by the final titration point is low. C8, the final base pair before the tetraloop, changes chemical shift the least, as it is the pyrimidine that lies furthest from either binding site. Yet it is among the most saturated as its chemical shift mostly monitors binding at the high affinity site.
Identification of the region in paromomycin important for TSMC binding
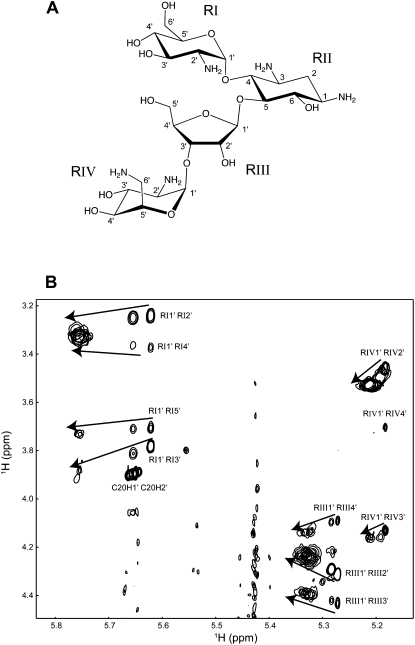
The effects of RNA binding on the chemical shifts of paromomycin were analyzed by monitoring the TOCSY spectrum of paromomycin acquired with an increasing concentration of TSMC RNA (Fig. 8). The TOCSY spectrum of free paromomycin closely resembles what was previously reported (Fourmy et al. 1998) and assignments were confirmed using a combination of standard homonuclear NMR experiments. TSMC RNA was then titrated into paromomycin and TOCSY spectra were recorded at molar ratios of 10:1, 3.33:1, 2:1, 1.43:1, 1.25:1, and 1:1 paromomycin:TSMC RNA. Figure 8B shows an overlay of spectra from the titration focused on the anomeric–aliphatic region of the TOCSY. The anomeric proton is the chemical shift most sensitive to ligand binding in this titration. The anomeric proton of ring I moves the most (0.134 ppm), the anomeric proton of ring III moves 0.061 ppm and the anomeric proton of ring IV shifts the least at 0.030 ppm. Ring II has no anomeric proton, but the diastereotopic protons at position 2 provide a good chemical shift indicator of RNA binding. These two protons move 0.223 and 0.190 ppm upon RNA binding. Together, these data show that rings I and II experience the greatest chemical shift perturbations and are the primary target for RNA recognition. Rings III and IV show a smaller change in chemical shift and are less important for RNA binding.
FIGURE 8.
Effect of RNA binding on the NMR spectrum of paromomycin. (A) Chemical structure of paromomycin. Roman numerals indicate the ring numbers. (B) TOCSY spectra of paromomycin acquired at increasing concentrations of RNA. Data were acquired in 10 mM sodium phosphate at pH 6.4, 100 μM EDTA, at 20°C and at paromomycin:TSMC molar ratios of: 10:1, 3.33:1, 2:1, 1.43:1, 1.25:1, and 1:1. The arrows indicate the direction of the peak shifts, with the free assignments labeled.
DISCUSSION
Structure and dynamics at the CC mismatch and paromomycin binding
NMR methods were used to determine the structure of the CC mismatch from the thymidylate synthase mRNA regulatory hairpin. The cytosine nucleotides in the CC mismatch are neutral as seen from NMR data acquired at different pH values, and they are not bulged out, but are part of the helical structure. Though not perfectly planar, the nucleotides in the CC mismatch form a base pair stabilized by a putative amino–imino single hydrogen bond. A similar CC mismatch arrangement has been seen in the structure of the Hepatitis C virus (HCV) internal ribosome entry site (IRES) eIF3-binding site (Collier et al. 2002).
For the HCV IRES, fast positional averaging was proposed for the CC mismatch based on broadening out of the amino resonances of those cytosines. In our case, we also did not observe the amino signals in the CC mismatch in both the amino optimized 1H–15N HSQC and in the NOESY acquired in H2O indicating that positional averaging also takes place for the TSMC CC mismatch. In support of the existence of fast positional averaging at the CC mismatch, we observe that upon paromomycin binding, the H5/H6 signal of Cyt5 disappears due to line broadening. This signal does not reappear at higher paromomycin concentrations, so is not merely a result of a partially occupied binding site, but signal averaging between multiple conformations or motion of the ligand in the binding site. Motion at a CC mismatch was also observed for a mutant tRNA acceptor minihelix (Chang et al. 1999) and for a DNA molecule containing a CC mismatch (Boulard et al. 1997). It is possible that aminoglycoside binding is linked to or enhanced by the dynamic nature of the CC mismatch. Consistent with this proposal, the antibacterial activity of paromomycin through its interaction with the ribosomal A-site has been linked to the conformational equilibria between intrahelical and extrahelical states of A1492 and A1393 at the A-site (Kaul et al. 2006).
Comparison with other RNA-aminoglycoside interactions
The binding of paromomycin to TSMC was assayed by ITC and monitored by NMR spectroscopy. The importance of the CC mismatch was demonstrated by comparing the affinity of TSMC with a RNA containing a GC base pair in place of the CC mismatch. As seen by ITC, insignificant binding occurs in the absence of the CC mismatch (Fig. 2). However, as binding could still occur with little heat being released, making this binding not detectable by ITC, we also confirmed the importance of the CC mismatch by comparing the NMR spectrum of the TSMC RNA with that of a fully Watson–Crick base paired stem upon addition of paromomycin. For TSMC many chemical shift changes were observed with the addition of paromomycin (Fig. 6), in the case of the fully Watson–Crick stem only very slight and random chemical shift changes were observed. This confirms the requirement of the CC mismatch being present for paromomycin binding to occur.
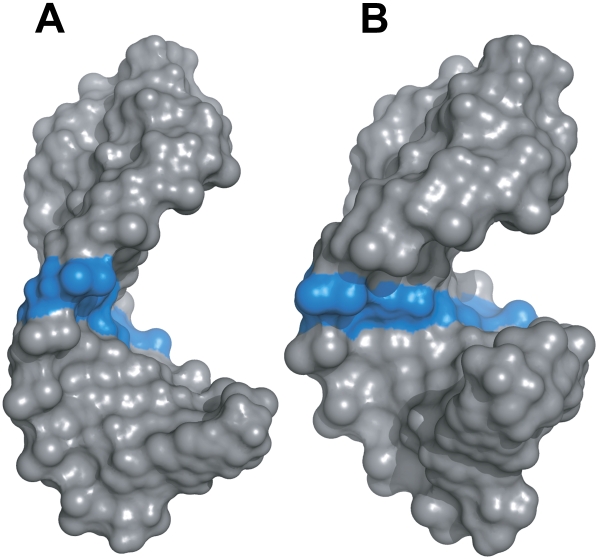
Although the bases of the CC mismatch lie in the stem and stack with their adjacent nucleotides, the mismatch results in a structure that does not adopt a perfect A-form helix. This is shown by breaks in the NOE connectivities expected in the standard NOE walk found for residues with A-form geometry. The major groove in TSMC is widened compared to a standard A-form helix (Fig. 9). This widening confers the ability of the CC mismatch-containing helix to bind paromomycin, while the fully Watson–Crick counterpart with a narrower major groove shows no binding. Other RNA molecules that bind aminoglycosides and aminoglycoside analogs also bind at a site that is distorted from standard A-form RNA geometry (Fourmy et al. 1996; Carter et al. 2000; Vicens and Westhof 2001; Ennifar et al. 2003; Raghunathan et al. 2006) or have been found to widen its major groove upon binding (Staple et al. 2008).
FIGURE 9.
Widening of the major groove in the TSMC RNA containing a CC mismatch. (A) Surface representation of the structure of TSMC and (B) model of an RNA, containing a GC Watson–Crick base pair in place of the CC mismatch, and a fully A-form stem. The CC mismatch in A and the corresponding GC base pair in B are colored blue.
When looking at the paromomycin chemical shift changes upon RNA binding we observe that the largest chemical changes are found in rings I and II with smaller shifts found for rings III and IV (Fig. 8). This indicates that rings I and II likely form the most contacts with the RNA. The close involvement of rings I and II is consistent with previous studies of aminoglycosides binding RNA, in which these two rings form close contact with the RNA (Fourmy et al. 1996; Vicens and Westhof 2001) and indicates that the CC mismatch likely binds paromomycin in a similar manner as the A-site RNA. Intermolecular NOEs between paromomycin and the TSMC RNA were not observed. This, coupled with the disappearance of resonances in Cyt5 in the bound form and an increase in chemical shift overlap, precluded the structure determination of the complex.
TSMC has a stoichiometry of binding two paromomycin molecules per RNA. This is demonstrated by the curved nature of the trajectory of the NMR chemical shift changes with ligand binding (Fig. 6) and from the ITC experiments where the thermogram is similarly curved. For both the NMR and ITC data there is an inflection point around the same molar ratio of 1.4:1 (paromomycin to TSMC). This inflection point is where the higher affinity site becomes saturated and the lower affinity site starts to become significantly populated. Binding of two paromomycin ligands to the TSMC is consistent with previous ITC experiments where two binding events were observed in the interaction of paromomycin with the ribosomal A-site (Kaul and Pilch 2002; Kaul et al. 2003). It is likely a common property of paromomycin, a polycation, to display both high affinity and low affinity binding to a single RNA target. Our ITC-derived average affinity of 0.5 ± 0.3 μM for the high affinity TSMC–paromomycin interaction is similar to the previously measured value of 2.241 ± 0.210 μM (Tok et al. 1999). The small difference between our measurement and that of Tok and Rando may be a reflection of different buffer conditions used for the two measurements. The measurement by Tok and Rando contained 150 mM NaCl, 5 mM KCl, 1 mM MgCl2, and 1 mM CaC2 at pH 7.4 (Tok et al. 1999), while the results presented here were performed in the presence of only 10 mM sodium phosphate at pH 6.4 in order to more closely reflect the conditions used for the structural experiments. This difference in salt concentration may be reflected in the slightly weaker binding observed previously. Additionally, Tok and Rando report the presence of a single binding site, and not two as we report here. This observation may reflect the much lower concentration used for the fluorescent-based binding studies used previously where RNA concentrations ranged from 0 to 500 nM. In this study the RNA was present at a concentration of 20 or 35 μM.
MATERIALS AND METHODS
Preparation of TSMC RNA
Unlabeled and 15N/13C labeled TSMC RNA samples were prepared using an in vitro transcription reaction method (Milligan et al. 1987). TSMC RNA was purified by denaturing (8 M urea) 20% polyacrylamide gel electrophoresis followed by electroelution. The electroeluted TSMC samples were pooled and then exchanged three times in a 5 kDa MWCO cut-off concentrator with sterilized 1 M NaCl and subsequently washed three times with water. From a 40 mL transcription reaction, a 500 μL, 1.5 mM NMR sample was obtained. For the 15N/13C labeled TSMC RNA, a 20 mL transcription reaction was used to produce a 500 μL, 1 mM sample.
NMR spectroscopy
NMR experiments on the unlabeled TSMC sample were acquired using a 600 MHz Bruker Avance spectrometer. A 2D NOESY (τm=200 msec) of TSMC in H2O/2H2O (90%/10%) was recorded at 5°C. A 2D NOESY with a 250 msec mixing time, a TOCSY spectrum (Griesinger et al. 1988) with a 72 msec mixing time and a DQF-COSY were acquired on the unlabeled TSMC in 2H2O at 20°C. Two 1H-13C HSQC experiments (Vuister and Bax 1992) recorded at natural abundance with parameters optimized for aromatic and ribose proton detection were also obtained.
NMR experiments on the 15N/13C labeled TSMC sample were acquired using a Varian 800 MHz NMR spectrometer equipped with a cryogenically cooled probe. These included a 3D HCCH-COSY (Bax et al. 1990), a 3D HCCH-TOCSY (Kay et al. 1993), and a 3D 1H-13C NOESY-HSQC (τm=100 msec) (Davis et al. 1992). Using the 600 MHz Bruker spectrometer, 1H-15N HSQC experiments with the nitrogen spectral width optimized for both imino and amino proton detection were recorded at 5°C. All NMR data were processed using NMRPipe (Delaglio et al. 1995), and visualized using NMRView (Johnson and Blevins 1994).
Titration of paromomycin into TSMC monitored by NMR
A 1.3 mM TSMC sample in 500 μL of binding buffer (10 mM sodium phosphate, 100 μM EDTA, pH 6.4, 99.9% 2H2O) was used to analyze the interaction between TSMC and paromomycin using NMR spectroscopy. Paromomycin (Sigma) was dissolved in binding buffer, lyophilized twice, and redissolved in 99.9% 2H2O. The quantity of paromomycin was scaled up 3% to compensate for its known drying rate loss. 2D 1H-1H TOCSY experiments were used to monitor the effect of paromomycin binding on TSMC. NMR spectra at these paromomycin:TSMC molar ratio points were performed: 0:1, 0.3:1, 0.5:1, 0.7:1, 1:1, 1.3:1, 1.4:1, 1.6:1, 1.8:1, 2.1:1, 2.3:1, 2.5:1, 2.9:1, and 3.6:1. Additionally, 2D NOESY spectra (τm=250 msec) were recorded at molar ratios of 1.3:1, 2.1:1, and 2.9:1 in order to aid in peak assignments. All 2D experiments were recorded with a data matrix of 4096 × 600 points at 20°C.
Titration of TSMC into paromomycin monitored by NMR
An 800 μM paromomycin solution and a 1.15 mM TSMC solution were prepared in binding buffer, lyophilized, and taken up in 99.9% 2H2O twice. This concentration of TSMC was selected such that a 33.4 μL of this ligand would correspond to a paromomycin:TSMC molar ratio of 10:1. 2D 1H-1H TOCSY experiments were acquired at the paromomycin:TSMC molar ratio titration points of 10:1, 5:1, 3.3:1, 2.5:1, 2:1, 1.7:1, 1.4:1, 1.3:1, 1.1:1, and 1:1, in order to investigate the effect of TSMC binding on the NMR spectrum of paromomycin. Experiments were performed on a 600 MHz Bruker spectrometer and recorded with a data matrix of 4096 × 600 at 20°C. TOCSY experiments to monitor binding were recorded with a longer mixing time (τm = 96.6 msec) in order to maximize the TOCSY signals from the paromomycin protons.
NMR data fitting
Chemical shift perturbation data from TOCSY spectra were fit to a sequential two site binding model. The equations describing this model are based from the work of Sykes and co-workers (Williams et al. 1986). The curve fitting algorithm used to extract the two dissociations constants for this interaction is found in the XY2 chemical shift module in the xcrvfit software (Boyko and Sykes 1994). The concentrations of paromomycin and TSMC were adjusted for dilution during the course of the titration. The chemical shift changes in the H6/H5 resonances of TSMC due to paromomycin binding were monitored using TOCSY experiments. Due to the curvilinear trajectory of the H6/H5 chemical shift changes, an absolute value of the sum of incremental displacements in the H5 and H6 chemical shifts between successive titration points were used to determine the fraction bound as shown by
 |
where i represents a point in the series of TOCSY titrations, n represents a position in the titration series, and the final titration point is denoted N. The ratio of the summations in Equation 1 was used to determine the fraction bound of paromomycin–TSMC species from i = 0 (unbound TSMC) to i = N (paromomycin: TSMC molar ratio of 3.6:1). Using the calculated fraction bound, the final bound chemical shift for each of the two binding events were determined by nonlinear least squares fitting using the program xcrvfit (Boyko and Sykes 1994).
Structure determination of TSMC
NOE cross-peak intensities were categorized into distance ranges. Strong NOE cross peaks with intensities similar to pyrimidine H6-H5 correlations were binned from 1.8 to 2.8 Å. Medium NOEs with intensities similar to intramolecular H8/H6 to H1′ cross peaks in helical regions were binned from 1.8 to 4 Å. Weak NOE contacts, such as intermolecular H8n/H6n to H1′n− 1 cross peaks, were binned from 1.8 to 5 Å. Very weak NOE cross peaks were binned from 1.8 to 6.5 Å. Base pair planarity restraints were applied to constrain the propeller twist or rotation of GC base pairs in TSMC. Hydrogen bond restraints were applied to the seven observed GC base pairs and for the GA noncanonical base pair of the GNRA tetraloop (Jucker et al. 1996). The ribose rings of residues showing no H1′/H2′ cross peaks in a short mixing time 2D 1H-1H TOCSY (G2, C3, C4, G6, C7, C8, G14, C15, G18, and C19) were constrained to a C3′-endo configuration. The sugar rings of the GNRA tetraloop residues, the CC mismatch cytosines, terminal GC base pair, and G17 were unconstrained. RNA α/β/γ/ε/ζ dihedral angles for nucleotides that showed NOE patterns typical of A-form helix geometry (nucleotides 1–3, 6–8, 13–15, and 17–20) were assigned to standard A-form helix values. Structure calculations were performed using XPLOR-NIH (Schwieters et al. 2003). Database potentials were applied to residues in the stem, with the exception of the CC mismatch and adjacent base pairs (Clore and Kuszewski 2003). From a starting set of 50 structures, the 10 structures with the lowest energies were selected to represent TSMC. The structures were analyzed using PyMOL (DeLano 2002) and VMD-XPLOR (Schwieters and Clore 2001).
Binding analysis by isothermal titration calorimetry
Isothermal titration calorimetry (ITC) was performed using a MicroCal VP-ITC instrument. Paromomycin and TSMC solutions were prepared in the same binding buffer as used for the NMR binding studies. Binding experiments were performed with TSMC solutions at 20 and 35 μM using paromomycin concentrations of 352 and 616 μM, respectively. The ITC experiments were performed at 20°C and consisted of 36 successive injections of 8 μL of paromomycin every 3 min into the TSMC RNA. The raw ITC data were corrected for the heat of dilution of the titrant. ITC binding experiments using the fully GC base-paired TSMC RNA were performed using the same procedure.
Atomic coordinates
The restraints and atomic coordinates of the TSMC RNA have been deposited in the Protein Data Bank and are available with the accession code 2RPT.
ACKNOWLEDGMENTS
We thank Ryan McKay and Robert Boyko at the University of Alberta for their assistance in using xcrvfit software. We also acknowledge Elliot Javasky for his assistance with ITC data acquisition, Miguel Neves for assistance in fitting the ITC data, Howard Hunter for useful discussions, and Mina Motamed and Jana Mandic for help preparing samples of RNA. We also thank Tara Sprules at the Québec/Eastern Canada High Field NMR facility for performing the 800 MHz NMR experiments. This work was supported by funding from the Natural Sciences and Engineering Research Council of Canada (NSERC) to P.E.J.
Footnotes
Article published online ahead of print. Article and publication date are at http://www.rnajournal.org/cgi/doi/10.1261/rna.1514909.
REFERENCES
- Amarasinghe G.K., Zhou J., Miskimon M., Chancellor K.J., McDonald J.A., Mathews A.G., Miller R.R., Rouse M.D., Summers M.F. Stem–loop SL4 of the HIV-1 ψ RNA packaging signal exhibits weak affinity for the nucleocapsid protein. Structural studies and implications for genome recognition. J. Mol. Biol. 2001;314:961–970. doi: 10.1006/jmbi.2000.5182. [DOI] [PubMed] [Google Scholar]
- Bax A., Clore G.M., Gronenborn A.M. 1H-1H correlation via isotropic mixing of 13C magnetization, a new three-dimensional approach for assigning 1H and 13C spectra of 13C-enriched proteins. J. Magn. Reson. 1990;88:425–431. [Google Scholar]
- Beribisky A.V., Tavares T.J., Amborski A.N., Motamed M., Johnson A.E., Mark T.L., Johnson P.E. The three-dimensional structure of the Moorella thermoacetica selenocysteine insertion sequence RNA hairpin and its interaction with the elongation factor SelB. RNA. 2007;13:1948–1956. doi: 10.1261/rna.686607. [DOI] [PMC free article] [PubMed] [Google Scholar]
- Boulard Y., Cognet J.A.H., Fazakerley G.V. Solution structure as a function of pH of two central mismatches, CT and CC, in the 29 to 39 K-ras gene sequence, by nuclear magnetic resonance and molecular dynamics. J. Mol. Biol. 1997;268:331–347. doi: 10.1006/jmbi.1997.0975. [DOI] [PubMed] [Google Scholar]
- Boyko R., Sykes B.D. University of Alberta; Alberta, Ontario, Canada: 1994. xcrvfit: A graphical X-windows program for binding curve studies and NMR spectroscopic analysis. http://www.bionmr.ualberta.ca/bds/software/xcrvfit. [Google Scholar]
- Carreras C.W., Santi D.V. The catalytic mechanism and structure of thymidylate synthase. Annu. Rev. Biochem. 1995;64:721–762. doi: 10.1146/annurev.bi.64.070195.003445. [DOI] [PubMed] [Google Scholar]
- Carter A.P., Clemons W.M., Brodersen D.E., Morgan-Warren R.J., Wimberly B.T., Ramakrishnan V. Functional insights from the structure of the 30S ribosomal subunit and its interactions with antibiotics. Nature. 2000;407:340–348. doi: 10.1038/35030019. [DOI] [PubMed] [Google Scholar]
- Chang K.-Y., Varani G., Bhattacharya S., Choi H., McClain W.H. Correlation of deformability at a tRNA recognition site and aminoacylation specificity. Proc. Natl. Acad. Sci. 1999;96:11764–11769. doi: 10.1073/pnas.96.21.11764. [DOI] [PMC free article] [PubMed] [Google Scholar]
- Chow C.S., Bogdan F.M. A structural basis for RNA-ligand interactions. Chem. Rev. 1997;97:1489–1513. doi: 10.1021/cr960415w. [DOI] [PubMed] [Google Scholar]
- Chu E., Voeller D., Koeller D.M., Drake J.C., Takimoto C.H., Maley G.F., Maley F., Allegra C.J. Identification of an RNA binding site for human thymidylate synthase. Proc. Natl. Acad. Sci. 1993;90:517–521. doi: 10.1073/pnas.90.2.517. [DOI] [PMC free article] [PubMed] [Google Scholar]
- Clore G.M., Kuszewski J. Improving the accuracy of NMR structures of RNA by means of conformational database potentials of mean force as assessed by complete dipolar coupling cross-validation. J. Am. Chem. Soc. 2003;125:1518–1525. doi: 10.1021/ja028383j. [DOI] [PubMed] [Google Scholar]
- Collier A.J., Gallego J., Klinck R., Cole P.T., Harris S.J., Harrison G.P., Aboul-Ela F., Varani G., Walker S. A conserved RNA structure within the HCV IRES eIF3-binding site. Nat. Struct. Biol. 2002;9:375–380. doi: 10.1038/nsb785. [DOI] [PubMed] [Google Scholar]
- Davis A.L., Keeler J., Laue E.D., Moskau D. Experiments for recording pure-absorption heteronuclear correlation spectra using pulsed field gradients. J. Magn. Reson. 1992;98:207–216. [Google Scholar]
- Delaglio F., Grzesiek S., Vuister G.W., Zhu G., Pfeifer J., Bax A. NMRPipe: A multidimensional spectral processing system based on UNIX pipes. J. Biol. NMR. 1995;6:277–293. doi: 10.1007/BF00197809. [DOI] [PubMed] [Google Scholar]
- DeLano W.L. DeLano Scientific; Palo Alto, CA: 2002. The PyMOL Molecular Graphics System. http://www.pymol.org. [Google Scholar]
- Disney M.D., Labuda L.P., Paul D.J., Poplawski S.G., Pushechnikov A., Tran T., Velagapudi S.P., Wu M., Childs-Disney J.L. Two-dimensional combinatorial screening identifies specific aminoglycoside-RNA internal loop partners. J. Am. Chem. Soc. 2008;130:11185–11194. doi: 10.1021/ja803234t. [DOI] [PubMed] [Google Scholar]
- Ennifar E., Paillart J.-C., Marquet R., Ehresmann B., Ehresmann C., Dumas P., Walter P. HIV-1 RNA dimerization initiation site is structurally similar to the ribosomal A-site and binds aminoglycoside anntibiotics. J. Biol. Chem. 2003;278:2723–2730. doi: 10.1074/jbc.M205726200. [DOI] [PubMed] [Google Scholar]
- Flinders J., Dieckmann T. NMR spectroscopy of ribonucleic acids. Prog. NMR Spec. 2006;48:137–159. [Google Scholar]
- Foloppe N., Chen I.-J., Davis B., Hold A., Morley D., Howes R. A structure-based strategy to identify new molecular scaffolds targeting the bacterial ribosomal A-site. Bioorg. Med. Chem. 2004;12:935–947. doi: 10.1016/j.bmc.2003.12.023. [DOI] [PubMed] [Google Scholar]
- Fourmy D., Recht M.I., Blanchard S.C., Puglisi J.D. Structure of the A site of Escherichia coli 16S ribosomal RNA complexed with an aminoglycoside antibiotic. Science. 1996;274:1367–1371. doi: 10.1126/science.274.5291.1367. [DOI] [PubMed] [Google Scholar]
- Fourmy D., Yoshizawa S., Puglisi J.D. Paromomycin binding induces a local conformational change in the A-site of 16 S rRNA. J. Mol. Biol. 1998;277:333–345. doi: 10.1006/jmbi.1997.1551. [DOI] [PubMed] [Google Scholar]
- Griesinger C., Otting G., Wüthrich K., Ernst R.R. Clean TOCSY for 1H spin system identification in macromolecules. J. Am. Chem. Soc. 1988;110:7870–7872. [Google Scholar]
- Hashimoto Y., Shiotani T., Eble J.N., Glover J.L., Weber G. Increased thymidylate synthase (EC 2.1.1.45) activity in normal and neoplastic proliferation. Cancer Biochem. Biophys. 1988;10:1–10. [PubMed] [Google Scholar]
- Hashimoto H., Ozeki Y., Sato M., Obara K., Matsutani N., Nakagishi Y., Ogata T., Maehara T. Significance of thymidylate synthase gene expression level in patients with adenocarcinoma of the lung. Cancer. 2006;106:1595–1601. doi: 10.1002/cncr.21777. [DOI] [PubMed] [Google Scholar]
- He Y., Yang J., Wu B., Robinson D., Sprankle K., Kung P.-P., Lowery K., Mohan V., Hofstadler S., Swayze E.E., et al. Synthesis and evaluation of novel bacterial rRNA-binding benzimidazoles by mass spectrometry. Bioorg. Med. Chem. Lett. 2004;14:695–699. doi: 10.1016/j.bmcl.2003.11.031. [DOI] [PubMed] [Google Scholar]
- Johnson B.A., Blevins R.A. NMRView: A computer program for the visualization and analysis of NMR data. J. Biol. NMR. 1994;4:603–614. doi: 10.1007/BF00404272. [DOI] [PubMed] [Google Scholar]
- Johnson P.E., Donaldson L.W. RNA recognition by the Vts1p SAM domain. Nat. Struct. Mol. Biol. 2006;13:177–178. doi: 10.1038/nsmb1039. [DOI] [PubMed] [Google Scholar]
- Johnson P.E., Tomme P., Joshi M.D., McIntosh L.P. Interaction of soluble cellooligosaccharides with the N-terminal cellulose-binding domain of Cellulomonas fimi CenC. 2. NMR and ultraviolet absorption spectroscopy. Biochemistry. 1996;35:13895–13906. doi: 10.1021/bi961186a. [DOI] [PubMed] [Google Scholar]
- Jucker F.M., Heus H.A., Yip P.F., Moors E.H.M., Pardi A. A network of heterogeneous hydrogen bonds in GNRA tetraloops. J. Mol. Biol. 1996;264:968–980. doi: 10.1006/jmbi.1996.0690. [DOI] [PubMed] [Google Scholar]
- Kaul M., Pilch D.S. Thermodynamics of aminoglycoside-rRNA recognition: The binding of eomycin-class aminoglycosides to the A site of 16S rRNA. Biochemistry. 2002;41:7695–7706. doi: 10.1021/bi020130f. [DOI] [PubMed] [Google Scholar]
- Kaul M., Barbieri C.M., Kerrigan J.E., Pilch D.S. Coupling of drug protonation to the specific binding of aminoglycosides to the A site of 16 S rRNA: Elucidation of the number of drug amino groups involved and their identities. J. Mol. Biol. 2003;326:1373–1387. doi: 10.1016/s0022-2836(02)01452-3. [DOI] [PubMed] [Google Scholar]
- Kaul M., Barbieri C.M., Pilch D.S. Aminoglycoside-induced reduction in nucleotide mobility at the ribosomal RNA A-site as a potentially key determinant of antibacterial activity. J. Am. Chem. Soc. 2006;128:1261–1271. doi: 10.1021/ja056159z. [DOI] [PubMed] [Google Scholar]
- Kay L., Xu G.-Y., Singer A., Muhnadiram D., Forman-Kay J. A gradient-enhanced HCCH-TOCSY experiment for recording side-chains 1H and 13C correlations in H2O samples of proteins. J. Magn. Reson. B. 1993;101:333–337. [Google Scholar]
- Leontis N.B., Westhof E. Geometric nomenclature and classification of RNA base pairs. RNA. 2001;7:499–512. doi: 10.1017/s1355838201002515. [DOI] [PMC free article] [PubMed] [Google Scholar]
- Maddaford S.P., Motamed M., Turner K., Choi M.S.K, Ramnauth J., Rakhit S., Hudgins R., Fabris D., Johnson P.E. Identification of a novel noncarbohydrate molecule that binds to the ribosomal A-site RNA. Bioorg. Med. Chem. Lett. 2004;14:5987–5990. doi: 10.1016/j.bmcl.2004.09.088. [DOI] [PubMed] [Google Scholar]
- Milligan J.F., Groebe D.R., Witherell G.W., Uhlenbeck O.C. Oligoribonucleotide synthesis using T7 RNA polymerase and synthetic DNA templates. Nucleic Acids Res. 1987;15:8783–8798. doi: 10.1093/nar/15.21.8783. [DOI] [PMC free article] [PubMed] [Google Scholar]
- Montange R.K., Batey R.T. Riboswitches: Emerging themes in RNA structure and function. Annu. Rev. Biophys. 2008;37:117–133. doi: 10.1146/annurev.biophys.37.032807.130000. [DOI] [PubMed] [Google Scholar]
- Raghunathan D., Sanchez-Pedregal V.M., Junker J., Schwiegk C., Kalesse M., Kirschning A., Carlomagno T. TAR-RNA recognition by a novel cyclic aminoglycoside analogue. Nucleic Acids Res. 2006;34:3599–3608. doi: 10.1093/nar/gkl494. [DOI] [PMC free article] [PubMed] [Google Scholar]
- Rana T.M. Illuminating the silence: Understanding the structure and function of small RNAs. Nat. Rev. Mol. Cell Biol. 2007;9:673–678. doi: 10.1038/nrm2085. [DOI] [PubMed] [Google Scholar]
- Schwieters C.D., Clore G.M. The VMD-XPLOR visualization package for NMR structure refinement. J. Magn. Reson. 2001;149:239–244. doi: 10.1006/jmre.2001.2300. [DOI] [PubMed] [Google Scholar]
- Schwieters C.D., Kuzewski J.J., Tjandra N., Clore G.M. The XPLOR-NIH molecular structure determination package. J. Magn. Reson. 2003;160:65–73. doi: 10.1016/s1090-7807(02)00014-9. [DOI] [PubMed] [Google Scholar]
- Staple D.W., Venditti V., Niccolai N., Elson-Schwab L., Tor Y., Butcher S.E. Guanidinoneomycin B recognition of an HIV-1 RNA helix. ChemBioChem. 2008;9:93–102. doi: 10.1002/cbic.200700251. [DOI] [PMC free article] [PubMed] [Google Scholar]
- Swayze E.E., Jefferson E.A., Sannes-Lowery K.A., Blyn L.B., Risen L.M., Arakawa S., Osgood S.A., Hofstadler S.A., Griffey R.H. SAR by MS: A ligand based technique for drug lead discovery against structured RNA targets. J. Med. Chem. 2002;45:3816–3819. doi: 10.1021/jm0255466. [DOI] [PubMed] [Google Scholar]
- Thomas J.R., Hergenrother P.J. Targeting RNA with small molecules. Chem. Rev. 2008;108:1171–1224. doi: 10.1021/cr0681546. [DOI] [PubMed] [Google Scholar]
- Tok J.B.-H., Cho J., Rando R.R. Aminoglycoside antibiotics are able to specifically bind the 5′-untranslated region of thymidylate synthase messenger RNA. Biochemistry. 1999;38:199–206. doi: 10.1021/bi9819428. [DOI] [PubMed] [Google Scholar]
- Varani G., Aboul-ela F., Allain F.H.T. NMR investigation of RNA structure. Prog. NMR Spec. 1996;29:51–127. [Google Scholar]
- Vicens Q., Westhof E. Crystal structure of paromomycin docked into the eubacterial ribosomal decoding A site. Structure. 2001;9:647–658. doi: 10.1016/s0969-2126(01)00629-3. [DOI] [PubMed] [Google Scholar]
- Vuister G.W., Bax A. Resolution enhancement and spectral editing of uniformly 13C-enriched proteins by homonuclear broadband 13C decoupling. J. Magn. Reson. 1992;98:428–435. [Google Scholar]
- Wijmenga S.S., van Buuren B.M.N. The use of NMR methods for conformational studies of nucleic acids. Prog. NMR Spe.c. 1998;32:287–387. [Google Scholar]
- Williams T.C., Shelling J.G., Sykes B.D. NMR approaches to the characterization of the interaction of metal ions with proteins. Plenum; New York: 1986. [Google Scholar]
- Wüthrich K. NMR of proteins and nucleic acids. Wiley; New York: 1986. [Google Scholar]
- Yu L., Oost T.K., Schkeryantz J.M., Yang J., Janowick D., Fesik S.W. Discovery of aminoglycoside mimetics by NMR-based screening of Escherichia coli A-site RNA. J. Am. Chem. Soc. 2003;125:4444–4450. doi: 10.1021/ja021354o. [DOI] [PubMed] [Google Scholar]


