

Abstract
Calcium-dependent exocytosis is regulated by a vast number of proteins. DOC2B is a synaptic protein that translocates to the plasma membrane (PM) after small elevations in intracellular calcium concentration. The aim of this study was to investigate the role of DOC2B in calcium-triggered exocytosis. Using biochemical and biophysical measurements, we demonstrate that the C2A domain of DOC2B interacts directly with the PM in a calcium-dependent manner. Using a combination of electrophysiological, morphological, and total internal reflection fluorescent measurements, we found that DOC2B acts as a priming factor and increases the number of fusion-competent vesicles. Comparing secretion during repeated stimulation between wild-type DOC2B and a mutated DOC2B that is constantly at the PM showed that DOC2B enhances catecholamine secretion also during repeated stimulation and that DOC2B has to translocate to the PM to exert its facilitating effect, suggesting that its activity is dependent on calcium. The hypothesis that DOC2B exerts its effect at the PM was supported by the finding that DOC2B affects the fusion kinetics of single vesicles and interacts with the PM SNAREs (soluble NSF attachment receptors). We conclude that DOC2B is a calcium-dependent priming factor and its activity at the PM enables efficient expansion of the fusion pore, leading to increased catecholamine release.
Keywords: DOC2B, priming, calcium, exocytosis, SNAREs, plasma membrane
Introduction
Calcium-regulated exocytosis is a process by which vesicles containing neurotransmitters or hormones fuse with the plasma membrane (PM). Before fusion, synaptic vesicles must undergo several maturation steps that include biogenesis of the vesicles, their translocation into the active zone, and their physical attachment to the PM in a process called docking (Augustine et al., 1999; Rettig and Neher, 2002; Richmond and Broadie, 2002; Sørensen, 2004; Sudhof, 2004; Becherer and Rettig, 2006; Toonen et al., 2006). A fraction of the docked vesicles undergo priming, which is a calcium-dependent process (Bittner and Holz, 1992; Burgoyne and Morgan, 1997; Smith et al., 1998; Voets, 2000; Rettig and Neher, 2002; Sørensen et al., 2003) that makes them fusion competent (Robinson and Martin, 1998). An action potential that propagates into the nerve terminal induces the opening of voltage-dependent calcium channels, and the primed vesicles undergo fusion; later on, they are recycled by endocytosis. Several groups of proteins coordinate this multistep process. Among them are the soluble NSF attachment receptor (SNARE) proteins that form the SNARE complex, which is thought to force the plasma and vesicular membranes into close proximity, thereby initiating membrane fusion (Sudhof, 2004; Jahn and Scheller, 2006) and possibly mediating formation of the fusion pore (Wang et al., 2001; Bai et al., 2004; Barclay et al., 2004; Han et al., 2004; Cohen et al., 2007).
Calcium ions (Ca2+) trigger the final step of vesicle fusion (Katz and Miledi, 1968; Schneggenburger and Neher, 2000) but also regulate other steps in the synaptic vesicle cycle, such as vesicle priming, vesicle-pool refilling, and endocytosis (Burgoyne and Morgan, 1995; Smith et al., 1998; Wang and Kaczmarek, 1998; Sudhof, 2004). In chromaffin cells, calcium plays an important role in vesicle priming, and elevation of the calcium concentration from 100 to 400 nm increases secretion severalfold (Bittner and Holz, 1992; von Rüden and Neher, 1993; Smith et al., 1998; Voets, 2000). However, the Ca2+ sensor(s) responsible for vesicle refilling and priming is still not well characterized.
DOC2 proteins were first described by Orita et al. (1995). The name DOC2 relates to the protein's structure: double C2 domain. The DOC2 family of proteins contains three isoforms designated DOC2A, DOC2B, and DOC2C (Orita et al., 1995, 1996). DOC2A, which is exclusively expressed in the CNS (Verhage et al., 1997), is the best-characterized isoform. Coexpression of DOC2A with growth hormone in PC12 cells results in enhanced secretion (Orita et al., 1996, 1997). In neurons, a secretion-enhancing role was suggested after the injection of a peptide that blocks the interaction of DOC2A with Munc13 into rat superior cervical ganglion cells (Mochida et al., 1998) and the calyx of Held (Hori et al., 1999). Mice lacking DOC2A exhibited normal neurotransmission in the hippocampal CA1–CA3 synapses, but abnormal frequency facilitation during prolonged stimulation at 5 Hz (Sakaguchi et al., 1999), suggesting a role for DOC2A during repeated stimulation.
The function of the second isoform, DOC2B, has not been extensively characterized. DOC2B is expressed in several brain regions as well as in endocrine cells, including chromaffin cells, pancreatic β cells, and adipocytes. Recently, DOC2B has been found to enhance glucose-induced secretion of insulin from MIN6 β cells (Ke et al., 2007). We and others found that both DOC2A and DOC2B are regulated by neuronal activity and translocate to the PM after elevation of calcium in the submicromolar range (Groffen et al., 2006; Malkinson and Spira, 2006). This mechanism can be attributed to the Ca2+-dependent affinity of the C2A domain for phospholipids (Ubach et al., 1998), a characteristic that is conserved in structurally similar C2 domains such as the C2A domain of synaptotagmin-I (Sutton et al., 1999). Therefore we hypothesized that DOC2B may regulate synaptic transmission in a calcium-dependent manner (Groffen et al., 2006). Despite the above-summarized work, it is still unclear whether DOC2 proteins act in the docking, priming, or fusion step of secretory events in neuroendocrine cells and neurons. Moreover, although DOC2B acts as a sensitive calcium sensor, a direct link between calcium and DOC2B's effects on the exocytotic process is unknown.
The present study aimed to clarify these questions by investigating the effects of DOC2B on catecholamine (CA) secretion from mouse adrenal chromaffin cells. We focused on DOC2B because it is the only DOC2 isoform that is endogenously expressed to a detectable level in chromaffin cells. We demonstrate that overexpression of DOC2B enhances vesicle fusion during stimulation. A mutated form of DOC2B, which is constantly at the PM, also enhanced the exocytotic response, albeit less efficiently, during sustained or repeated stimulation. We conclude that DOC2B acts as a calcium switch; in other words, intracellular calcium recruits DOC2B to the PM and therewith “switches on” its secretion-enhancing function.
Materials and Methods
Chromaffin cells isolated from the adrenal medullae of adult ICR mice (4–8 weeks of age) were used in this study, as previously described (Fulop et al., 2005). Cells were used 1–4 d after preparation. Animals were deeply anesthetized by isoflurane inhalation and killed by decapitation (animal welfare assurance number: A5010-01). For in situ hybridization, adrenal glands and testes from C57BL/6 mice were processed as described previously (Groffen et al., 2005). Animals were housed and bred according to institutional Dutch and Israeli governmental guidelines.
Expression vectors and viral gene transfer
For electrophysiology measurements, rat DOC2B and enhanced green fluorescent protein (EGFP) were expressed as separate molecules from a single mRNA using an internal ribosome entry site (IRES). To this end, the 1316 bp SalI-BamHI fragment of pEGFP-N2-DOC2B (Groffen et al., 2004) was ligated into the corresponding sites of pIRES2-EGFP (Clontech). The NheI-XbaI fragment of the resulting plasmid was subcloned into the BlnI site of pSFV-li (Groffen et al., 2006). For more information, see GenBank accession numbers EU635444 for wild-type DOC2B (DOC2Bwt) and EU635445 for DOC2BD218,220N. Semliki infective virions were produced as described previously (Ashery et al., 1999). For total internal reflection fluorescence microscopy (TIRFM) studies, NPY-Venus (a fusion protein consisting of human neuropeptide Y and the fluorescent protein Venus) was used instead of EGFP. As a control group, we used vectors that lacked DOC2B but were otherwise identical. To prepare cDNA encoding mutant DOC2BD218,220N, we used the QuikChange method and replaced guanosine residues 807 and 813 with adenosines. All vectors were verified by sequence analysis.
DOC2B immunostaining
Cells were fixed in two steps in room temperature, first in 2% paraformaldehyde for 20 min and then in 4% paraformaldehyde for 20 min, and washed twice with PBS. Cells were then permeabilized with 0.01% Triton X-100 (Sigma) for 5 min and blocked with 3% BSA and goat γ-globulin (diluted 1:55; Jackson ImmunoResearch Laboratories) for 1 h. Then we incubated the cells with a primary rabbit anti-DOC2B antibody (pAb 13.2) diluted 1:50 in primary antibody diluting buffer (Biomeda) for 1 h. After three washes with PBS, the cells were incubated with goat anti-rabbit conjugated to Cy3 (Jackson ImmunoResearch Laboratories) diluted 1:75 in PBS for 45 min. The cells were washed four times with PBS and mounted on microscope slides using gel/mount (Biomeda). Epifluorescence images of EGFP-expressing cells and their matching DOC2B antibody staining were acquired using Image-Pro Plus (Media Cybernetics) software and Nikon TE2000–5 microscope equipped with CoolSNAP HQ camera (PhotoMetrics) and X-Cite120 120 lamp (EXFO Life Sciences & Industrial Division) with the appropriate filter sets for GFP and rhodamine detection. For each cell, we measured the average fluorescence intensity at both wavelengths using WCIF ImageJ (http://www.uhnresearch.ca/facilities/wcif/). We found a linear relation between GFP fluorescence and expression levels of both DOC2BD218,220N and DOC2Bwt (supplemental Fig. S1, available at www.jneurosci.org as supplemental material), similar to our previous findings with tomosyn and ubMunc13-2 (Yizhar et al., 2007; Zikich et al., 2008). Therefore, to minimize the effects of cell-to-cell variation in our comparative electrophysiological experiments attributable to different expression levels, we systematically selected cells that exhibited similar EGFP fluorescence levels.
Western blotting
Western blot experiments were performed according to standard procedure. In general, protein extracts (for overexpression experiments ∼10 μg of protein, for endogenous experiment ∼100 μg of protein) were loaded on an SDS-polyacrylamide (8 or 11%) gel and run by electrophoresis in a constant current of 30 mA for each gel. The proteins from the gel were transferred to a nitrocellulose membrane by electroblotting in a constant current of 400 mA for 1 h. The membrane was incubated in blocking solution (5% milk powder) overnight at 4°C with gentle agitation. After 5 washings, we incubated the membrane with primary rabbit anti-DOC2B antibody for 1 h at room temperature (diluted 1:500 in 1% BSA with 0.05% azide). The membrane was washed five times and incubated with the relevant secondary horseradish peroxidase-conjugated antibody for 45 min at room temperature (diluted 1:15,000 in milk). Then the membrane was washed six times, and detection was done using enhanced chemiluminescence solution (Pierce) and exposure to Super RX film (Fuji). Expression levels of DOC2Bwt and DOC2BD218,220N were quantified by Western blot and found to be similar (supplemental Fig. S1, available at www.jneurosci.org as supplemental material).
Phospholipid-binding assays
Chelated Ca2+/EGTA solutions contained 50 mm HEPES, pH 7.4, 100 mm KCl, 10 mm Na2EGTA, and varying concentrations of CaCl2 (range 0–10 mm). The desired [Ca2+]free of each solution was predicted by WinMaxc (http://www.stanford.edu/∼cpatton/maxc.html). To verify the actual [Ca2+]free of each solution, fluorescence excitation spectra were recorded at an emission wavelength of 510 nm on an LS50B luminescence spectrometer (PerkinElmer) in the presence of 0.07 μm fura-2 (Invitrogen) and in our calibrated electrophysiological setup. The [Ca2+]free was calculated as Kd × [(R − Rmin)/(Rmax − R)] × (Fmax380/Fmin380), where F380 is the fluorescence intensity at λex = 380 nm and R is the ratio F340/F380. KdEGTA was measured at 0.314 μm.
Liposomes were prepared from 1,2-dioleoyl-sn-glycero-3-[phospho-l-serine] (Avanti Polar Lipids) at a total phospholipid concentration of 1 mg/ml in 50 mm HEPES, pH 7.4, and 100 mm KCl as described previously (Groffen et al., 2004). Fusion proteins comprised of glutathione S-transferase (GST) and amino acids 125–255 of rat DOC2Bwt (plasmid SG#160) or DOC2BD218,220N (SG#307) were expressed and purified as previously described (Groffen et al., 2004). For kinetics measurements of phospholipid binding, a mixture of 60 μl of Ca2+/EGTA solution and 20 μl of liposomes was placed in a 1 cm quartz cuvette, and the A350 was measured for 1200 s at 1 s intervals in a SmartSpec3000 spectrophotometer (Bio-Rad). After 160 s, 10 μg of GST-C2A protein was added, causing liposome aggregation and a concurrent increase in A350 because of the dimeric nature of GST. Several controls were included to validate the assay: the A350 increase was not observed after addition of GST, required the presence of phosphatidylserine, and was linearly dependent on the concentration of GST-C2A. In addition, incubating the GST-proteins with calcium in the absence of the liposome did not cause an increase in the absorbance at 350 nm, excluding the possibility that the absorbance increase was caused by protein aggregation (supplemental Fig. S2, available at www.jneurosci.org as supplemental material)
C2B/SNARE binding reactions
Syntaxin/SNAP-25 binding to GST-C2B glutathione beads was as described previously (Rickman et al., 2004). Briefly, 1 μg of brain-purified syntaxin, recombinant SNAP-25, or syntaxin/SNAP-25 dimer was incubated for 90 min at 4°C with 2 μg of GST-C2B and immobilized on glutathione beads. The beads were then washed three times and loaded onto SDS-polyacrylamide gel. Bound protein was analyzed either by using the protein stain Sypro Ruby (Invitrogen) or by Western immunoblotting with a polyclonal anti-SNAP-25 antibody (Rickman et al., 2004).
Electrophysiological and electrochemical measurements
Solutions.
The external solution contained the following (in mm): 140 NaCl, 3 KCl, 2 CaCl2, 2 MgCl2, 10 HEPES, and 2 mg/ml d-glucose, pH 7.3 (osmolarity was adjusted to 300 mOsm). Equimolar NaCl was replaced with 70 mm KCl and 10 mm CaCl2 in the high-potassium/high-calcium stimulation for repeated stimulation experiments. The pipette solution contained the following (in mm): 145 Cs-Glu, 2 MgATP, 0.3 GTP, 10 HEPES, 0.2 fura-2FF (TefLabs), 0.2 fura-2 (Invitrogen), 6 NP-EGTA (G. Ellis-Davis; MCP, Hahnemann University, Philadelphia, PA), and 3 CaCl2, pH 7.2.
Calcium measurements.
Intracellular calcium concentration ([Ca2+]i) was measured by dual-wavelength ratiometric fluorometry with a mixture of the indicator dyes fura-2 (Kd = 225 nm) and fura-2FF (Kd = 15 μm). The dyes were excited with light alternating between 350 and 380 nm using a monochromator-based system (Till Photonics), and the resulting fluorescent signal was measured using a photomultiplier. The illumination area was reduced to cover only the diameter of the cell. To convert the ratio R of the fluorescent signals at both wavelengths into [Ca2+]i, a calibration curve was constructed, where each data point corresponded to the average ratio obtained during in vivo measurements using pipette solutions with free Ca2+ buffered to respective concentrations (Voets, 2000). The calcium concentration before the flash was ∼300 nm. Flash intensity was adjusted to trigger an elevation of [Ca2+]i to 10–20 μm. After the flash, we illuminated the cells with a xenon lamp to enable further photolysis of Ca2+ from the Ca2+ cage, allowing us to maintain Ca2+ levels at 10–20 μm during the 5 s after the flash. For repeated stimulation experiments, cells were loaded with fura-4 AM as previously described (Groffen et al., 2006). All data represent means, and error bars represent SEM.
Whole-cell capacitance measurements.
Experiments were performed at room temperature. Pipettes of ∼5–8 MΩ resistance were pulled from borosilicate glass (Kimbel Glass), partially coated with Sylgard, and lightly fire polished. Conventional whole-cell recording was performed with EPC-10 amplifier and PULSE software (HEKA Electronik). Capacitance measurements used the Lindau-Neher technique implemented as the “sine+DC” feature of the PULSE lock-in module. A 1000 Hz, 70 mV peak-to-peak sinusoid voltage stimulus was applied above a DC holding potential of −70 mV. Data were acquired through a combination of the high-time-resolution PULSE software and lower-time-resolution X-Chart plug-in module to the PULSE software. The capacitance traces were imported by IGOR Pro software (WaveMetrics). The analyses of dual flash experiments were conducted on a Macintosh using the IGOR Pro software. Displayed traces are averages for each condition, with the number of cells (n) given in the figure legends. To control for variation between preparations, we always compared manipulated cells with control cells (both transfected) obtained from the same preparation. Kinetics data were obtained by fitting individual capacitance recordings with a sum of three exponential functions. Data are given as the mean ± SEM; one-way ANOVA and Dunn's test were used for statistical analysis.
Amperometry measurements and analysis.
Carbon-fiber electrodes were prepared as described previously (Xu et al., 1999). A constant voltage of 800 mV versus an Ag/AgCl reference was applied to the electrode. The tip of the carbon fiber was pressed gently against the cell surface. The amperometric current was recorded with a VA-10 amplifier (NPI Electronic). The amperometric current was sampled at 10 kHz and further digitally filtered at 1 kHz. Amperometric spikes were analyzed using a newly developed algorithm (MATLAB; The MathWorks) that separates spikes from the noise to avoid the need of filtering (R. Friedrich and U. Ashery, unpublished work). A median value for each parameter was taken from every cell. The medians' vectors were assessed for normal distribution by Lilliefors test and box plot. If the vectors did not distribute normally, we performed a log operation and Kruskal–Wallis test, and Dunn's test for post hoc. For normally distributed vectors, the equality of variances was assessed with Bartlett's test. For unequal variances, the Welch test was applied and the Games-Howel (GH) test was used post hoc. For equal variances, ANOVA was applied and Tukey–Kramer was used as a post hoc test. Accordingly, statistical analysis of the charge was compared with one-way ANOVA (Welch) and post hoc GH test. The rise time of the spike was compared with one-way ANOVA and post hoc Tukey–Kramer. The duration and half-width of the spikes were compared using one-way ANOVA (Welch) and GH post hoc. Number of spikes was compared with one-way ANOVA, and number of foots was compared with Kruskal–Wallis test and Dunn post hoc.
Electron microscopy
Chromaffin cells were cultured as above on gridded coverslips (Bellco Glass) and infected with Semliki constructs to express EGFP alone, DOC2Bwt-IRES-EGFP, or DOC2BD218,220N-IRES-EGFP. Cells were fixed at 8 h after infection by 2.5% glutaraldehyde in 0.1 m cacodylate buffer, and then embedded in EPON epoxy resin and prepared for electron microscopy (EM) as described previously (Toonen et al., 2006). The distribution of large, dense-core vesicles (LDCVs) was analyzed in a JEOL 1010 electron microscope at 20,000× magnification. The perimeter and surface area of the cell section were analyzed at 6000× magnification. All quantitation was performed by custom-written software running in MATLAB. LDCVs were identified by their electron-dense core surrounded by a vesicular membrane of ∼100 nm in diameter. Experiments were performed blind for the constructs used.
TIRFM
An inverted Olympus IX-70 microscope equipped with a TIRF condenser (TILL Photonics) was used to view the cells under TIRF illumination. Excitation light at 473 nm was provided by a solid-state laser (Laser Quantum) coupled into a single fiber-optic cable that was connected to the TIRF condenser. The laser was focused into the back focal plane of a high-numerical-aperture lens (X60; numerical aperture = 1.45) designated for TIRFM imaging (Olympus). The characteristic 1/e depth d for the evanescent field was calculated to be ∼150 nm. The microscope was equipped with a special filter set for GFP with a 500 nm dichroic mirror. Time-lapse live imaging was captured using an Andor iXon 887 EMCCD camera controlled by MetaMorph software (Universal Imaging). Time-lapse images were taken every 300 ms. Chromaffin cells in primary culture were infected with Semliki infectious particles encoding NPY-Venus alone (control), DOC2Bwt and NPY-Venus, or DOC2BD218,220N and NPY-Venus connected with an IRES. Experiments were performed 16–24 h after infection. For quantification, vesicles were automatically detected in IGOR Pro v5.0.5.7 by a home-written macro (vesicle detection v1.74). For vesicle tracking, the x–y coordinates of vesicles were determined by two-dimensional (2D) Gaussian fitting as described previously (Toonen et al., 2006). Mean square displacement and caging diameter were calculated as described previously (Nofal et al., 2007) using home-written algorithms.
Fluorescence recovery after photobleaching experiments
Chromaffin cells infected with DOC2BD218,220N-EGFP or EGFP alone were taken for fluorescence recovery after photobleaching (FRAP) studies 5–10 h after infection. Measurements were performed in external solution at 22°C. An argon ion laser beam (Innova 70C; Coherent) was focused through a fluorescence microscope (Universal; Carl Zeiss Micro-Imaging) to a Gaussian spot of 0.85 ± 0.02 μm (63× oil-immersion objective) or 1.36 ± 0.04 μm (40× objective), and FRAP experiments were conducted with each beam size [beam-size analysis (Henis et al., 2006; Shvartsman et al., 2007)], allowing calculation of the relative contribution of lateral diffusion and exchange to the recovery time course. If FRAP occurs exclusively by lateral diffusion, the characteristic fluorescence recovery time τ (t1/2 for recovery) is the characteristic diffusion time, τD, proportional to the area illuminated by the beam. When FRAP occurs only by exchange, τ is the chemical relaxation time, which is independent of the beam size (Henis et al., 2006). The τ(40×)/τ(63×) ratio expected for the two beam sizes is 2.56 ± 0.3 [n = 39; the measured ratio between the illuminated areas (Shvartsman et al., 2007)] for recovery by pure lateral diffusion, versus 1 for exchange; intermediate values suggest a mixed recovery mode, in which the faster process has a higher contribution (Henis et al., 2006). After a brief measurement at monitoring intensity (488 nm, 1 μW), a 5 mW pulse (5 ms) bleached 60–75% of the fluorescence in the spot, and recovery was followed by the monitoring beam. The apparent characteristic fluorescence recovery time τ and the mobile fraction (Rf) were extracted from the FRAP curves by nonlinear regression analysis, fitted to a lateral diffusion process (Petersen et al., 1986).
Results
We have performed in situ hybridization with specific probes for DOC2A, DOC2B, and DOC2C and found that only DOC2B is detected in mouse adrenal chromaffin cells (supplemental Fig. S3, available at www.jneurosci.org as supplemental material). DOC2B is located in the cytoplasm under resting conditions and translocates to the PM after small (submicromolar range) elevations in [Ca2+]i (Groffen et al., 2006; Malkinson and Spira, 2006). These changes in [Ca2+]i correlate to those that enhance vesicle priming in chromaffin cells (Voets, 2000), suggesting that DOC2B is involved in calcium-dependent priming. Thus, DOC2B can act as a calcium switch similar to the calcium-dependent function of PKC (protein kinase C) (Oancea and Meyer, 1998; Maasch et al., 2000). To test whether calcium also activates DOC2B, we used a mutated variant of DOC2B, DOC2BD218,220N, which is constitutively associated with the PM (Groffen et al., 2006). In this mutant, the neutralization of two negatively charged residues in the Ca2+-binding pocket (D218,220N) presumably stabilizes a direct interaction between the C2A domain and the negatively charged phospholipid surface.
DOC2B interacts with the PM
To better understand how the C2A of DOC2B interacts with the PM, we performed liposome-binding assays. We compared Ca2+-dependent binding of recombinant GST-C2A fragments of DOC2Bwt and DOC2BD218,220N to phosphatidylserine-containing liposomes (Fig. 1). The addition of recombinant GST-C2A to a mixture of liposomes and Ca2+ rapidly induced liposome aggregation because of the dimeric nature of GST, measured as absorbance at 350 nm (Connell et al., 2008). GST alone did not induce aggregation (data not shown). As expected, the wild-type C2A domain bound to liposomes in a strictly Ca2+-dependent manner (Fig. 1A,C). Liposome binding was negligible at [Ca2+]free < 100 nm, half-maximal at ∼1 μm, and maximal at 4 μm (Fig. 1C, black circles). In contrast, the mutant C2A domain bound to liposomes in a Ca2+-independent manner (Fig. 1B,C). Increasing BAPTA concentration gradually inhibited liposome aggregation induced by GST-C2A mutant (data not shown), supporting our in vivo observation that at very low calcium concentrations, DOC2BD218,220N association with the PM is reduced (Groffen et al., 2006). No difference in size or stability of the recombinant fragments was detected by SDS-PAGE (Fig. 1D). These data support the view that the Ca2+-dependent association of DOC2B with the PM is mediated via its C2A domain.
Figure 1.

The C2A domain of DOC2B interacts with phospholipids in a calcium-dependent manner. A, B, Recombinant GST-C2A fusion protein was added to a mixture of Ca2+ and liposomes (arrowhead indicates the time of protein addition). Ca2+-dependent phospholipid binding by the C2A domain, dimerized via the GST moiety, caused liposome aggregation, measured as an increase in absorption at 350 nm. Numbers in the graph correspond to the [Ca2+]free of calibrated Ca2+/EGTA solutions (blue to red colors indicate low to high [Ca2+]free). Liposome binding by GST-C2Awt was highly Ca2+ dependent (A), whereas GST-C2AD218,220N showed Ca2+-independent binding (B). C, Summary of data showing the calcium dose dependence of phospholipid binding (average ± SEM; n = 8). D, Recombinant GST-C2Awt and GST-C2AD218,220N appeared similar in SDS-PAGE. The positions of molecular size markers are indicated at the left. GST alone did not induce any liposome aggregation (data not shown).
DOC2B enhances secretion in a calcium-dependent manner
In our previous work, we described the ability of DOC2Bwt to reversibly associate with the PM after elevation of [Ca2+]i. To check the physiological relevance of this behavior, we measured the effects of a repeated stimulation protocol on secretion, using the following stimulation paradigm: DOC2Bwt translocates to the PM when [Ca2+]i rises and detaches again when [Ca2+]i decreases (Groffen et al., 2006); in contrast, DOC2BD218,220N remains at the PM during the entire experiment. We overexpressed either DOC2Bwt or DOC2BD218,220N (separated with an IRES from EGFP) in adult mouse chromaffin cells using Semliki Forest virus (SFV)-mediated gene transfer (Ashery et al., 1999), and confirmed expression of the proteins by Western blotting and immunofluorescence (supplemental Fig. S1, available at www.jneurosci.org as supplemental material). Control cells were infected with virions encoding EGFP. The cells were depolarized repeatedly by short (10 s) applications of high-potassium solution, and CA secretion was measured by carbon-fiber amperometry. Throughout the experiment, changes in [Ca2+]i were monitored by ratiometric imaging of intracellular fura-4 (Groffen et al., 2006).
In response to the first depolarization, DOC2Bwt overexpression caused an almost twofold increase in CA secretion compared with control cells, whereas DOC2BD218,220N overexpression caused a nearly threefold increase (Fig. 2A). With the next five stimulations, the secretion-enhancing effect of DOC2Bwt increased to 2.5-fold compared with control cells (255 ± 18%), whereas the effect of DOC2BD218,220N gradually diminished to a twofold increase after the second stimulus and an average 1.5-fold increase in the next four stimuli (Fig. 2A). The secretion-enhancing effect of DOC2Bwt was significant from the second stimulus onwards (p < 0.05; see Materials and Methods for statistical considerations), whereas that of DOC2BD218,220N was only significant during the first (p < 0.01) and second (p < 0.05) stimulation. The calcium concentrations were not different between the three groups, ruling out the possibility that the decreasing secretion in DOC2BD218,220N cells was attributable to lack of [Ca2+]i increase (data not shown). This demonstrates for the first time that DOC2B enhances secretion from chromaffin cells. Moreover, these experiments demonstrate that DOC2Bwt enhances secretion during repeated stimulation. The failure of DOC2BD218,220N to enhance secretion in the later stimuli may be explained either by its inability to translocate, suggesting that translocation is vital for DOC2B activity, or by a relatively slow activity of the mutant protein (see Discussion).
Figure 2.
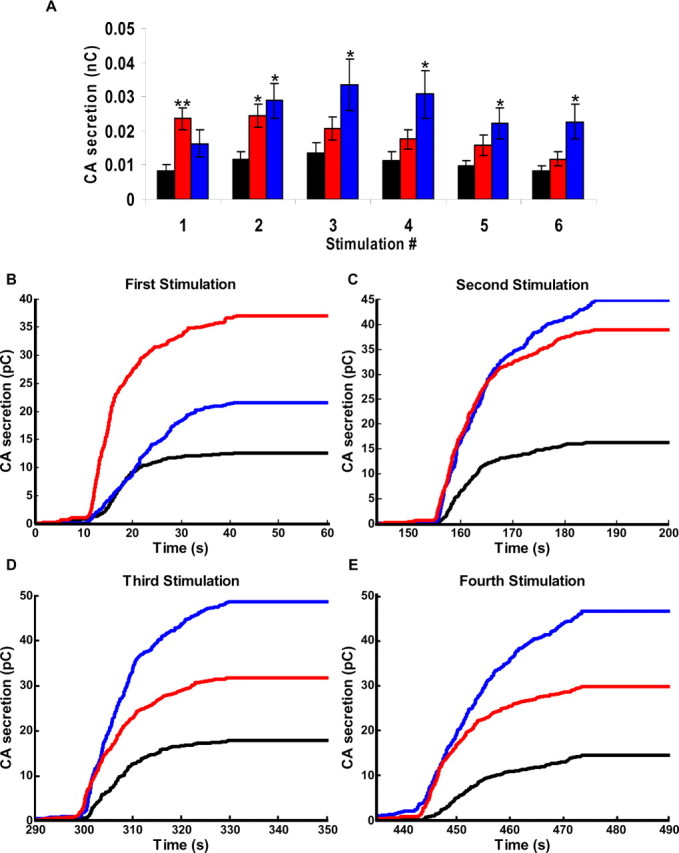
DOC2Bwt enhances secretion during repeated stimulations compared with control and DOC2BD218,220N. Adult mouse adrenal chromaffin cells were depolarized repeatedly, and CA release was measured by carbon fiber amperometry. A, Mean CA secretion during stimulation of EGFP control (black; n = 18), DOC2Bwt (blue; n = 17), and DOC2BD218,220N (red; n = 24). Secretion in DOC2BD218,220N was significantly larger than EGFP controls in the first (**p < 0.01) and second (*p < 0.05) stimulus, but not during subsequent stimuli. DOC2Bwt significantly enlarged the secretory response from the second stimulus on (*p < 0.05). B–E, Integration of the amperometric currents of the first four stimulations, respectively. B, During the first stimulation, the secretion slope is much steeper in DOC2BD218,220N than in DOC2Bwt and the EGFP control. C, At the second stimulation, both DOC2BD218,220N and DOC2Bwt support significant increased secretion, and their slopes are similar. D, E, During the third and fourth stimulations, the secretion slopes of DOC2Bwt and DOC2BD218,220N are steeper than EGFP control cells, whereas secretion in DOC2Bwt is larger than EGFP control and DOC2BD218,220N cells.
Before the first stimulation, the [Ca2+]i is ∼50 nm. At this concentration, DOC2Bwt is found in the cytoplasm, whereas DOC2BD218,220N is at the PM (Groffen et al., 2006). The significantly higher secretion in DOC2BD218,220N cells during the first stimulation might result from its constitutive association with the PM, and this might also affect the fusion kinetics. To measure the fusion kinetics, we integrated the amperometric current of each stimulation separately (Fig. 2B–E). In response to the first stimulation, secretion from DOC2BD218,220N-expressing cells had a steeper slope compared with that of DOC2Bwt-expressing cells (Fig. 2B), supporting the hypothesis that DOC2BD218,220N exerts a facilitating function at the PM. However, already at the second depolarization (Fig. 2C), the secretion slope of DOC2Bwt was similar to that of DOC2BD218,220N-expressing cells. During subsequent stimulations, the secretion in DOC2BD218,220N and DOC2Bwt cells followed a similar slope, but secretion was significantly larger in DOC2Bwt cells (Fig. 2D,E). Thus, DOC2BD218,220N exerts a facilitating effect at PM, whereas DOC2Bwt has to translocate to the PM to enhance secretion. In addition, the finding that DOC2Bwt does not reach maximal effect during the first stimulation suggests that its effect is time dependent.
DOC2B enhances the number of fusion-competent vesicles
To pinpoint the exact stage of exocytosis in which DOC2B might be involved, we measured changes in membrane capacitance (Cm) in response to flash photolysis of caged-calcium stimulation. In the previous set of experiments (Fig. 2), we had stimulated the cells from a low resting [Ca2+]i (50–100 nm), which does not support priming, and found that DOC2BD218,220N was more efficient in the first stimulation, whereas DOC2Bwt was more prominent from the second stimulus on (after calcium elevation). That stimulation, which mimicked the effect on secretion under low-calcium conditions, emphasized the effect of DOC2BD218,220N on secretion. In this experiment, we were interested in accentuating DOC2Bwt's physiological response, and we therefore wanted to examine secretion after priming (Voets, 2000; Zikich et al., 2008). Accordingly, we moderately elevated the preflash [Ca2+]i in the cells to ∼300 nm for 30 s to enhance vesicle priming before the flash stimulation and to cause the translocation of DOC2Bwt to the PM.
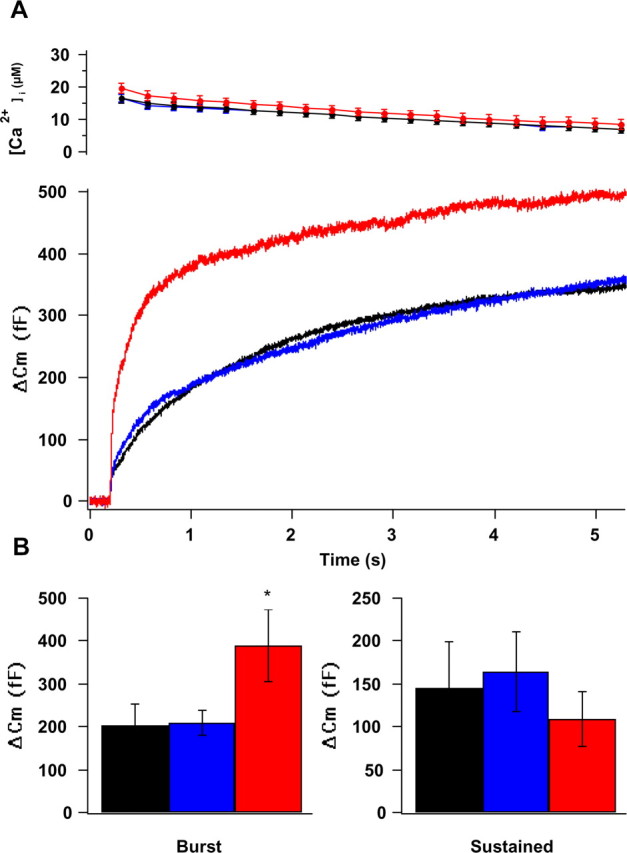
In response to stimulation by flash photolysis of caged calcium, control cells displayed a typical biphasic increase in membrane capacitance, in which an exocytotic burst is followed by a sustained phase of secretion (Fig. 3A, Cm, bottom graph). The exocytotic burst results from the fusion of two pools of vesicles in two different fusion-competent states, and the sustained phase represents the fusion of vesicles that are recruited and undergo priming from an unprimed pool during the Ca2+ pulse (Ashery et al., 2000; Neher, 2006). In response to the flash stimulation, the burst component was increased in both DOC2Bwt- and DOC2BD218,220N-expressing cells, albeit to a smaller extent in the latter (Fig. 3B, left). The sustained component was decreased significantly in DOC2BD218,220N-expressing cells (Fig. 3B, right). Because of the enhanced burst in DOC2Bwt cells, the overall amplitude of the capacitance response during the 5 s stimulation was increased in DOC2Bwt relative to control, EGFP-expressing cells (Fig. 3A, Cm, bottom graph). In contrast, DOC2BD218,220N changed the ratio between the burst and sustained exocytosis but did not increase the overall amplitude compared with control cells during the 5 s stimulation (Fig. 3A, Cm, bottom graph). Thus, elevation of calcium to ∼300 nm before the stimulation accentuated DOC2Bwt activity, and overall secretion in DOC2Bwt was already larger during the first stimulation compared with control and DOC2BD218,220N cells (Fig. 3A, Cm, bottom graph).
Figure 3.

Overexpression of DOC2Bwt or DOC2BD218,220N causes an increase in the exocytotic burst in adrenal chromaffin cells. A, B, Exocytotic response during the first flash. A, Top graph, Averaged [Ca2+]i during flash photolysis of caged calcium. Error bars represent SEM. Bottom graph, Averaged capacitance change (ΔCm) during 5 s stimulation of cells expressing DOC2Bwt (blue; n = 27), DOC2BD218,220N (red; n = 41), or EGFP control (black; n = 43). B, Averaged capacitance change during the exocytotic burst (left) and sustained phase (right) for cells expressing DOC2Bwt (blue), DOC2BD218,220N (red), or EGFP control (black). C, D, Combined capacitance and amperometry measurements during the first flash stimulus show that secretion in DOC2BD218,220N is smaller during the sustained component. C, Averaged [Ca2+]i (top graph) and capacitance change (ΔCm; bottom graph). D, Amperometric current (left axis) and integrated amperometric current (right axis) during the 5 s stimulation of cells expressing DOC2Bwt (blue; n = 16), DOC2BD218,220N (red; n = 15), or EGFP control (black, n = 15). E, F, DOC2B wt also enhances secretion during the second flash stimulation. E, Averaged [Ca2+]i (top graph) and capacitance change (ΔCm; bottom graph) during the second flash stimulation of cells expressing DOC2Bwt (blue; n = 24), DOC2BD218,220N (red; n = 35), or EGFP (black; n = 37). F, Averaged capacitance changes during the exocytotic burst (left) and sustained phase (right) of cells expressing DOC2Bwt (blue), DOC2BD218,220N (red), or EGFP control (black). *p < 0.05; **p < 0.01.
In a complementary experiment, we kept the preflash [Ca2+]i low (100–150 nm) to reduce priming (Voets, 2000; Zikich et al., 2008). Under these low priming conditions, DOC2BD218,220N-expressing cells showed enhanced secretion compared with both DOC2Bwt and control, EGFP-expressing cells (Fig. 4). Thus, in agreement with the depolarization experiments (Fig. 2), the presence of DOC2BD218,220N at the PM enhances exocytosis already at low calcium levels, whereas the DOC2Bwt has to translocate to the PM after calcium elevation to perform its function.
Figure 4.
DOC2BD218,220N enhances secretion without priming. A, B, exocytotic response of chromaffin cells stimulated directly with a high-intensity UV flash under conditions of low preflash calcium, as opposed to the standard paradigm, in which preflash [Ca2+]i was elevated to ∼300 nm for 30 s. A, Top graph, Averaged [Ca2+]i during flash photolysis of caged calcium. Error bars represent SEM. Bottom graph, Averaged capacitance change (ΔCm) during 5 s stimulation of cells expressing DOC2BD218,220N (red; n = 8), DOC2Bwt (blue; n = 11), or EGFP (black, n = 10). B, Averaged capacitance change during the exocytotic burst (left) and sustained phase (right) for cells expressing DOC2BD218,220N (red), DOC2Bwt (blue), or EGFP (black). *p < 0.05.
We next performed multiple-exponential fitting to determine whether DOC2B affects the two vesicle pools that comprise the exocytotic burst similarly (Xu et al., 1998). In general, the fast burst component (τ ∼ 30 ms) results from the fusion of vesicles from a readily releasable pool (RRP), whereas the slow phase (τ ∼ 300 ms) represents the fusion of vesicles from a slowly releasable pool [SRP (Xu et al., 1998)]. The detailed kinetics analysis revealed a significant increase of the RRP (one-way ANOVA, Dunn's test, p < 0.001) in both DOC2Bwt (146 ± 19 fF; n = 26) and DOC2BD218,220N (145 ± 13 fF; n = 38) compared with controls (EGFP-expressing cells, 65 ± 8 fF; n = 33), whereas the SRP was increased to a larger extent in DOC2Bwt (135 ± 19 fF) compared with DOC2BD218,220N (107 ± 11 fF) and control cells (58 ± 7 fF).
To determine whether the smaller sustained component of DOC2BD218,220N resulted from a decrease in secretion or an increase in endocytosis, we performed another set of flash experiments, this time in combination with carbon-fiber amperometry to enable direct detection of CA secretion. The amperometric measurements revealed less amperometric activity in DOC2BD218,220N during the sustained phase (Fig. 3D). This decrease in secretion is better illustrated in the slope of the integrated amperometric charge as a function of time (Fig. 3D, right axis). The slope of DOC2BD218,220N is less steep during the late phases of secretion relative to the other groups. The data suggest that there was less secretion in DOC2BD218,220N cells during the sustained component (Fig. 3C,D). In addition, the larger amperometric currents during the burst component in DOC2BD218,220N and DOC2Bwt cells relative to controls suggest that the increased membrane capacitance in DOC2B-overexpressing cells can be attributed to the increased secretion of CA. The membrane-capacitance recording from this set of experiments (Fig. 3C) also resembled the previous experiment, showing a larger burst and smaller sustained component for DOC2BD218,220N cells (Fig. 3A,B). Together, these data also suggest that whereas DOC2Bwt maintains higher secretion throughout the whole period of the flash stimulation, secretion in DOC2BD218,220N starts to decrease during the slow-burst component, as reflected by a smaller SRP (compared with DOC2Bwt, kinetics analysis) and reduced secretion in the sustained component (Fig. 3C).
To examine the ability of the cells to refill the releasable vesicle pools that are depleted during the flash stimulation (Nagy et al., 2002; Nili et al., 2006), we applied a second flash stimulus 2 min after the first. The ability of DOC2Bwt to increase the exocytotic burst in response to the second flash stimulation was even larger than after the first stimulation (Fig. 3E, Cm, bottom trace). In contrast, DOC2BD218,220N increased the exocytotic response to a smaller extent compared with both its first response and DOC2Bwt's response (Fig. 3B,F, left) and caused a large reduction in sustained release (Fig. 3F, right). The data from Figures 2 and 3 consistently demonstrate that calcium-induced priming by DOC2B contributes to activity-dependent replenishment of the releasable pools.
DOC2B functions downstream of vesicle docking
The enhanced exocytosis in DOC2B-overexpressing cells could result from the enhancement of either vesicle docking or vesicle priming. To distinguish between these two possibilities, we quantified the number of docked vesicles using EM and TIRFM. In EM, cells expressing DOC2Bwt or DOC2BD218,220N did not show any morphological abnormalities compared with controls (Fig. 5A–F). Quantitative analysis revealed that neither DOC2Bwt nor DOC2BD218,220N alters the relative distribution of vesicles with respect to the PM (Fig. 5G). Moreover, the total number of vesicles was not significantly different at any particular distance from the cell membrane (Fig. 5H). No significant change was detected in vesicle diameter (114 ± 2.6 nm for EGFP cells, 123 ± 4.2 nm for DOC2BD218,220N cells, and 128 ± 3.8 nm for DOC2Bwt cells). Most importantly, the number of morphologically docked vesicles, defined as vesicles that are in direct contact with the PM, also did not differ (Fig. 5J). We also used TIRFM to visualize fluorescently tagged vesicles in the juxtamembrane region of living chromaffin cells. Chromaffin cells were infected with SFV encoding NPY-Venus alone (as a control) or with an IRES with DOC2Bwt or DOC2BD218,220N. Expression of DOC2B proteins was confirmed by Western blotting (data not shown). We did not observe any difference in the number of vesicles in the evanescent field in this set of experiments either (Fig. 6A), and concluded that the secretion-enhancing function of DOC2B occurs downstream of vesicle docking.
Figure 5.
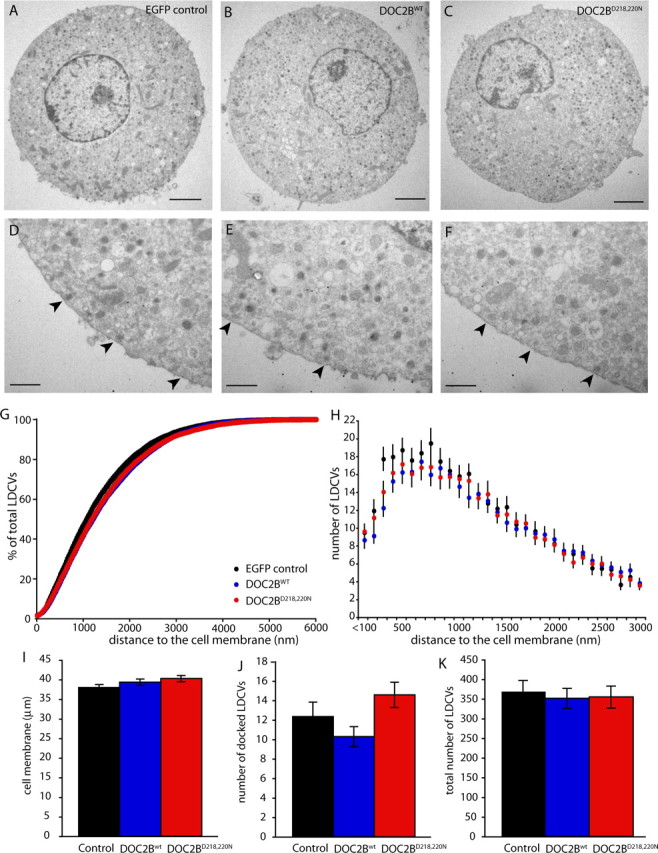
DOC2Bwt and DOC2BD218,220N do not alter the distribution of LDCVs. A–F, Typical example micrographs of adult mouse chromaffin cells expressing the EGFP control construct (A, D), DOC2Bwt (B, E), and DOC2BD218,220N (C, F). A–C, Example micrographs of the total cell. Scale bars, 2 μm. D–F, Detailed micrographs of the membrane area. Arrowheads indicate the morphologically docked vesicles. Scale bars, 500 nm. G, Cumulative distribution profile of the LDCVs as a percentage of the total number of LDCVs. H, Distribution profile of LDCVs per 100 nm bin distance to the cell membrane. I–K, In the cell cross sections, several parameters were quantified: the cell membrane length (I), the number of docked LDCVs (J), and total number of LDCVs (K). The data were calculated from n = 47 cells, N = 7 animals (EGFP control); n = 38, N = 8 (DOC2Bwt); and n = 28, N = 7 (DOC2BD218,220N). All error bars represent SEM.
Figure 6.

DOC2B overexpression does not change the amount or mobility of vesicles in the submembrane region of chromaffin cells. A–C, Comparison of NPY-Venus-containing vesicle density and mobility by TIRFM in DOC2Bwt (white; 189 vesicles from 25 cells), DOC2BD218,220N (gray; 158 vesicles from 23 cells), and EGFP control (black; 137 vesicles from 20 cells). A, Vesicle density per μm2 surface area of chromaffin cell footprint. B, C, Individual vesicles were analyzed for mobility. B, Mobility of vesicles in the x–y directions, measured as the MSD relative to the start of the experiment. C, Caging diameter, defined as the maximal distance between two points in the x–y directions in 6 s. Open triangles indicate vesicles from fixed cells as a control in mobility analysis (158 vesicles from 19 cells). Data represent means ± SEM.
DOC2B affects fusion-pore opening
We deduced from the above-described experiments that DOC2B is involved in priming, but we wanted to reveal its mechanism of activity. The molecular mechanism of priming, defined as the conversion of unprimed vesicles to a fusion-competent state, has not been fully elucidated. Priming factors may interact with the secretion-apparatus proteins; e.g., the essential priming factor Munc13 interacts with syntaxin, a member of the SNARE complex (Richmond et al., 2001; Stevens et al., 2005; McEwen et al., 2006). Alternatively, priming factors may interact directly with the plasma or vesicle membrane, or alter membrane lipid composition (Vitale et al., 2001; Martens et al., 2007; Zeniou-Meyer et al., 2007). Proteins involved in priming have been shown to change vesicle mobility (Nofal et al., 2007; Yizhar and Ashery, 2008), whereas changes in membrane curvature or composition are not expected to have this effect; however, the latter changes might affect the fusion kinetics of single vesicles (Wang et al., 2001; Bai et al., 2004; Barclay et al., 2004; Han et al., 2004; Jaiswal et al., 2004; Cohen et al., 2007). To distinguish between these scenarios, we looked at whether DOC2B affects the mobility of vesicles and the kinetics of single fusion events.
First, we examined the effect of DOC2B on vesicle mobility by TIRFM (Fig. 6B,C). Vesicle location was determined by 2D Gaussian fits in each frame of the time-lapse movie (Toonen et al., 2006), and movement in the x–y position was quantified by calculation of either the mean square displacement (MSD) or the caging diameter (Nofal et al., 2007). Our analysis demonstrated similar vesicle movement in control and DOC2Bwt- and DOC2BD218,220N-expressing cells (Fig. 6B,C, respectively). The absolute velocity in the x and y directions was also similar between groups (data not shown). The finding that DOC2B does not affect vesicle mobility supports the hypothesis that at least part of its priming effect is membrane related.
Considering that DOC2B enhances fusion competence, interacts with phospholipids, and does not alter vesicle mobility, we hypothesized that it might exert its effect at the PM. Therefore, we checked for an effect of DOC2B on fusion-pore kinetics using single amperometric spike analysis (Schroeder et al., 1996; Elhamdani et al., 2001; Graham et al., 2002; Machado et al., 2002; Kesavan et al., 2007). Cells were depolarized by short (10 s) applications of high-potassium solution, and CA secretion was measured by carbon-fiber amperometry. Although the average amplitudes of the spikes did not change among the three groups (data not shown), the charge transfer per spike (Fig. 7B) was significantly increased in both DOC2Bwt and DOC2BD218,220N compared with control cells. The spike duration and half-width (Fig. 7D,E, respectively) as well as the rise time (Fig. 7C) were significantly longer in cells expressing either of the DOC2B variants. Consistent with our electrophysiological findings, the total number of spikes was also higher in DOC2Bwt cells (Fig. 7F) than in control and DOC2BD218,220N-expressing cells. These results suggest that DOC2B affects the fusion kinetics of single vesicles. In addition, DOC2BD218,220N exhibited a 1.5-fold increase in foot events (Fig. 7G) compared with control- and DOC2Bwt-expressing cells, but the charge and amplitude of the foot were unchanged. The changes in the spike parameters suggest that DOC2B enables a longer dilation time, leading to slower expansion of the fusion pore, which in turn causes more efficient dispersion of CA.
Figure 7.

DOC2BD218,220N and DOC2Bwt change the kinetics parameters of single-vesicle fusion. A, Representative unfiltered spike with its analysis parameters. Inset, Expansion of the first 20 ms of the spike illustrating the exponential fit of the foot and the linear fit of the rising phase. B–G, Comparison of single-spike parameters of DOC2Bwt (white; n = 16), DOC2BD218,220N (gray; n = 24), and EGFP control (black; n = 18) cells. Error bars represent mean ± SEM. *p < 0.01; ×p < 0.05. B, The charge of both DOC2B isoforms is increased compared with controls (p < 0.01). C, The rise time of the spike (the time of the linear phase) is longer in both DOC2Bwt- and DOC2BD218,220N-expressing cells (p < 0.01). D, E, The duration (D) and half-width (E) of the spikes are longer in both DOC2B isoforms, although more significantly in DOC2BD218,220N (p < 0.01) than in DOC2Bwt (p < 0.05). F, DOC2Bwt has more spikes compared with DOC2BD218,220N and EGFP control cells (p < 0.05). G, DOC2BD218,220N has more feet than DOC2Bwt and EGFP control cells (p < 0.05).
The diffusion coefficient of DOC2B resembles that of a lipid
To characterize the mode of association of the full-length DOC2B with the PM in chromaffin cells and to determine whether membrane-associated DOC2B can diffuse on the PM, we performed FRAP beam-size analysis (Henis et al., 2006). This technique characterizes the membrane interactions of proteins located on the inner leaflet of the PM, where FRAP can occur not only by lateral diffusion but also by exchange between membrane-bound and cytoplasmic pools, based on the contribution of exchange relative to lateral diffusion (Henis et al., 2006; Shvartsman et al., 2007) (see Materials and Methods for more details). DOC2BD218,220N fused to EGFP was expressed in chromaffin cells, which were subjected to FRAP beam-size analysis. Representative FRAP curves are shown in Figure 8, A and B. The averaged time constants (τ) of FRAP measured were 0.09 ± 0.008 s for the 63× objective (n = 37) and 0.16 ± 0.009 s for the 40× objective (n = 36). The measured τ(40×)/τ(63×) ratio was 1.73, between the values of 1 (expected for FRAP by exchange) and 2.56 (the ratio between the areas illuminated by the laser beam using the 40× and 63× objectives, expected for recovery by pure lateral diffusion). Thus, FRAP of DOC2BD218,220N occurs via a combination of lateral diffusion and exchange. The significant contribution of exchange precludes the accurate translation of τ to a lateral diffusion coefficient (D), but D can be estimated from τ (63×), because the smaller illumination area with the 63× objective reduces the relative contribution of exchange (Henis et al., 2006). This calculation yields D = 1.9 μm2/s, which resembles D values measured for a lipid probe (Rotblat et al., 2004). Together with the results of the liposome-binding studies (Fig. 1), these findings suggest that the C2A domain of DOC2B interacts with the PM directly with lipids and/or by binding to a protein associated with the membrane via a lipid-like interaction (e.g., a fatty-acylated protein).
Figure 8.
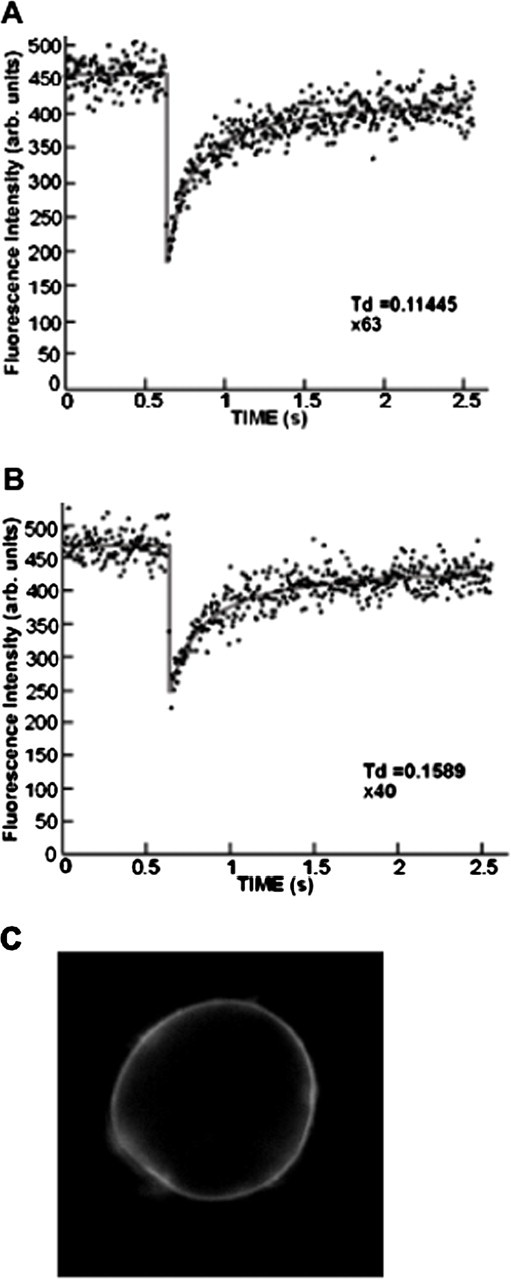
FRAP beam-size analysis of the PM interaction of DOC2BD218,220N-EGFP. FRAP experiments were conducted on chromaffin cells expressing DOC2BD218,220N-EGFP. A, B, Typical FRAP curves measured using the 63× objective (small beam size; A) or the 40× objective (B). Solid lines indicate the best fit of nonlinear regression analysis; the resulting τ and mobile fracture values are shown. The averaged time constants (τ) of FRAP measured were 0.09 ± 0.008 for the 63× objective (n = 37) and 0.16 ± 0.009 for the 40× objective (n = 36), suggesting direct interaction of the C2A domain of DOC2B with lipids or lipid-like proteins on the PM. C, Example of a chromaffin cell expressing DOC2BD218,220N-EGFP.
DOC2B interacts with PM SNAREs
The effects of DOC2B on the fusion kinetics suggested that DOC2B might interact directly with the fusion-machinery proteins, such as syntaxin and SNAP-25, members of the SNARE complex. Therefore, we performed a SNARE-binding experiment with GST-tagged C2B domain, which carries a polylysine patch similar to that of synaptotagmin (Rickman et al., 2004). Figure 9 shows that the C2B of DOC2B can indeed bind the PM SNAREs, but only in the context of the binary syntaxin-SNAP-25 complex and not as individual proteins (Fig. 9A,B). Thus, DOC2B, after binding lipids through its C2A activity, may diffuse laterally on the PM to interact with the PM SNAREs at release sites (Lang et al., 2001), thereby modifying the fusion kinetics (Wang et al., 2001; Bai et al., 2004; Barclay et al., 2004; Han et al., 2004; Cohen et al., 2007).
Figure 9.
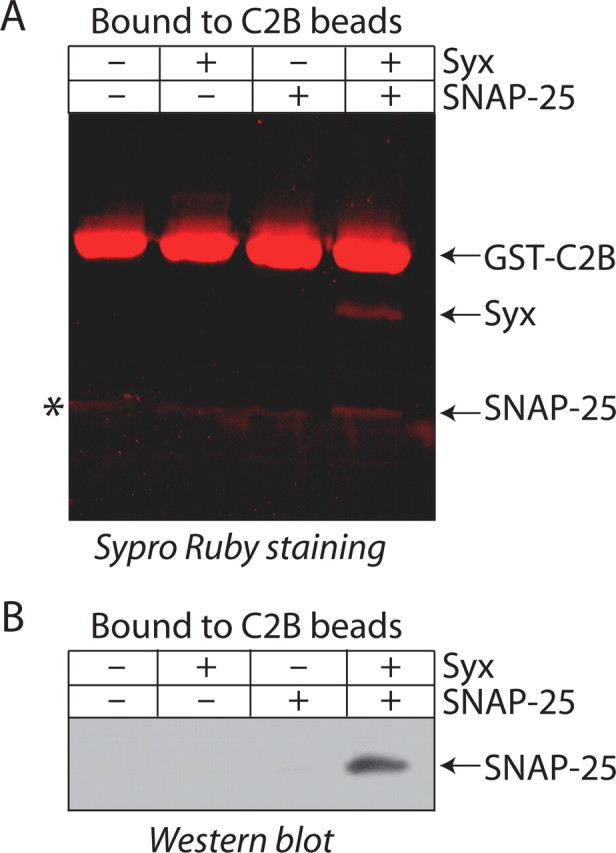
The C2B domain of DOC2B interacts with the syntaxin/SNAP-25 dimer. GST-C2B, attached to glutathione beads, binds syntaxin/SNAP-25 heterodimer, but not syntaxin or SNAP-25 alone. A, Visualization using Sypro Ruby protein stain. The asterisk denotes a GST breakdown product associated with the GST-C2B beads. B, Western immunoblotting with an anti-SNAP-25 antibody confirms that SNAP-25 binds DOC2B only in tandem with syntaxin.
Discussion
Vesicle priming is enhanced in chromaffin cells in a calcium-dependent manner (Bittner and Holz, 1992; Burgoyne and Morgan, 1997; Smith et al., 1998; Voets, 2000; Rettig and Neher, 2002; Sørensen et al., 2003). Calcium-dependent translocation of cytosolic DOC2B to the PM has been reported previously (Groffen et al., 2006; Malkinson and Spira, 2006), but the physiological relevance of this process is unclear. Here we demonstrate that the calcium-dependent translocation acts as a functional switch that increases the number of fusion-competent vesicles and supports secretion during repeated stimulation. This is supported by the finding that DOC2B's enhancing effect is boosted during repeated stimulations or after a subtle elevation of calcium to 300 nm (which causes DOC2B's translocation to the PM). Furthermore, we suggest that DOC2B's effects on secretion is also time dependent, because in the reduced priming experiments, we did not measure enhanced secretion during the 5 s stimulation, yet after 30 s of priming, DOC2B's effect on secretion was prominent. Thus, DOC2B's activity time-frame is similar to the time needed for priming in chromaffin cells, supporting our hypothesis that DOC2B is involved in vesicle priming and suggesting that its activity is both calcium and time dependent. The finding that DOC2BD218,220N cannot support enhanced secretion both in the repeated stimulation experiment and in the second flash can be interpreted in two possible ways; the first one suggests that the translocation is vital for DOC2B's physiological role and that it enables it to increase the number of fusion-competent vesicles. Hence, DOC2BD218,220N, which is constantly at the PM, cannot increase the number of fusion-competent vesicles during repeated stimulation because of its impaired translocation ability. The second interpretation suggests that the impaired calcium affinity of the mutant interferes with its action, making it less efficient. Thus, the mutated protein can enhance the exocytotic response only in a long time scale (after long association with the PM), but fails to do so on a short time basis, such as multiple-stimuli protocol, in which new vesicles are recruited on short times. Therefore, we suggest that DOC2B acts at the PM, but if it is mutated and cannot cycle on and off the PM, its effect is modified.
The observation that the number of morphologically docked vesicles does not change (by TIRFM and EM) also suggests that DOC2B functions downstream of vesicle docking. The priming factor Munc13 has been found to interact with DOC2 (Orita et al., 1997; Verhage et al., 1997; Duncan et al., 1999), and this interaction has been implicated in synaptic potentiation (Mochida et al., 1998; Hori et al., 1999). Therefore, it is possible that the interaction with Munc13 is relevant to DOC2B's enhancement ability. In addition, we demonstrate that DOC2B binds to the SNAREs themselves and alters the kinetics of fusion of single vesicles, making the release of CA more efficient.
Based on our single-spike analysis, the liposome-binding assay, the FRAP studies, and the novel interaction of DOC2B with SNAP-25 and syntaxin, we deduced that DOC2B has a secretion-facilitating effect on the PM. Detailed analysis of the amperometric spikes suggested that the rising phase of the spike represents a separate kinetic step that is temporally located between the initial formation of the fusion pore (the foot) and the full collapse of the vesicle (Schroeder et al., 1996; Travis and Wightman, 1998; Burgoyne and Barclay, 2002; Bruns, 2004; Fulop et al., 2005; Mosharov and Sulzer, 2005; Fulop and Smith, 2006). This rising phase may represent the time taken for the fusion pore to expand from its initial small dimensions [0.5–2 nm (Albillos et al., 1997)] to a larger pore structure [7 nm (Fulop and Smith, 2006)], a process that does not necessitate full collapse, but allows maximal release of CA (Schroeder et al., 1996; Holroyd et al., 2002). Therefore, changes in the kinetics of fusion-pore dilation are expected to change the amount and kinetics of CA release, as demonstrated recently (Burgoyne and Barclay, 2002; Neco et al., 2008). Based on the above models, we suggest that DOC2B regulates the kinetics of the fusion pore's expansion and that this causes a slower but more efficient release of CA, which is reflected in the spike's longer rise time, larger half-width, and larger charge. These effects make CA release from the vesicle more efficient.
The effect of DOC2B on single fusion events may be mediated through its interaction with the PM–SNARE complex. Recent work by Graham et al. (2004) has demonstrated that overexpression of a mutated form of syntaxin 1A, which cannot bind Munc18, results in increased quantal size and a slowing of the kinetics of release. Munc18 is also known to interact with DOC2B (Verhage et al., 1997; Ke et al., 2007), suggesting that a fine balance is needed between the three possible complexes (DOC2B-Munc18, Munc18-syntaxin 1, and syntaxin 1-SNAP-25-DOC2B) to facilitate exocytosis. However, further experiments are needed to clarify this point.
The interaction of DOC2B with the PM–SNARE complex might explain its effect on the fusion-pore kinetics, but we cannot rule out the possibility that DOC2B directly affects the PM lipid properties. Recently, the tandem C2 domains of synaptotagmin I have been shown to induce perturbation of the bilayer structure (Shahin et al., 2008), to induce tubulation of Folch liposomes, and to enhance liposome fusion (Martens et al., 2007). These functions were attributed to its ability to create membrane curvature and to lower the energy barrier for fusion. The C2A–C2B of DOC2B present high homology with the C2 domains of synaptotagmin I (Sutton et al., 1999), and it is therefore possible that DOC2B exerts the same curvature effect on membranes. In this scenario, the PM–SNARE interaction might guide DOC2B to fusion sites on the PM. Syntaxin 1 has been found to form clusters on the PM, which represent fusion sites (Lang et al., 2001; Lopez et al., 2007); thus, after elevation in [Ca2+]i, PM-associated DOC2B may preferably concentrate at areas that are enriched in PM-SNARE, and this might facilitate the formation of trans-SNARE complexes (Ke et al., 2007) and vesicle priming. This notion is further supported by the finding that DOC2B translocates to the PM in a nonhomogeneous manner (Groffen et al., 2004) (our unpublished results).
DOC2B was shown to enhance secretion also from β cells and adipocytes (Ke et al., 2007), supporting our suggestion that DOC2B is a positive regulator of exocytosis. It was suggested that DOC2B increases the formation of syntaxin 4-VAMP complexes, which was interpreted as an increase in granule docking (Ke et al., 2007). In our study, using a combination of high-resolution capacitance measurements, EM and TIRF, we clearly demonstrated that in chromaffin cells DOC2B effect is downstream to docking, i.e., enhancing priming. Furthermore, the kinetic analysis demonstrated that DOC2B selectively increases the sizes of the releasable vesicle pools.
DOC2B, the only DOC2 isoform that is detectable in chromaffin cells, is characterized by high calcium sensitivity. In the present study, we demonstrate that DOC2B acts as a calcium switch. Under resting conditions, DOC2B is found in the cytoplasm. During stimulation, DOC2B translocates to the PM, where it facilitates priming and enhances the fusion competence of vesicles. DOC2B's activity at the PM, possibly via its interactions with the SNARE proteins, is unique, allowing a more efficient expansion of the fusion pore that in turn leads to increased CA release. Overall, the results from this study implicate DOC2B in the regulation of late stages of exocytosis and offer a novel explanation for activity-induced enhancement of exocytosis.
Footnotes
This work was supported by grants from the Israel Science Foundation (1211/07 to U.A.) and the European Commission (EUSynapse project, contract number 019055 to A.J.G.). We thank Irit Gottfried and Ofer Yizhar for fruitful discussions and comments on this manuscript. Y.I.H. is an incumbent of the Zalman Weinberg chair in Cell Biology.
References
- Albillos A, Dernick G, Horstmann H, Almers W, Alvarez de Toledo G, Lindau M. The exocytotic event in chromaffin cells revealed by patch amperometry. Nature. 1997;389:509–512. doi: 10.1038/39081. [DOI] [PubMed] [Google Scholar]
- Ashery U, Betz A, Xu T, Brose N, Rettig J. An efficient method for infection of adrenal chromaffin cells using the Semliki Forest virus gene expression system. Eur J Cell Biol. 1999;78:525–532. doi: 10.1016/s0171-9335(99)80017-x. [DOI] [PubMed] [Google Scholar]
- Ashery U, Varoqueaux F, Voets T, Betz A, Thakur P, Koch H, Neher E, Brose N, Rettig J. Munc13–1 acts as a priming factor for large dense-core vesicles in bovine chromaffin cells. EMBO J. 2000;19:3586–3596. doi: 10.1093/emboj/19.14.3586. [DOI] [PMC free article] [PubMed] [Google Scholar]
- Augustine GJ, Burns ME, DeBello WM, Hilfiker S, Morgan JR, Schweizer FE, Tokumaru H, Umayahara K. Proteins involved in synaptic vesicle trafficking. J Physiol. 1999;520:33–41. doi: 10.1111/j.1469-7793.1999.00033.x. [DOI] [PMC free article] [PubMed] [Google Scholar]
- Bai J, Wang CT, Richards DA, Jackson MB, Chapman ER. Fusion pore dynamics are regulated by synaptotagmin*t-SNARE interactions. Neuron. 2004;41:929–942. doi: 10.1016/s0896-6273(04)00117-5. [DOI] [PubMed] [Google Scholar]
- Barclay JW, Aldea M, Craig TJ, Morgan A, Burgoyne RD. Regulation of the fusion pore conductance during exocytosis by cyclin-dependent kinase 5. J Biol Chem. 2004;279:41495–41503. doi: 10.1074/jbc.M406670200. [DOI] [PubMed] [Google Scholar]
- Becherer U, Rettig J. Vesicle pools, docking, priming, and release. Cell Tissue Res. 2006;326:393–407. doi: 10.1007/s00441-006-0243-z. [DOI] [PubMed] [Google Scholar]
- Bittner MA, Holz RW. Kinetic analysis of secretion from permeabilized adrenal chromaffin cells reveals distinct components. J Biol Chem. 1992;267:16219–16225. [PubMed] [Google Scholar]
- Bruns D. Detection of transmitter release with carbon fiber electrodes. Methods. 2004;33:312–321. doi: 10.1016/j.ymeth.2004.01.004. [DOI] [PubMed] [Google Scholar]
- Burgoyne RD, Barclay JW. Splitting the quantum: regulation of quantal release during vesicle fusion. Trends Neurosci. 2002;25:176–178. doi: 10.1016/s0166-2236(00)02126-3. [DOI] [PubMed] [Google Scholar]
- Burgoyne RD, Morgan A. Ca2+ and secretory-vesicle dynamics. Trends Neurosci. 1995;18:191–196. doi: 10.1016/0166-2236(95)93900-i. [DOI] [PubMed] [Google Scholar]
- Burgoyne RD, Morgan A. Common mechanisms for regulated exocytosis in the chromaffin cell and the synapse. Semin Cell Dev Biol. 1997;8:141–149. doi: 10.1006/scdb.1996.0133. [DOI] [PubMed] [Google Scholar]
- Cohen R, Marom M, Atlas D. Depolarization-evoked secretion requires two vicinal transmembrane cysteines of syntaxin 1A. PLoS ONE. 2007;2:e1273. doi: 10.1371/journal.pone.0001273. [DOI] [PMC free article] [PubMed] [Google Scholar]
- Connell E, Scott P, Davletov B. Real-time assay for monitoring membrane association of lipid-binding domains. Anal Biochem. 2008;377:83–88. doi: 10.1016/j.ab.2008.02.016. [DOI] [PMC free article] [PubMed] [Google Scholar]
- Duncan RR, Betz A, Shipston MJ, Brose N, Chow RH. Transient, phorbol ester-induced DOC2-Munc13 interactions in vivo. J Biol Chem. 1999;274:27347–27350. doi: 10.1074/jbc.274.39.27347. [DOI] [PubMed] [Google Scholar]
- Elhamdani A, Palfrey HC, Artalejo CR. Quantal size is dependent on stimulation frequency and calcium entry in calf chromaffin cells. Neuron. 2001;31:819–830. doi: 10.1016/s0896-6273(01)00418-4. [DOI] [PubMed] [Google Scholar]
- Fulop T, Smith C. Physiological stimulation regulates the exocytic mode through calcium activation of protein kinase C in mouse chromaffin cells. Biochem J. 2006;399:111–119. doi: 10.1042/BJ20060654. [DOI] [PMC free article] [PubMed] [Google Scholar]
- Fulop T, Radabaugh S, Smith C. Activity-dependent differential transmitter release in mouse adrenal chromaffin cells. J Neurosci. 2005;25:7324–7332. doi: 10.1523/JNEUROSCI.2042-05.2005. [DOI] [PMC free article] [PubMed] [Google Scholar]
- Graham ME, O'Callaghan DW, McMahon HT, Burgoyne RD. Dynamin-dependent and dynamin-independent processes contribute to the regulation of single vesicle release kinetics and quantal size. Proc Natl Acad Sci U S A. 2002;99:7124–7129. doi: 10.1073/pnas.102645099. [DOI] [PMC free article] [PubMed] [Google Scholar]
- Graham ME, Barclay JW, Burgoyne RD. Syntaxin/Munc18 interactions in the late events during vesicle fusion and release in exocytosis. J Biol Chem. 2004;279:32751–32760. doi: 10.1074/jbc.M400827200. [DOI] [PubMed] [Google Scholar]
- Groffen AJ, Brian EC, Dudok JJ, Kampmeijer J, Toonen RF, Verhage M. Ca(2+)-induced recruitment of the secretory vesicle protein DOC2B to the target membrane. J Biol Chem. 2004;279:23740–23747. doi: 10.1074/jbc.M400731200. [DOI] [PubMed] [Google Scholar]
- Groffen AJ, Jacobsen L, Schut D, Verhage M. Two distinct genes drive expression of seven tomosyn isoforms in the mammalian brain, sharing a conserved structure with a unique variable domain. J Neurochem. 2005;92:554–568. doi: 10.1111/j.1471-4159.2004.02890.x. [DOI] [PubMed] [Google Scholar]
- Groffen AJ, Friedrich R, Brian EC, Ashery U, Verhage M. DOC2A and DOC2B are sensors for neuronal activity with unique calcium-dependent and kinetic properties. J Neurochem. 2006;97:818–833. doi: 10.1111/j.1471-4159.2006.03755.x. [DOI] [PubMed] [Google Scholar]
- Han X, Wang CT, Bai J, Chapman ER, Jackson MB. Transmembrane segments of syntaxin line the fusion pore of Ca2+-triggered exocytosis. Science. 2004;304:289–292. doi: 10.1126/science.1095801. [DOI] [PubMed] [Google Scholar]
- Henis YI, Rotblat B, Kloog Y. FRAP beam-size analysis to measure palmitoylation-dependent membrane association dynamics and microdomain partitioning of Ras proteins. Methods. 2006;40:183–190. doi: 10.1016/j.ymeth.2006.02.003. [DOI] [PubMed] [Google Scholar]
- Holroyd P, Lang T, Wenzel D, De Camilli P, Jahn R. Imaging direct, dynamin-dependent recapture of fusing secretory granules on plasma membrane lawns from PC12 cells. Proc Natl Acad Sci U S A. 2002;99:16806–16811. doi: 10.1073/pnas.222677399. [DOI] [PMC free article] [PubMed] [Google Scholar]
- Hori T, Takai Y, Takahashi T. Presynaptic mechanism for phorbol ester-induced synaptic potentiation. J Neurosci. 1999;19:7262–7267. doi: 10.1523/JNEUROSCI.19-17-07262.1999. [DOI] [PMC free article] [PubMed] [Google Scholar]
- Jahn R, Scheller RH. SNAREs-engines for membrane fusion. Nat Rev Mol Cell Biol. 2006;7:631–643. doi: 10.1038/nrm2002. [DOI] [PubMed] [Google Scholar]
- Jaiswal JK, Chakrabarti S, Andrews NW, Simon SM. Synaptotagmin VII restricts fusion pore expansion during lysosomal exocytosis. PLoS Biol. 2004;2:E233. doi: 10.1371/journal.pbio.0020233. [DOI] [PMC free article] [PubMed] [Google Scholar]
- Katz B, Miledi R. The role of calcium in neuromuscular facilitation. J Physiol. 1968;195:481–492. doi: 10.1113/jphysiol.1968.sp008469. [DOI] [PMC free article] [PubMed] [Google Scholar]
- Ke B, Oh E, Thurmond DC. Doc2beta is a novel Munc18c-interacting partner and positive effector of syntaxin 4-mediated exocytosis. J Biol Chem. 2007;282:21786–21797. doi: 10.1074/jbc.M701661200. [DOI] [PubMed] [Google Scholar]
- Kesavan J, Borisovska M, Bruns D. v-SNARE actions during Ca(2+)-triggered exocytosis. Cell. 2007;131:351–363. doi: 10.1016/j.cell.2007.09.025. [DOI] [PubMed] [Google Scholar]
- Lang T, Bruns D, Wenzel D, Riedel D, Holroyd P, Thiele C, Jahn R. SNAREs are concentrated in cholesterol-dependent clusters that define docking and fusion sites for exocytosis. EMBO J. 2001;20:2202–2213. doi: 10.1093/emboj/20.9.2202. [DOI] [PMC free article] [PubMed] [Google Scholar]
- Lopez I, Giner D, Ruiz-Nuño A, Fuentealba J, Viniegra S, Garcia AG, Davletov B, Gutiérrez LM. Tight coupling of the t-SNARE and calcium channel microdomains in adrenomedullary slices and not in cultured chromaffin cells. Cell Calcium. 2007;41:547–558. doi: 10.1016/j.ceca.2006.10.004. [DOI] [PubMed] [Google Scholar]
- Maasch C, Wagner S, Lindschau C, Alexander G, Buchner K, Gollasch M, Luft FC, Haller H. Protein kinase Cα targeting is regulated by temporal and spatial changes in intracellular free calcium concentration [Ca2+]i. FASEB J. 2000;14:1653–1663. doi: 10.1096/fj.14.11.1653. [DOI] [PubMed] [Google Scholar]
- Machado JD, Alonso C, Morales A, Gómez JF, Borges R. Nongenomic regulation of the kinetics of exocytosis by estrogens. J Pharmacol Exp Ther. 2002;301:631–637. doi: 10.1124/jpet.301.2.631. [DOI] [PubMed] [Google Scholar]
- Malkinson G, Spira ME. Calcium concentration threshold and translocation kinetics of EGFP-DOC2B expressed in cultured Aplysia neurons. Cell Calcium. 2006;39:85–93. doi: 10.1016/j.ceca.2005.10.007. [DOI] [PubMed] [Google Scholar]
- Martens S, Kozlov MM, McMahon HT. How synaptotagmin promotes membrane fusion. Science. 2007;316:1205–1208. doi: 10.1126/science.1142614. [DOI] [PubMed] [Google Scholar]
- McEwen JM, Madison JM, Dybbs M, Kaplan JM. Antagonistic regulation of synaptic vesicle priming by tomosyn and UNC-13. Neuron. 2006;51:303–315. doi: 10.1016/j.neuron.2006.06.025. [DOI] [PubMed] [Google Scholar]
- Mochida S, Orita S, Sakaguchi G, Sasaki T, Takai Y. Role of the Doc2 alpha-Munc13–1 interaction in the neurotransmitter release process. Proc Natl Acad Sci U S A. 1998;95:11418–11422. doi: 10.1073/pnas.95.19.11418. [DOI] [PMC free article] [PubMed] [Google Scholar]
- Mosharov EV, Sulzer D. Analysis of exocytotic events recorded by amperometry. Nat Methods. 2005;2:651–658. doi: 10.1038/nmeth782. [DOI] [PubMed] [Google Scholar]
- Nagy G, Matti U, Nehring RB, Binz T, Rettig J, Neher E, Sørensen JB. Protein kinase C-dependent phosphorylation of synaptosome-associated protein of 25 kDa at Ser187 potentiates vesicle recruitment. J Neurosci. 2002;22:9278–9286. doi: 10.1523/JNEUROSCI.22-21-09278.2002. [DOI] [PMC free article] [PubMed] [Google Scholar]
- Neco P, Fernández-Peruchena C, Navas S, Gutiérrez LM, de Toledo GA, Alés E. Myosin II contributes to fusion pore expansion during exocytosis. J Biol Chem. 2008;283:10949–10957. doi: 10.1074/jbc.M709058200. [DOI] [PubMed] [Google Scholar]
- Neher E. A comparison between exocytic control mechanisms in adrenal chromaffin cells and a glutamatergic synapse. Pflugers Arch. 2006;453:261–268. doi: 10.1007/s00424-006-0143-9. [DOI] [PubMed] [Google Scholar]
- Nili U, de Wit H, Gulyas-Kovacs A, Toonen RF, Sørensen JB, Verhage M, Ashery U. Munc18–1 phosphorylation by protein kinase C potentiates vesicle pool replenishment in bovine chromaffin cells. Neuroscience. 2006;143:487–500. doi: 10.1016/j.neuroscience.2006.08.014. [DOI] [PubMed] [Google Scholar]
- Nofal S, Becherer U, Hof D, Matti U, Rettig J. Primed vesicles can be distinguished from docked vesicles by analyzing their mobility. J Neurosci. 2007;27:1386–1395. doi: 10.1523/JNEUROSCI.4714-06.2007. [DOI] [PMC free article] [PubMed] [Google Scholar]
- Oancea E, Meyer T. Protein kinase C as a molecular machine for decoding calcium and diacylglycerol signals. Cell. 1998;95:307–318. doi: 10.1016/s0092-8674(00)81763-8. [DOI] [PubMed] [Google Scholar]
- Orita S, Sasaki T, Naito A, Komuro R, Ohtsuka T, Maeda M, Suzuki H, Igarashi H, Takai Y. Doc2: a novel brain protein having two repeated C2-like domains. Biochem Biophys Res Commun. 1995;206:439–448. doi: 10.1006/bbrc.1995.1062. [DOI] [PubMed] [Google Scholar]
- Orita S, Sasaki T, Komuro R, Sakaguchi G, Maeda M, Igarashi H, Takai Y. Doc2 enhances Ca2+-dependent exocytosis from PC12 cells. J Biol Chem. 1996;271:7257–7260. doi: 10.1074/jbc.271.13.7257. [DOI] [PubMed] [Google Scholar]
- Orita S, Naito A, Sakaguchi G, Maeda M, Igarashi H, Sasaki T, Takai Y. Physical and functional interactions of Doc2 and Munc13 in Ca2+-dependent exocytotic machinery. J Biol Chem. 1997;272:16081–16084. doi: 10.1074/jbc.272.26.16081. [DOI] [PubMed] [Google Scholar]
- Petersen NO, Felder S, Elson EL. Measurement of lateral diffusion by fluorescence photobleaching recovery. In: Weir DM, Herzenberg LA, Blackwell CC, Herzenberg LA, editors. Handbook of experimental immunology. Edinburgh: Blackwell Scientific Publications; 1986. pp. 24.21–24.23. [Google Scholar]
- Rettig J, Neher E. Emerging roles of presynaptic proteins in Ca++-triggered exocytosis. Science. 2002;298:781–785. doi: 10.1126/science.1075375. [DOI] [PubMed] [Google Scholar]
- Richmond JE, Broadie KS. The synaptic vesicle cycle: exocytosis and endocytosis in Drosophila and C. elegans. Curr Opin Neurobiol. 2002;12:499–507. doi: 10.1016/s0959-4388(02)00360-4. [DOI] [PubMed] [Google Scholar]
- Richmond JE, Weimer RM, Jorgensen EM. An open form of syntaxin bypasses the requirement for UNC-13 in vesicle priming. Nature. 2001;412:338–341. doi: 10.1038/35085583. [DOI] [PMC free article] [PubMed] [Google Scholar]
- Rickman C, Meunier FA, Binz T, Davletov B. High affinity interaction of syntaxin and SNAP-25 on the plasma membrane is abolished by botulinum toxin E. J Biol Chem. 2004;279:644–651. doi: 10.1074/jbc.M310879200. [DOI] [PubMed] [Google Scholar]
- Robinson LJ, Martin TF. Docking and fusion in neurosecretion. Curr Opin Cell Biol. 1998;10:483–492. doi: 10.1016/s0955-0674(98)80063-x. [DOI] [PubMed] [Google Scholar]
- Rotblat B, Prior IA, Muncke C, Parton RG, Kloog Y, Henis YI, Hancock JF. Three separable domains regulate GTP-dependent association of H-ras with the plasma membrane. Mol Cell Biol. 2004;24:6799–6810. doi: 10.1128/MCB.24.15.6799-6810.2004. [DOI] [PMC free article] [PubMed] [Google Scholar]
- Sakaguchi G, Manabe T, Kobayashi K, Orita S, Sasaki T, Naito A, Maeda M, Igarashi H, Katsuura G, Nishioka H, Mizoguchi A, Itohara S, Takahashi T, Takai Y. Doc2alpha is an activity-dependent modulator of excitatory synaptic transmission. Eur J Neurosci. 1999;11:4262–4268. doi: 10.1046/j.1460-9568.1999.00855.x. [DOI] [PubMed] [Google Scholar]
- Schneggenburger R, Neher E. Intracellular calcium dependence of transmitter release rates at a fast central synapse. Nature. 2000;406:889–893. doi: 10.1038/35022702. [DOI] [PubMed] [Google Scholar]
- Schroeder TJ, Borges R, Finnegan JM, Pihel K, Amatore C, Wightman RM. Temporally resolved, independent stages of individual exocytotic secretion events. Biophys J. 1996;70:1061–1068. doi: 10.1016/S0006-3495(96)79652-2. [DOI] [PMC free article] [PubMed] [Google Scholar]
- Shahin V, Datta D, Hui E, Henderson RM, Chapman ER, Edwardson JM. Synaptotagmin perturbs the structure of phospholipid bilayers. Biochemistry. 2008;47:2143–2152. doi: 10.1021/bi701879g. [DOI] [PMC free article] [PubMed] [Google Scholar]
- Shvartsman DE, Donaldson JC, Diaz B, Gutman O, Martin GS, Henis YI. Src kinase activity and SH2 domain regulate the dynamics of Src association with lipid and protein targets. J Cell Biol. 2007;178:675–686. doi: 10.1083/jcb.200701133. [DOI] [PMC free article] [PubMed] [Google Scholar]
- Smith C, Moser T, Xu T, Neher E. Cytosolic Ca2+ acts by two separate pathways to modulate the supply of release-competent vesicles in chromaffin cells. Neuron. 1998;20:1243–1253. doi: 10.1016/s0896-6273(00)80504-8. [DOI] [PubMed] [Google Scholar]
- Sørensen JB. Formation, stabilisation and fusion of the readily releasable pool of secretory vesicles. Pflugers Arch. 2004;448:347–362. doi: 10.1007/s00424-004-1247-8. [DOI] [PubMed] [Google Scholar]
- Sørensen JB, Fernández-Chacón R, Südhof TC, Neher E. Examining synaptotagmin 1 function in dense core vesicle exocytosis under direct control of Ca2+ J Gen Physiol. 2003;122:265–276. doi: 10.1085/jgp.200308855. [DOI] [PMC free article] [PubMed] [Google Scholar]
- Stevens DR, Wu ZX, Matti U, Junge HJ, Schirra C, Becherer U, Wojcik SM, Brose N, Rettig J. Identification of the minimal protein domain required for priming activity of Munc13–1. Curr Biol. 2005;15:2243–2248. doi: 10.1016/j.cub.2005.10.055. [DOI] [PubMed] [Google Scholar]
- Sudhof TC. The synaptic vesicle cycle. Annu Rev Neurosci. 2004;27:509–547. doi: 10.1146/annurev.neuro.26.041002.131412. [DOI] [PubMed] [Google Scholar]
- Sutton RB, Ernst JA, Brunger AT. Crystal structure of the cytosolic C2A-C2B domains of synaptotagmin III. Implications for Ca(+2)-independent snare complex interaction. J Cell Biol. 1999;147:589–598. doi: 10.1083/jcb.147.3.589. [DOI] [PMC free article] [PubMed] [Google Scholar]
- Toonen RF, Kochubey O, de Wit H, Gulyas-Kovacs A, Konijnenburg B, Sørensen JB, Klingauf J, Verhage M. Dissecting docking and tethering of secretory vesicles at the target membrane. EMBO J. 2006;25:3725–3737. doi: 10.1038/sj.emboj.7601256. [DOI] [PMC free article] [PubMed] [Google Scholar]
- Travis ER, Wightman RM. Spatio-temporal resolution of exocytosis from individual cells. Annu Rev Biophys Biomol Struct. 1998;27:77–103. doi: 10.1146/annurev.biophys.27.1.77. [DOI] [PubMed] [Google Scholar]
- Ubach J, Zhang X, Shao X, Südhof TC, Rizo J. Ca2+ binding to synaptotagmin: how many Ca2+ ions bind to the tip of a C2-domain? EMBO J. 1998;17:3921–3930. doi: 10.1093/emboj/17.14.3921. [DOI] [PMC free article] [PubMed] [Google Scholar]
- Verhage M, de Vries KJ, Røshol H, Burbach JP, Gispen WH, Südhof TC. DOC2 proteins in rat brain: complementary distribution and proposed function as vesicular adapter proteins in early stages of secretion. Neuron. 1997;18:453–461. doi: 10.1016/s0896-6273(00)81245-3. [DOI] [PubMed] [Google Scholar]
- Vitale N, Caumont AS, Chasserot-Golaz S, Du G, Wu S, Sciorra VA, Morris AJ, Frohman MA, Bader MF. Phospholipase D1: a key factor for the exocytotic machinery in neuroendocrine cells. EMBO J. 2001;20:2424–2434. doi: 10.1093/emboj/20.10.2424. [DOI] [PMC free article] [PubMed] [Google Scholar]
- Voets T. Dissection of three Ca2+-dependent steps leading to secretion in chromaffin cells from mouse adrenal slices. Neuron. 2000;28:537–545. doi: 10.1016/s0896-6273(00)00131-8. [DOI] [PubMed] [Google Scholar]
- von Rüden L, Neher E. A Ca-dependent early step in the release of catecholamines from adrenal chromaffin cells. Science. 1993;262:1061–1065. doi: 10.1126/science.8235626. [DOI] [PubMed] [Google Scholar]
- Wang CT, Grishanin R, Earles CA, Chang PY, Martin TF, Chapman ER, Jackson MB. Synaptotagmin modulation of fusion pore kinetics in regulated exocytosis of dense-core vesicles. Science. 2001;294:1111–1115. doi: 10.1126/science.1064002. [DOI] [PubMed] [Google Scholar]
- Wang LY, Kaczmarek LK. High-frequency firing helps replenish the readily releasable pool of synaptic vesicles. Nature. 1998;394:384–388. doi: 10.1038/28645. [DOI] [PubMed] [Google Scholar]
- Xu T, Binz T, Niemann H, Neher E. Multiple kinetic components of exocytosis distinguished by neurotoxin sensitivity. Nat Neurosci. 1998;1:192–200. doi: 10.1038/642. [DOI] [PubMed] [Google Scholar]
- Xu T, Ashery U, Burgoyne RD, Neher E. Early requirement for alpha-SNAP and NSF in the secretory cascade in chromaffin cells. EMBO J. 1999;18:3293–3304. doi: 10.1093/emboj/18.12.3293. [DOI] [PMC free article] [PubMed] [Google Scholar]
- Yizhar O, Ashery U. Tomosyn controls exocytosis by regulating vesicle immobilization at the plasma membrane. PLoS ONE. 2008 in press. [Google Scholar]
- Yizhar O, Lipstein N, Gladycheva SE, Matti U, Ernst SA, Rettig J, Stuenkel EL, Ashery U. Multiple functional domains are involved in tomosyn regulation of exocytosis. J Neurochem. 2007;103:604–616. doi: 10.1111/j.1471-4159.2007.04791.x. [DOI] [PubMed] [Google Scholar]
- Zeniou-Meyer M, Zabari N, Ashery U, Chasserot-Golaz S, Haeberlé AM, Demais V, Bailly Y, Gottfried I, Nakanishi H, Neiman AM, Du G, Frohman MA, Bader MF, Vitale N. PLD1 production of phosphatidic acid at the plasma membrane promotes exocytosis of large dense-core granule at a late stage. J Biol Chem. 2007;282:21746–21757. doi: 10.1074/jbc.M702968200. [DOI] [PubMed] [Google Scholar]
- Zikich D, Mezer A, Varoqueaux F, Sheinin A, Junge HJ, Nachliel E, Melamed R, Brose N, Gutman M, Ashery U. Vesicle priming and recruitment by ubMunc13-2 are differentially regulated by calcium and calmodulin. J Neurosci. 2008;28:1949–1960. doi: 10.1523/JNEUROSCI.5096-07.2008. [DOI] [PMC free article] [PubMed] [Google Scholar]