Abstract
Traditional analysis of spectroscopic optical coherence tomography (SOCT) signals is limited by an uncertainty relationship between time (depth) and frequency (wavelength). The use of a bilinear time–frequency distribution for analysis, such as those that compose Cohen’s class of functions, may provide a way to avoid this limitation. Here we present the relationship between traditional SOCT analysis and the relevant Cohen class functions: the Wigner and Choi–Williams distributions. While cross terms that arise in these bilinear time–frequency distributions have been viewed as an artifact, here we identify these terms with temporal coherence, which contains significant information about the signal through phase relationships. The utility of time–frequency distributions is illustrated through analysis of calculated signals.
1. INTRODUCTION
Coherence gating is a powerful means of examining light returned from a localized region of a sample of interest. The approach relies on detecting the phase delay of several frequency components in a broadband spectrum to obtain the time of propagation. This approach is the operating principle behind optical coherence tomography (OCT), a depth-resolved biomedical imaging method [1,2]. Recently, coherence gating has also been applied to enable depth-resolved scattering measurements for tissue analysis [3,4]. Among many specialized applications, an interesting development is the use of coherence gating to execute depth-resolved spectral analysis [5]. In this application, the acquired signal is processed to obtain information about the time delay (depth information) as well as the frequency distribution (wavelength information) of the detected signal. When this analysis is applied to coherence gated imaging, it has become known as spectroscopic optical coherence tomography (SOCT) [6,7], while when applied as an analysis method, it has been known as Fourier-domain low-coherence interferometry [8,9].
In previous studies, the preferred method of processing of SOCT signals has been to use a short time Fourier transform (STFT) or Morlet wavelet transform. However, this approach contains an inherent uncertainty relationship that results in a trade-off between time and frequency resolutions. Recently, the use of joint time–frequency distributions (TFDs) was considered for processing SOCT signals [10]. In this study, several TFDs were compared to assess their relative strengths in detecting spectral modulation due to absorption. The conclusion of this study was that different signal representations were more or less well suited to specific signal processing goals. However, this study did not give explicit expressions for processing the simulated and experimental data, which may have prevented further application of this formalism that was newly introduced to OCT. Further, the study exclusively examined time-domain OCT signals without drawing a distinction between their difference in origin from Fourier (or spectral-) domain OCT signals.
In this paper, the general relationship between coherence gated signals and bilinear TFDs is examined. Traditional OCT signals in the time domain and frequency domain are considered using the framework of the TFD. SOCT signals are also examined in this framework, with particular attention paid to the choice of analysis window and the type of TFD that is generated. Finally, the utility of the TFD is shown by processing of numerically simulated data.
2. THEORY
The general form of an interferogram can be written as
| (1) |
where IT is the total detected intensity and ER, ES are the amplitudes of the reference and sample fields, respectively. In general, the sample and reference fields are complex, and the relative phase between the two, φ, can be used to isolate the interferometric signal. Measurements of the total intensity given in Eq. (1) may be executed in either the time or frequency domain. In the time domain, φ is made to vary linearly in time, allowing one to create a heterodyne signal that is linear with the sample field. In the frequency domain, the frequency dependence of φ is measured and Fourier transformed to yield the temporal profile of the sample field.
To obtain information about the interferogram signal in both the time and frequency domains simultaneously, the signal must be processed using one of two main approaches. Linear operations can be applied to the signal to yield a linear TFD or higher-order functions such as the bilinear TFDs that comprise the Cohen class of functions can be calculated. In this section we will lay out the basic formalism of each approach and then examine the relationship between the two.
A. Linear Representation
To generate a TFD from data acquired in a single domain, a linear operation such as the STFT can be applied. Here a window is generated mathematically with a finite width and center and applied to the acquired signal. In the case of a time-domain signal, IT, a temporal window W of width T and center t0 can be applied,
| (2) |
to yield the spectrum of light associated with the signal at time t0. By executing this operation at several values of t0 successively, the TFD of the signal is obtained. The one potential drawback of this approach is that there exists an uncertainty relationship between the resolution in the frequency domain and that in the time domain such that improved knowledge of the frequency k comes with reduced knowledge of the temporal distribution. Alternatively, for data acquired in the frequency domain, a spectral window can be applied to obtain the TFD with a similar trade-off between time and frequency resolutions.
B. Bilinear Representation
In bilinear signal representations, higher-order correlations are analyzed to obtain the joint TFD. As an example, one bilinear representation is the Wigner distribution, which is defined as
| (3) |
for an electrical field E and where 〈…〉 denotes a statistical average and k is the wave vector, which is related to the frequency as k=ω/c. For a multicomponent signal, such as that found in an interferogram, the Wigner distribution of the total electric field, ET = ER + ES, can be written as
| (4) |
where WR and WS denote the individual Wigner distributions for the reference and sample fields, respectively, and WCross gives the Wigner function for the cross terms. Although the cross terms are often regarded as undesired artifacts, they contain useful information about the temporal coherence of the sample field, which is useful for coherence gated measurements, as we shall explore below.
C. Relationship Between Linear and Bilinear Representations
To illustrate the connection between linear and bilinear signal representations, let us consider a frequency-domain OCT signal:
| (5) |
Upon elimination of the sample and reference intensities, we are left with the interferometric term:
| (6) |
As mentioned above, this term is usually processed to give an autocorrelation function:
| (7) |
which gives the temporal profile of the signal (alternately given here in terms of path length z=c t, where c is the speed of light) but with ambiguity about t=0 (z=0).
Instead of the linear representation of the signal shown above, let us consider |Ĩint(k)|2, where ~ is the Fourier transform:
| (8) |
This can be cast in the form of the bilinear Wigner distribution, through a simple coordinate transform, with
| (9) |
where the Jacobian of the transform is unity. This substitution yields
| (10) |
Now, according to Eq. (3), the Wigner distribution of the sample field is
| (11) |
which can be inverted to yield the ambiguity function:
| (12) |
This form can be inserted into Eq. (10) to yield
| (13) |
Thus, the bilinear representation of the interferogram signal is given by the overlap of the Wigner distribution of the sample field with that of reference field.
D. Bilinear Representation of a SOCT Signal
The TFD of a SOCT signal can be generated in a similar manner as the bilinear representation given above. Consider a frequency-domain SOCT signal that is processed with a window W to enable joint knowledge of the TFD:
| (14) |
Here the window can take the form of a Gaussian distribution such as
| (15) |
For the case in which the width of the window is significantly smaller than the bandwidth of the source (Δkw ≪ Δ k), we can approximate this signal as
| (16) |
This is a reasonable approximation in most practical cases, as the aim of processing the SOCT signal is to obtain frequency resolution.
The squared magnitude of the signal can again be cast in terms of the Wigner distribution by using a transform similar to that given above in Eqs. (8)–(13). The processed signal
| (17) |
upon coordinate transformation becomes
| (18) |
In Eq. (18), the SOCT signal has been processed to yield the temporal (depth) profile of the sample field at the specific frequency (wavelength) given by the center of the window, kw. By systematically varying the center frequency of the window, the TFD of the SOCT signal is generated. The resultant signal is given as the overlap of the Wigner distribution of the sample field with the effective Wigner distribution of the window function.
3. ANALYSIS
The utility of the TFD can be seen by examining a few simple cases that demonstrate its properties. Analysis of the distributions for time- and frequency-domain OCT signals shows that the knowledge of temporal coherence obtained with a TFD can clearly illustrate the advantage of frequency-domain OCT measurements versus data acquired in the time domain. In this section, we analyze the TFDs for OCT signals and relate the results to the signal acquired in each domain. This line of analysis is then extended to examine SOCT signals to demonstrate that knowledge obtained from TFD analysis reveals temporal coherence properties that can improve measurements of the structure of a sample.
A. TFD of a Two-Component Field
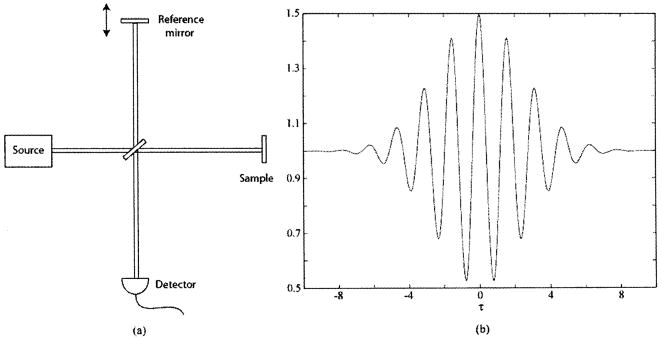
Let us consider a total optical field at frequency ω0 composed of two components separated by a time delay T, as one might find for a Michelson interferometer (Fig. 1) with the arms possessing a path-length mismatch, such that
Fig. 1.
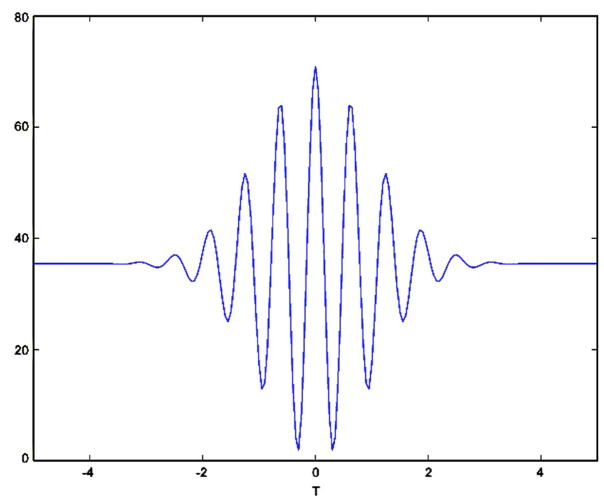
(a) Michelson interferometry scheme, in which modulation of the reference arm path length generates (b) an interferogram as in a time-domain OCT system using a low-coherence source.
| (19) |
where each component is a Gaussian pulse of width a and amplitude E0:
| (20) |
The TFD of this total field can be determined using the Wigner distribution,
| (21) |
to yield
| (22) |
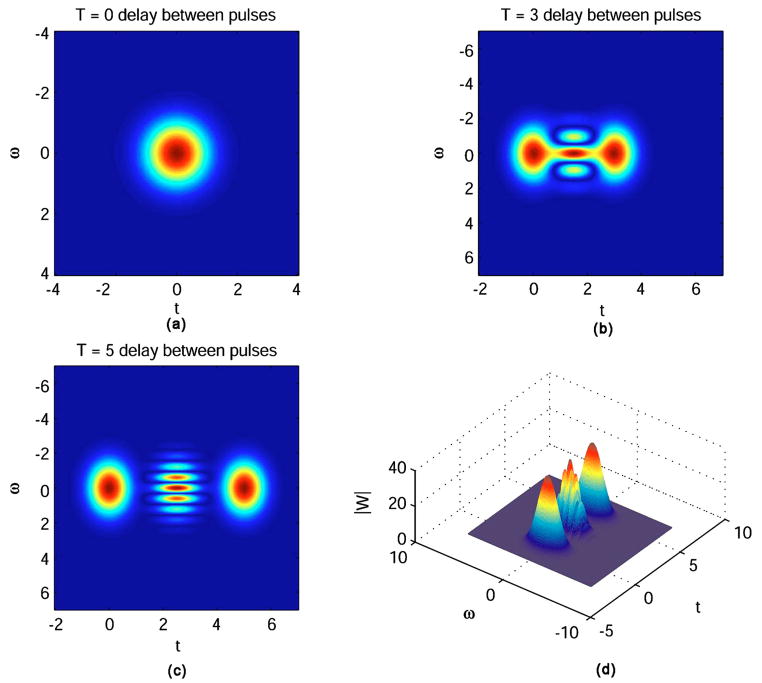
We can see from Eq. (22) that the Wigner distribution develops into the sum of three terms as presented in Eq. (4). The first two terms are Gaussian terms that we will call WR and WS. WR is delayed by T with respect to WS. The third term is a cross term (WCROSS) that has a Gaussian envelope and a sinusoidal oscillation. Figure 2 shows how the cross term emerges as the time delay T increases from zero. This term is distinct only when T ≠ 0 and is localized between WR and WS with respect to the time axis with all three terms centered about the frequency ω0.
Fig. 2.
Wigner distributions for a two-component signal with delay between pulses of (a) T=0, (b) T=3; (c), (d) T=5.
B. Time-Domain OCT Signal
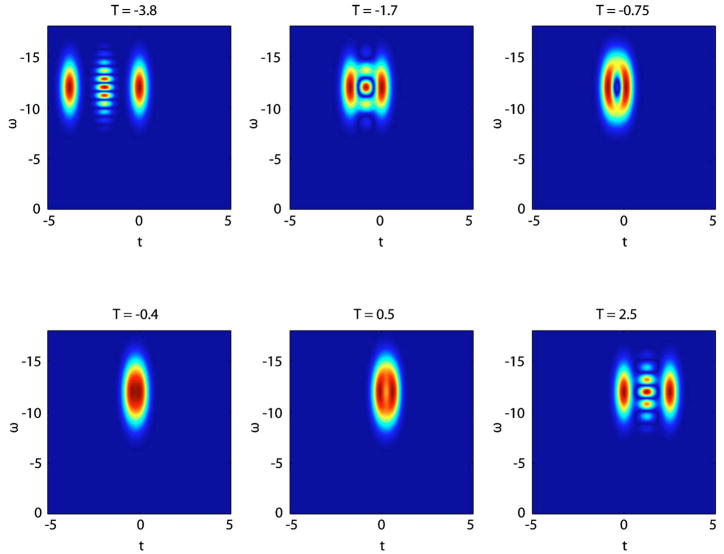
Let us now consider scanning the reference mirror of the Michelson interferometer, as in a time-domain OCT system, through all time delays τ, corresponding to a full depth scan. Figure 3 shows the signal for six selected time delays as a distribution in time and frequency, represented by the Wigner distribution. The cross term is seen to oscillate with a frequency characteristic of the time delay between pulses. At each time delay the signal is detected using a photodiode, effectively integrating the TFD across frequency. This reduces the distribution to the time marginal defined as the intensity per unit time:
| (23) |
Fig. 3.
Wigner distributions for time delay T and a center frequency of ω0 =12.5.
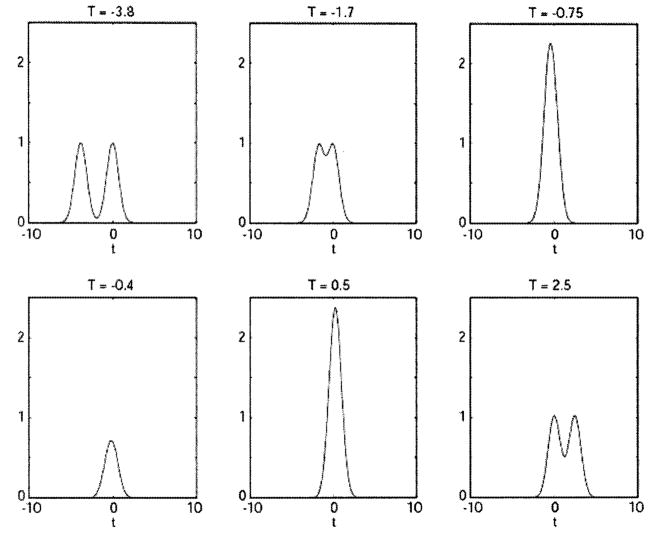
Figure 4 presents the time marginals corresponding to the delays shown in Fig. 3. As T moves closer to zero, the path-length mismatch of the sample and reference arms also gets smaller. The cross term appears between the two Gaussian peaks. As T crosses the zero point the path-length mismatch grows once again.
Fig. 4.
Time marginals for the Wigner distributions of Fig. 3.
The time-domain OCT signal is recorded as intensity as a function of the path-length difference. For each path-length difference, the signal detected is the time average of the time marginal. In terms of the Wigner distribution, each point of an OCT depth scan is simply the two-dimensional integral of the distribution for the corresponding value of T. The plots in Fig. 4 show the time marginals for six different depths of an OCT scan. Integrating each plot with respect to time will leave us with six discrete points that help make up the interferogram seen in Fig. 5.
Fig. 5.
C. Frequency-Domain OCT Signal
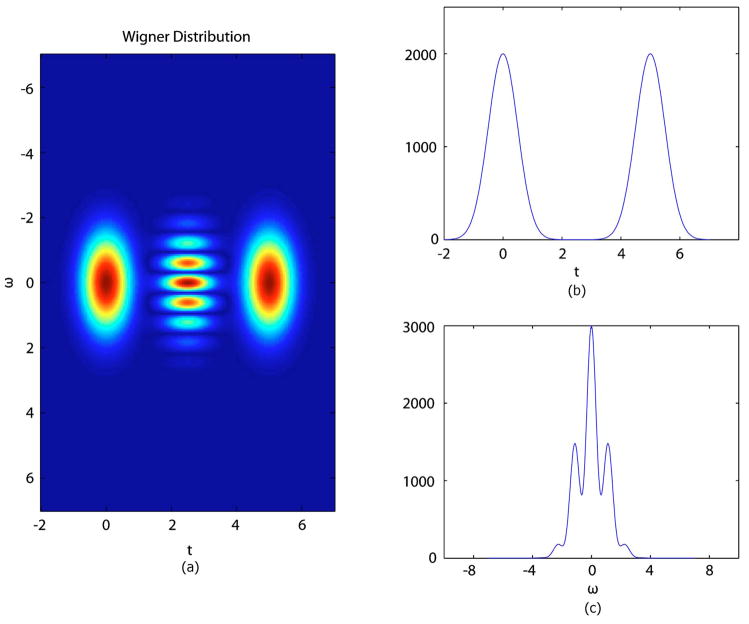
Figure 6 shows another example of a Wigner distribution for an optical signal from the Michelson geometry with mismatched path lengths as well as the corresponding time and frequency marginals. When the distribution is integrated with respect to frequency to obtain the time marginal, the sinusoidal cross term integrates to zero. If we instead integrate the distribution with respect to time, we generate the frequency marginal given as the intensity per unit frequency:
| (24) |
Fig. 6.
(a) Wigner distribution with T=5, (b) |s(t)|2 marginal, (c) |S(ω)|2 marginal.
Fourier-domain OCT systems [11–13] seek to measure the frequency marginal. However, most detection schemes recover the wavelength distribution of the signal where the wavelength is inversely proportional to the frequency. In such arrangements, the signal can be interpolated and rescaled to obtain the frequency distribution.
In its most simple form, Fourier-domain OCT uses a Michelson interferometer geometry like that of time-domain OCT. However, in Fourier-domain OCT the reference mirror is not scanned to selectively probe depths of the sample. Instead, the detected intensity is dispersed with respect to wavelength by using a diffraction grating. The recorded intensity is a frequency spectrum. Figure 6(c) shows the |S(ω)|2 marginal of the Wigner distribution, corresponding to a typical Fourier-domain OCT scan. This scan is a frequency spectrum that exhibits an oscillation due to the cross term. Unlike time-domain OCT, in Fourier-domain OCT it is not necessary to integrate the frequency marginal, although some averaging occurs due to the resolution limit imposed by the finite pixel size of any practical detector. The frequency-dependent oscillation of the spectrum can be Fourier transformed to yield the time delay between the two components, effectively producing a depth scan with a single measurement.
D. TFD for a SOCT Signal
To analyze the TFD for a SOCT signal, it is more useful to use an example in which the sample field exhibits a spectral modulation. Let us consider a sample field consisting of two components:
| (25) |
The corresponding Wigner distribution can be found using Eq. (4) to contain three components, one for each of the two field components and a cross term. As shown above, the cross term will produce an oscillation with a frequency characteristic of the delay between the two components.
The sample field given in Eq. (25) can be generated by a sample containing two reflectors. However, if these two reflectors are spaced too closely, such that the delay between the components is less than the pulse duration [a in Eq. (20)], the individual components cannot be resolved using conventional OCT, regardless of frequency- or time-domain signal acquisition. On the other hand, by reconstructing the TFD of the sample field from the detected signal, knowledge of the induced temporal coherence of the field due to the sample can be obtained. This knowledge can enable one to determine the structure of the sample on finer scales than is possible with the usual resolution associated with the pulse duration.
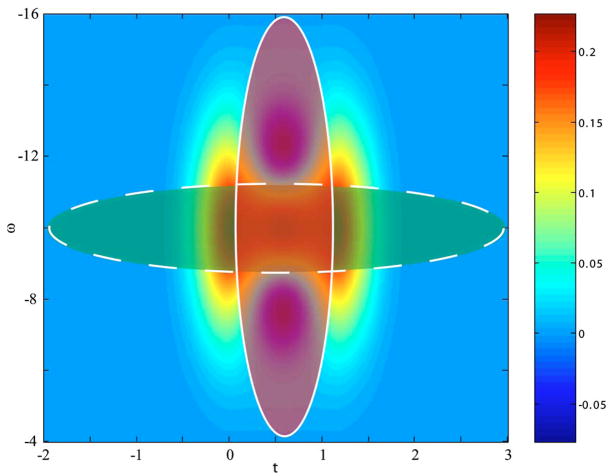
Figure 7 shows the Wigner distribution of the two component sample field given in Eq. (25). We reiterate here that with either frequency- or time-domain OCT, knowledge of the sample field is not obtained directly but rather the detected signal is the convolution of the signal field with a reference field, as shown in Eq. (13). To determine the delay between the two components of the sample field, we can analyze its TFD to obtain knowledge of the induced temporal coherence of the field due to the sample.
Fig. 7.
Wigner distribution of a two-component sample field with windows of narrow frequency width (green/dashed) and narrow time width (red/solid).
To construct the TFD for this sample field, the signal is processed using a window, as in the STFT. For a Gaussian window, as given in Eq. (15), there exists a trade-off between frequency and time resolution. Figure 7 illustrates this trade-off by showing the window based on two possible frequency widths. For the window with a narrow frequency width (green), high-frequency resolution is obtained but at the cost of poorer time (depth) resolution. On the other hand, a window with a wider frequency width (red) can be used, which preserves higher time (depth) resolution but yields poorer frequency resolution.
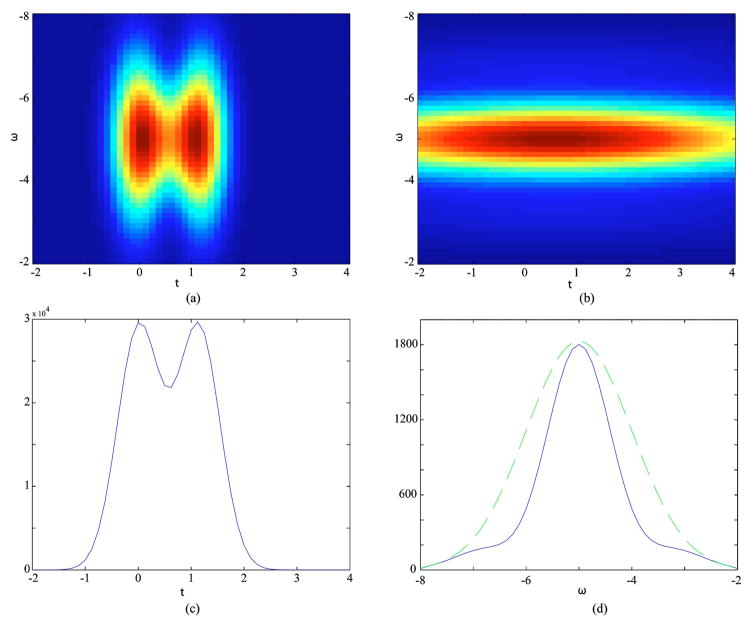
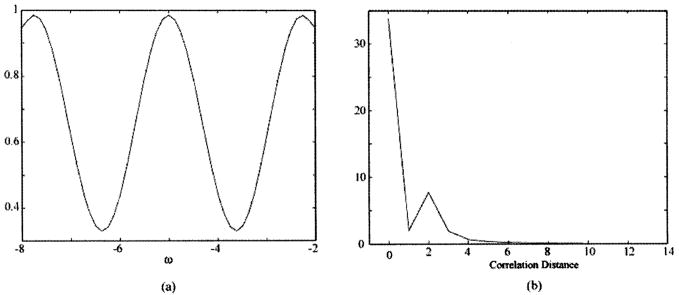
Processing via the use of the window produces another form of TFD. In the linear representation, the windowed signal gives the spectrogram of the signal [14]. In the bilinear representation, the TFD of the sample field is smoothed by that of the window function, as given by Eq. (18). Here, the Choi–Williams distribution for the sample field is obtained [14]. Figure 8 illustrates the TFD resulting from the use of each of the two Gaussian windows described above. Here we see that upon using a broad spectral window with good temporal resolution [Figs. 8(a) and 8(c)] the two peaks are just barely resolved. When using a narrow spectral window, the temporal resolution is degraded so that the two components of the sample field are not resolved [Fig. 8(b)]. However, the temporal coherence that is induced due to the structure of the sample causes a spectral modulation [Fig. 8(d)]. This modulation can be made more apparent by dividing through by the source spectrum [Fig. 9(a)]. Fourier transforming this spectral modulation yields a correlation function [Fig. 9(b)], which shows a sharp peak at the round-trip distance between the two sample interfaces. The correlation distance of 2 in Fig. 9(b) corresponds to two spectral oscillations [as seen in Fig. 9(a)] over the range of 6 frequency units. Dividing this by 2π and inverting, we recover the 1 spatial unit spacing seen in the original sample field distribution (Fig. 7).
Fig. 8.
Comparison of processing of SOCT signals using (a) broad and (b) narrow spectral windows. Using a broad spectral window maintains high temporal resolution but cannot resolve two closely spaced peaks (c). In comparison, using a narrow spectral window does not permit the peaks to be resolved but achieves spectral resolution (d) that shows a modulation of the spectral profile (blue/solid) compared with the original spectrum (green/dashed).
Fig. 9.
(a) Spectral modulation due to temporal coherence induced by sample. (b) Fourier-transforming spectral modulation yields a correlation function with the peak indicating the spacing of the two peaks in the signal field.
4. DISCUSSION
In the above analysis, we have examined the relationship between bilinear TFDs and OCT signals. We have shown that conventional OCT measurements reveal one aspect of the TFD of the total field, composed of the sum of the sample and reference fields. Time-domain OCT signals are described by integrating the TFD for the total field over frequency to yield the time marginal. The time marginal is then further integrated over time to yield the interference at a particular delay (depth) of the reference field relative to the sample field, with the complete delay (depth) scan requiring multiple successive measurements. In contrast, Fourier-domain OCT signals are obtained by integrating the total field TFD over time. Here no additional integration is needed but instead a Fourier transform is used to yield the delay (depth) scan. The increase in fidelity of Fourier-domain OCT [11–13] can be seen to originate from this difference in measurement. While these OCT measurements can be viewed as generated from the TFD, it is important to note that the true TFD of the total field may not be a physical quantity, making it inaccessible with a direct measurement such that it must be generated by other means.
Although the TFD is not directly measured in OCT, we have shown that the measured OCT signal can be easily related to the individual TFDs of the sample and reference fields. In Fourier-domain OCT, the detected signal is given by the overlap of the Wigner distributions for the sample and reference fields. Although not presented here, a similar derivation can be written for time-domain OCT signals. In SOCT, the window function takes the place of the reference field in the overlap integral. In this case, the detected signal takes the form of a different type of TFD. The overlap relations presented here are newly introduced to the field OCT but have been known in other fields for years. For example, similar relations are used in quantum mechanics and quantum optics [15].
In the Cohen class of functions [14], an infinite number of distributions can be generated with the appropriate choice of kernel. As an example, the Wigner distribution has a kernel equal to unity. In describing OCT signals, the Wigner function for the sample field is convolved with the Wigner function of the reference field. In the typical case where the reference field is a Gaussian distribution in time and frequency, the detected signal is then given by the Choi–Williams distribution [14], which can be viewed as a smoothed Wigner distribution. Although these relationships have been known in signal processing for decades, the concept of the TFD was only recently introduced to analysis of OCT signals [10]. However, this introductory work did not give explicit forms for the TFDs discussed, nor did it relate them to detected OCT signals, which may explain its limited impact.
The smoothing property of the Choi–Williams distribution results in a distribution that is positive definite, an essential feature for representing a detected signal. The Choi–Williams distribution is often applied to quell the cross terms that arise in the TFD represented by the Wigner distribution. As such, its use can eliminate the cross terms in the TFD of an OCT signal, which can reveal the existence of temporal coherence. For a measured signal given as a Choi–Williams distribution, the cross terms that describe temporal coherence generated due to the structure of a sample are often not readily identified in the detected signal.
Knowledge of this temporal coherence can be used to improve structural information obtained from OCT measurements. As shown above, processing the signal using a window function can generate a TFD for the detected signal. By judicious choice of the window parameters, features in the frequency spectrum can be uncovered that are characteristic of the temporal coherence induced in the field due to structures in the sample. This approach has been applied in Fourier-domain low-coherence interferometry to enable the size of scatterers to be determined with a precision and accuracy that exceeds that possible with conventional OCT images [8,9]. More recently, this type of processing has been introduced to OCT imaging to improve knowledge of the sample scattering features [7,16,17].
Although the TFDs presented here are instructive for understanding the role of temporal coherence in analysis of SOCT signals, they have not provided a means to skirt the trade-off between time and frequency resolutions associated with application of a Gaussian window. However, by connecting the analysis of OCT signals with the vast literature on processing time–frequency distributions, a new avenue for improving the applicability of SOCT has been established.
5. CONCLUSION
In summary, we have examined the relationship between OCT signals and bilinear time–frequency distributions. We have shown that OCT signals in the time and frequency domains can be viewed as marginals of the total field TFD. Further, we have shown that the detected OCT signals are given by overlap integrals of the individual Wigner distributions of the sample and reference fields. Examination of spectroscopic OCT signals in this framework shows that the cross terms that appear in TFDs contain information on temporal coherence that can be analyzed to improve our knowledge of samples of interest. New directions for analysis of OCT signals have been suggested based upon using bilinear representations of the OCT signals and employing well-established methods from conventional signal processing of time–frequency distributions.
Acknowledgments
This work has been supported by grants from the Coulter Foundation, the National Institutes of Health (NCI R21-CA120128), and the National Science Foundation (BES 03-48204). R. N. Graf is supported by a training grant from the NIH (EB001040-01).
Footnotes
OCIS codes: 120.3180, 170.4500, 070.6020.
References
- 1.Huang D, Swanson EA, Lin CP, Schuman JS, Stinson WG, Chang W, Hee MR, Flotte T, Gregory K, Puliafito CA, Fujimoto JG. Optical coherence tomography. Science. 1991;254:1178–1181. doi: 10.1126/science.1957169. [DOI] [PMC free article] [PubMed] [Google Scholar]
- 2.Izatt JA, Kulkarni MD, Wang HW, Kobayashi K, Sivak MV. Optical coherence tomography and microscopy in gastrointestinal tissues. IEEE J Sel Top Quantum Electron. 1996;2:1017–1028. [Google Scholar]
- 3.Wax A, Pyhtila JW, Graf RN, Nines R, Boone CW, Dasari RR, Feld MS, Steele VE, Stoner GD. Prospective grading of neoplastic change in rat esophagus epithelium using angle-resolved low-coherence interferometry. J Biomed Opt. 2005;10:051604. doi: 10.1117/1.2102767. [DOI] [PubMed] [Google Scholar]
- 4.Wax A, Yang CH, Muller MG, Nines R, Boone CW, Steele VE, Stoner GD, Dasari RR, Feld MS. In situ detection of neoplastic transformation and chemopreventive effects in rat esophagus epithelium using angle-resolved low-coherence interferometry. Cancer Res. 2003;63:3556–3559. [PubMed] [Google Scholar]
- 5.Kulkarni MD, Izatt JA. Conference on Lasers and Electro-Optics, Vol. 9 of OSA Technical Digest Series (Optical Society of America, 1996); pp. 59–60. [Google Scholar]
- 6.Morgner U, Drexler W, Kartner FX, Li XD, Pitris C, Ippen EP, Fujimoto JG. Spectroscopic optical coherence tomography. Opt Lett. 2000;25:111–113. doi: 10.1364/ol.25.000111. [DOI] [PubMed] [Google Scholar]
- 7.Xu CY, Vinegoni C, Ralston TS, Luo W, Tan W, Boppart SA. Spectroscopic spectral-domain optical coherence microscopy. Opt Lett. 2006;31:1079–1081. doi: 10.1364/ol.31.001079. [DOI] [PubMed] [Google Scholar]
- 8.Wax A, Yang CH, Izatt JA. Fourier-domain low-coherence interferometry for light-scattering spectroscopy. Opt Lett. 2003;28:1230–1232. doi: 10.1364/ol.28.001230. [DOI] [PubMed] [Google Scholar]
- 9.Graf RN, Wax A. Nuclear morphology measurements using Fourier domain low coherence interferometry. Opt Express. 2005;13:4693–4698. doi: 10.1364/opex.13.004693. [DOI] [PMC free article] [PubMed] [Google Scholar]
- 10.Xu CY, Kamalabadi F, Boppart SA. Comparative performance analysis of time–frequency distributions for spectroscopic optical coherence tomography. Appl Opt. 2005;44:1813–1822. doi: 10.1364/ao.44.001813. [DOI] [PubMed] [Google Scholar]
- 11.Leitgeb R, Hitzenberger CK, Fercher AF. Performance of fourier domain vs. time domain optical coherence tomography. Opt Express. 2003;11:889–894. doi: 10.1364/oe.11.000889. [DOI] [PubMed] [Google Scholar]
- 12.de Boer JF, Cense B, Park BH, Pierce MC, Tearney GJ, Bouma BE. Improved signal-to-noise ratio in spectral-domain compared with time-domain optical coherence tomography. Opt Lett. 2003;28:2067–2069. doi: 10.1364/ol.28.002067. [DOI] [PubMed] [Google Scholar]
- 13.Choma MA, Sarunic MV, Yang CH, Izatt JA. Sensitivity advantage of swept source and Fourier domain optical coherence tomography. Opt Express. 2003;11:2183–2189. doi: 10.1364/oe.11.002183. [DOI] [PubMed] [Google Scholar]
- 14.Cohen L. Time frequency-distributions-a review. Proc IEEE. 1989;77:941–981. [Google Scholar]
- 15.Leonhardt U. Measuring the Quantum State of Light. Cambridge U. Press; 1997. [Google Scholar]
- 16.Xu CY, Carney PS, Boppart SA. Wavelength-dependent scattering in spectroscopic optical coherence tomography. Opt Express. 2005;13:5450–5462. doi: 10.1364/opex.13.005450. [DOI] [PubMed] [Google Scholar]
- 17.Adler DC, Ko TH, Herz PR, Fujimoto JG. Optical coherence tomography contrast enhancement using spectroscopic analysis with spectral autocorrelation. Opt Express. 2004;12:5487–5501. doi: 10.1364/opex.12.005487. [DOI] [PubMed] [Google Scholar]


